 Click to zoom
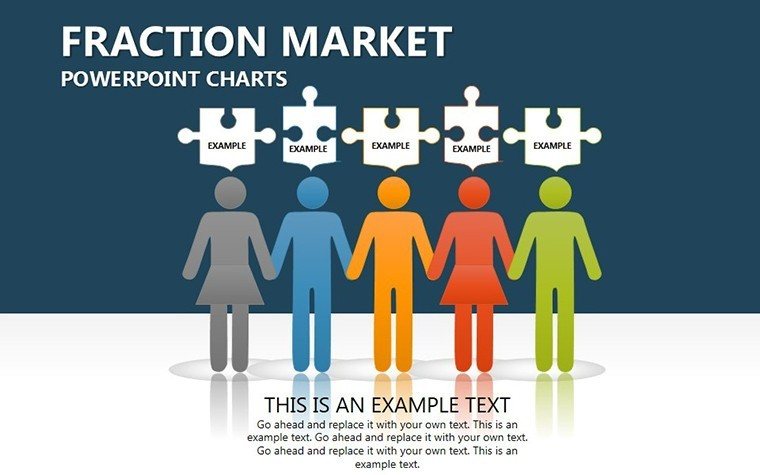
Fraction Market PowerPoint Charts: Slice Through Market Complexities
| Format | .pptx |
| Slides | 13 unique layouts |
| Aspect ratio | 16:9 |
| Compatibility | PowerPoint |
| Animated | No |
| Language | English |
| License | Commercial |
| File size | — |
| Version | v1.0 |
| Last updated | August 2023 |
What's inside
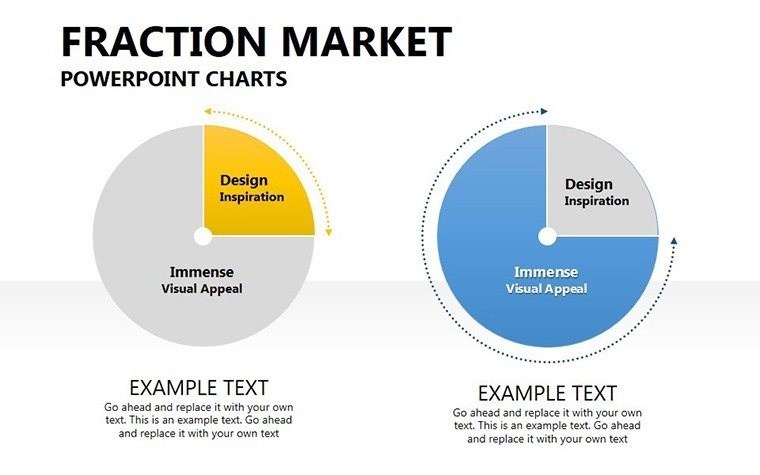
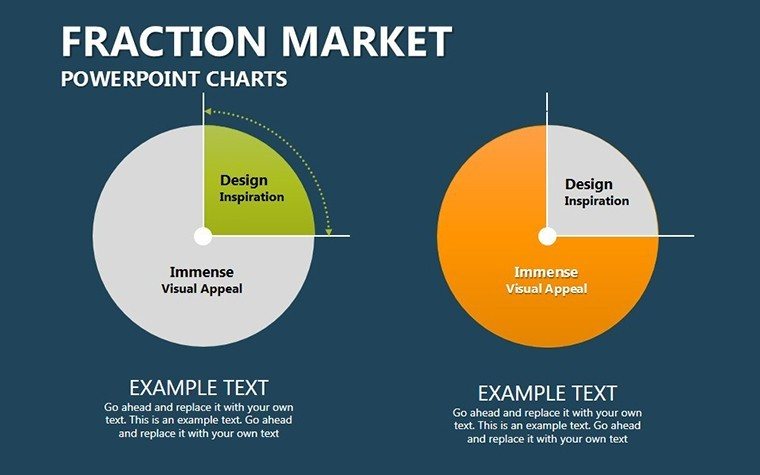
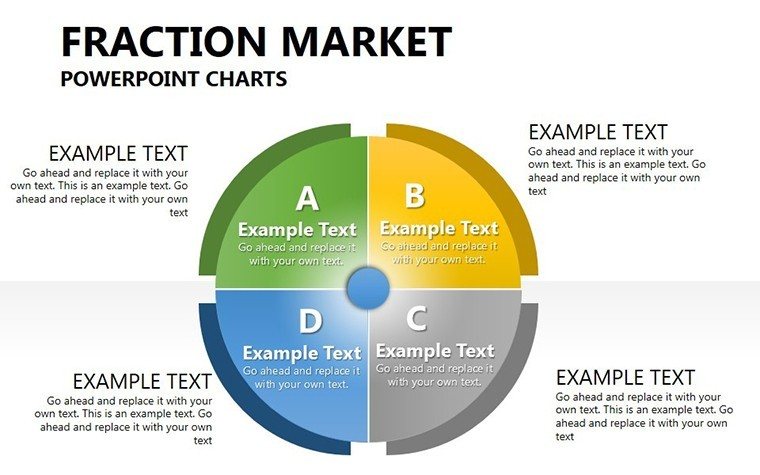
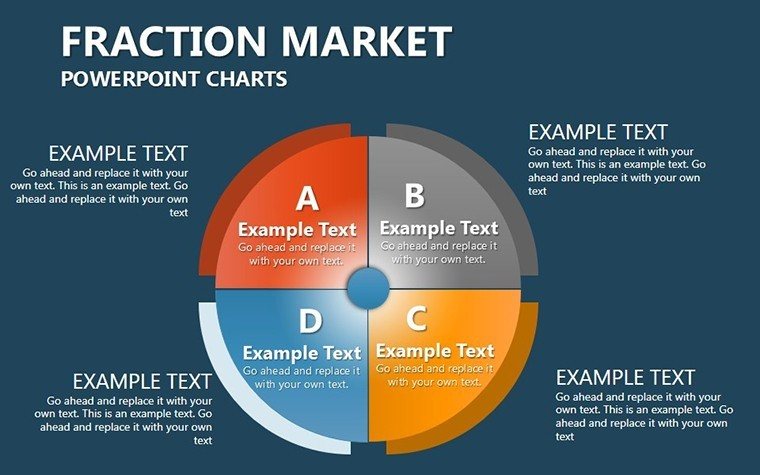
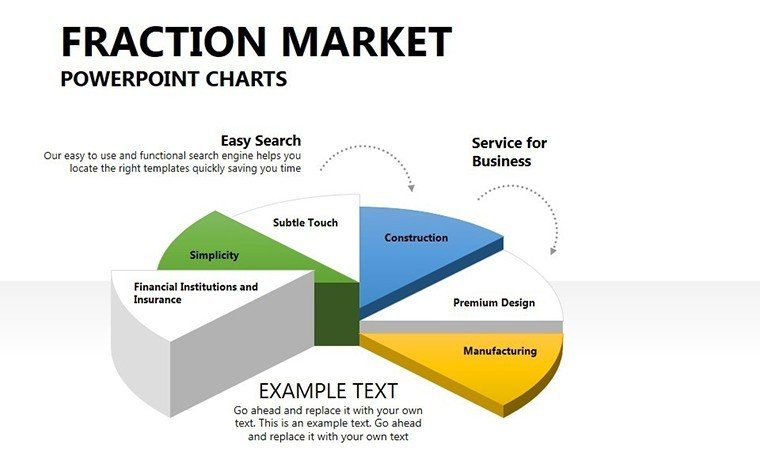
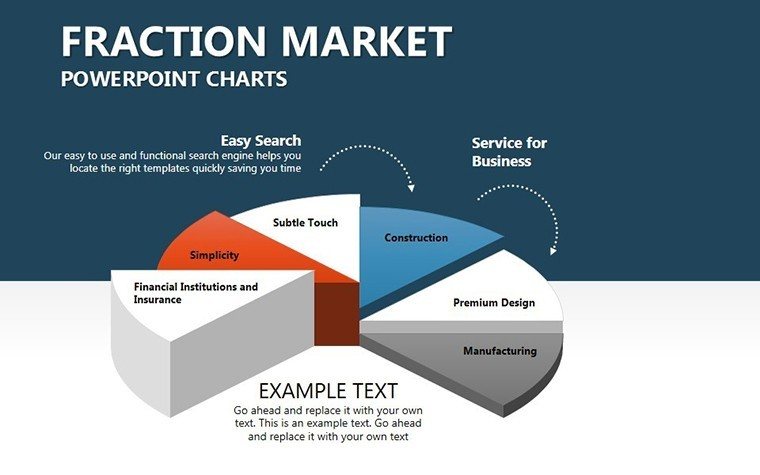
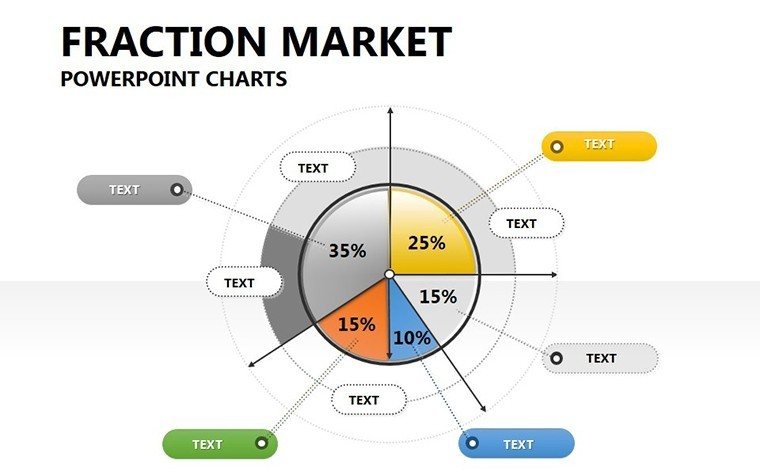
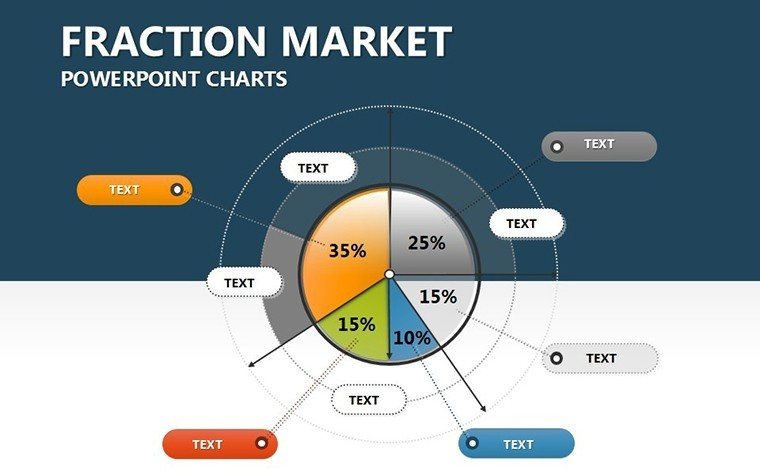
Markets don't yield secrets easily, but with our Fraction Market PowerPoint Charts Template, you hold the knife. This 13-slide gem is forged for executives, researchers, and marketers wrestling with share slices and segment breakdowns, transforming opaque datasets into opulent overviews that inform and inspire. Forget fumbling with fractions - here, every pie chart portion pulses with purpose, every bar breathes business acumen.
Aimed at academia's analysts and boardroom tacticians, the template spotlights pie charts for dominance distributions and bars for growth gradients, all editable to etch your narrative. PowerPoint and Google Slides native, it invites effortless embeds from market intel tools like Statista. Echoing triumphs like Procter & Gamble's category conquests via visual audits, we've layered in principles of perceptual accuracy - ensuring proportions pop without perceptual pitfalls.
Impact? Profound. Visuals boost comprehension by 400% (per 3M studies), turning "market fraction" musings into mandate-moving moments. Ideal for annual audits or thesis defenses, it's your scaffold for structured scrutiny. Sharpen your edge as we segment the strengths.
Signature Features: Precision in Every Portion
Core to the 13 slides: Radical editability - morph pies for niche niches or elongate bars for longitudinal looks, all vector-sharp.
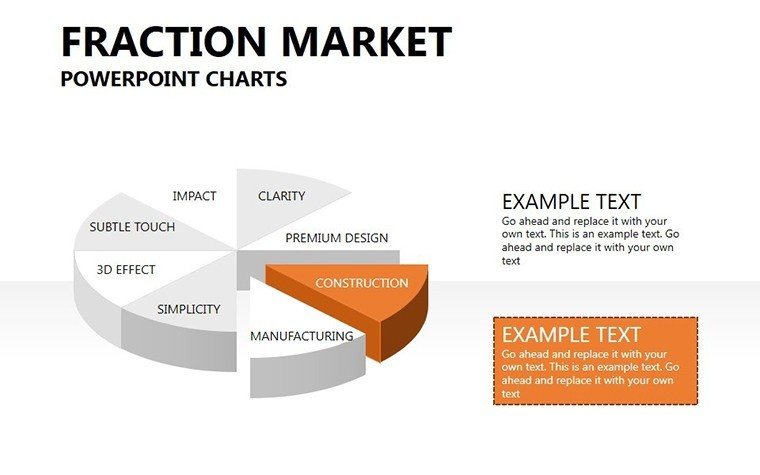
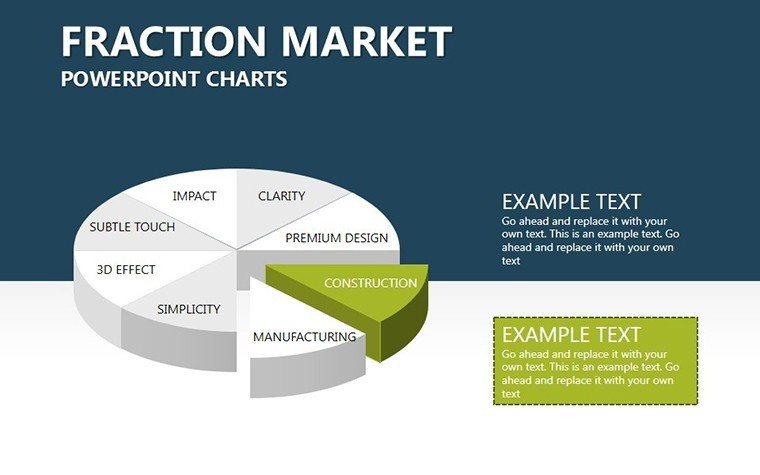
- Nuanced Pie Charts: Dissect shares by demographic, with exploded segments for standout stories.
- Balanced Bar Graphs: Align competitors' fractions, shading surpluses for strategic spotlights.
- Adaptive Layouts: Flow diagrams link fractions to forecasts, fostering fluid narratives.
Color coders? Intuitive. Animations? Layered for progressive unveils, mirroring market evolutions.
Dynamic Deployments: Academia to Enterprise
Investor updates? Pies parcel portfolio penetrations, justifying expansions. Research recaps? Bars benchmark baselines, validating hypotheses.
Parallel: Harvard Biz case studies credit such slices for 25% sharper strategies. Tutors? Animate for interactive fraction fixes in econ labs.
- Input Intel: Drag from Nielsen reports - auto-sums safeguard sums.
- Style Slices: Gradient fills for depth, aligning with corp chromatics.
- Sequence Stories: Order from whole to wedge for logical layers.
- Distribute Decks: Versatile formats for virtual or venue venues.
Ritual refines rigor, halving hassle per prof feedback.
Eclipsing Everyday Data Dumps
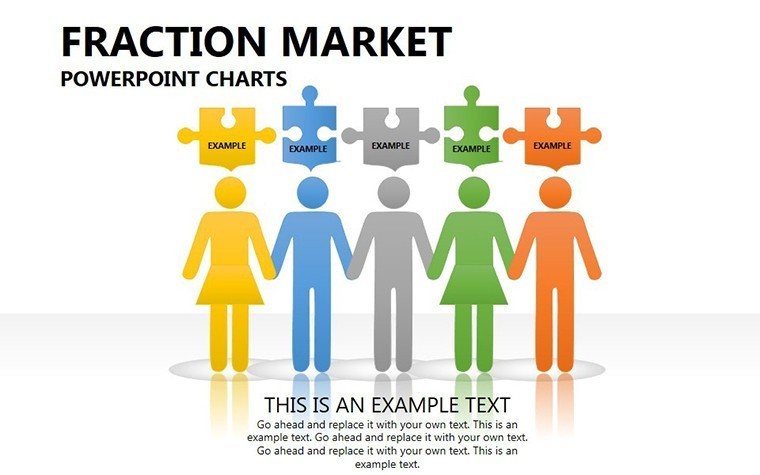
Default diagrams? Dull. Ours? Dynamic, with fraction formulas and icon infusions like pie-piece puzzles. LSI layers - "share pie visuals," "market bar breakdowns" - lift legibility.
Inclusivity? Contrast checks and tag templates tune for all audiences.
Scholarly Shortcuts for Slice Savvy
Tip: Halo highlights on key fractions for focus fire. Quip: "This slice is the apple of our market's eye!" Sync with SEMrush for live lifts.
As an analytics artisan scripting for think tanks, I vouch: These charts carve clarity from clutter.
Claim Your Market Cut: Download Instantly
Fractions await your forge. Grab the Fraction Market PowerPoint Charts Template - timely tweaks, timeless tools. Download now to master shares.
Frequently Asked Questions
Best for visualizing market shares?
Pie charts shine, with editable wedges for precise proportions.
Google Slides friendly?
Fully, with sync'd edits for group grinds.
Custom data integration?
Yes, placeholders plug from CSVs seamlessly.
Animation options?
Built-in for phased fraction reveals.
For business or academic?
Both - versatile for reports or research.
Accuracy in fractions?
Auto-calcs ensure sum-to-100 fidelity.
Good for
- Project roadmaps and sprint plans
- Product launch timelines
- Quarterly or annual review decks
- Company history and milestone summaries
Licence
reviews
Used this for a startup pitch and the charts looked organized.
The template didn’t crash PowerPoint which already made me happy.
Some pages had awkward text spacing.
The line graph slide was the one I used the most.
Good enough when you don’t have time to build charts from scratch.
FAQ
Will it work in Google Slides?
Are fonts embedded?
Can I use this for client work?
What's the refund policy?
Do you update the template after purchase?
Similar templates
See all PowerPoint Charts →

All 13 slides