 Click to zoom
Scrum Process Flow PowerPoint Charts Template
| Format | .pptx |
| Slides | 26 unique layouts |
| Aspect ratio | 16:9 |
| Compatibility | PowerPoint |
| Animated | No |
| Language | English |
| License | Commercial |
| File size | — |
| Version | v1.0 |
| Last updated | September 2023 |
What's inside
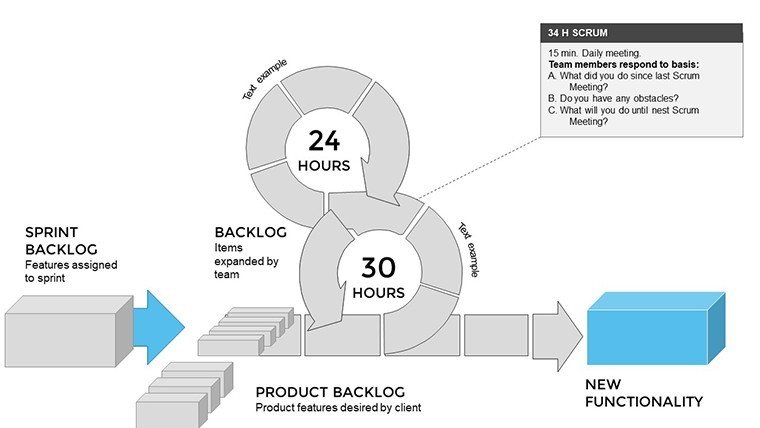
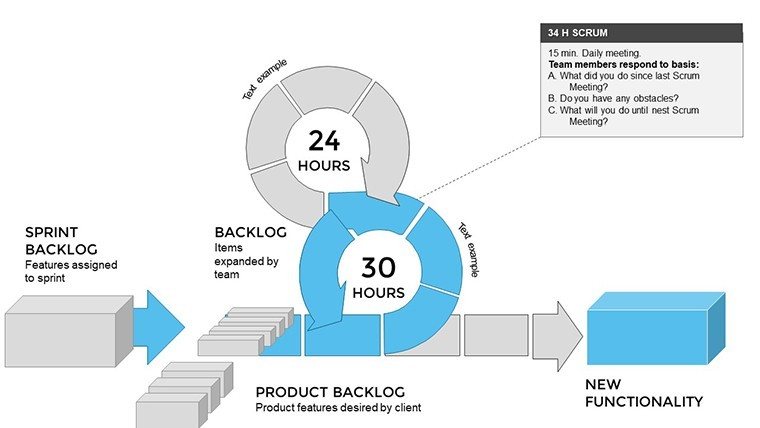
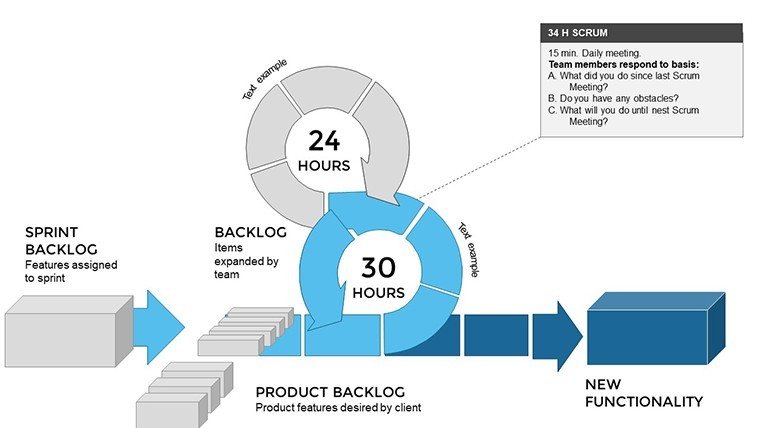
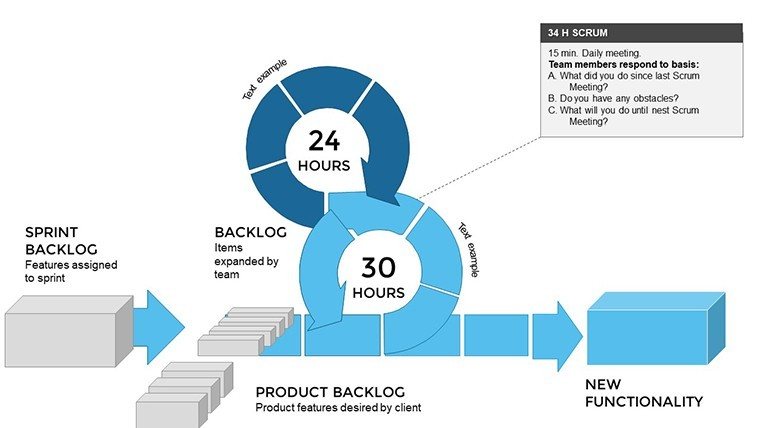
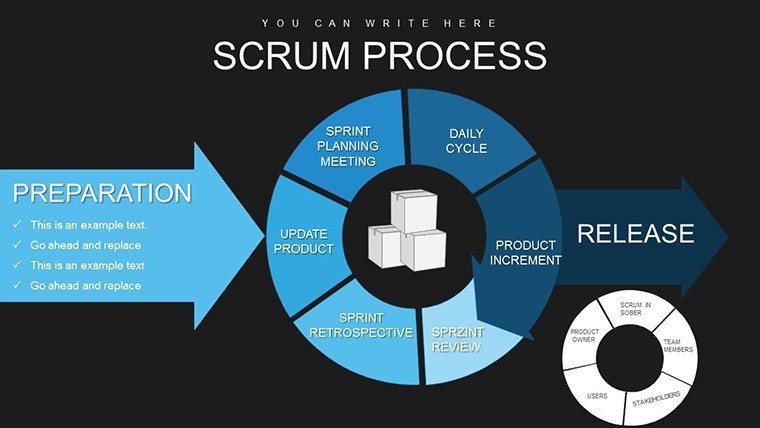
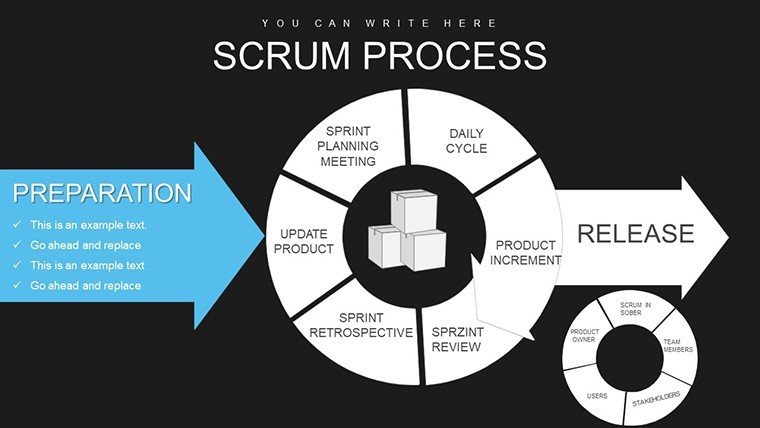
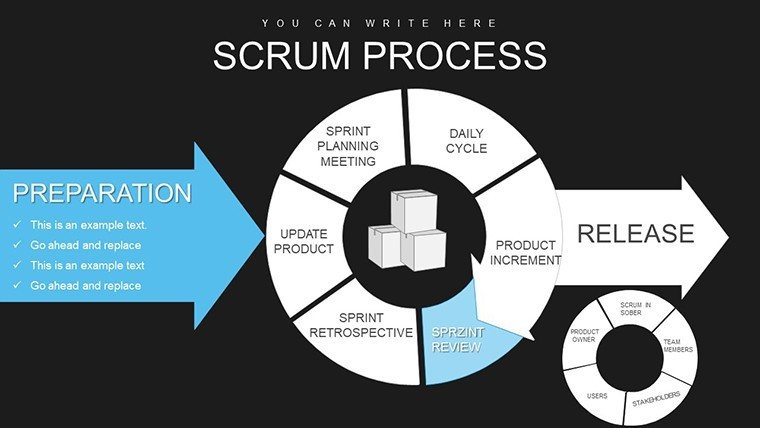
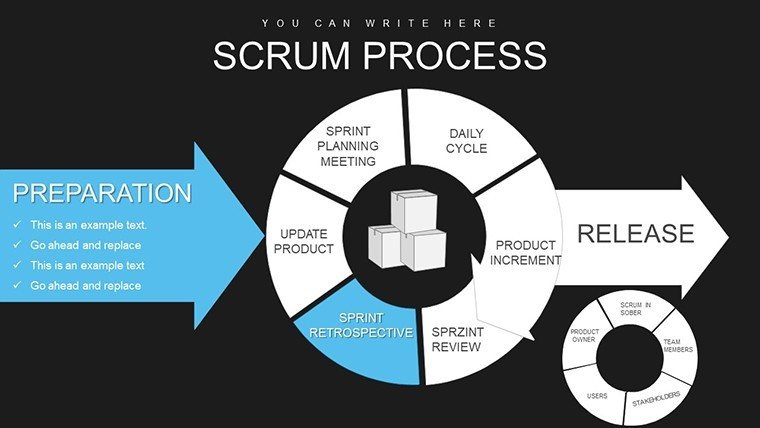
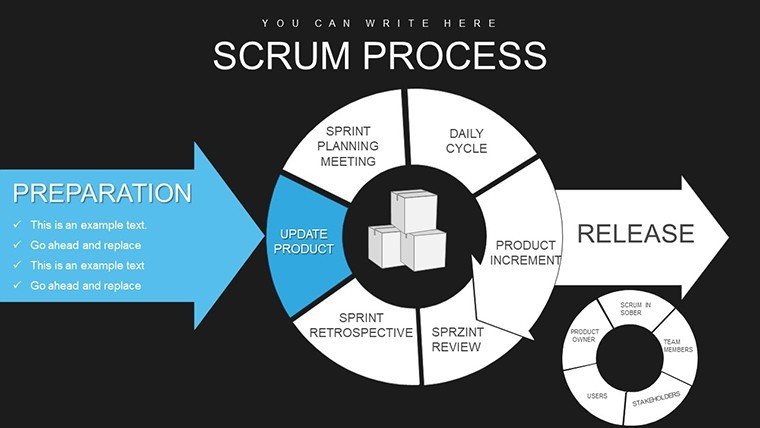
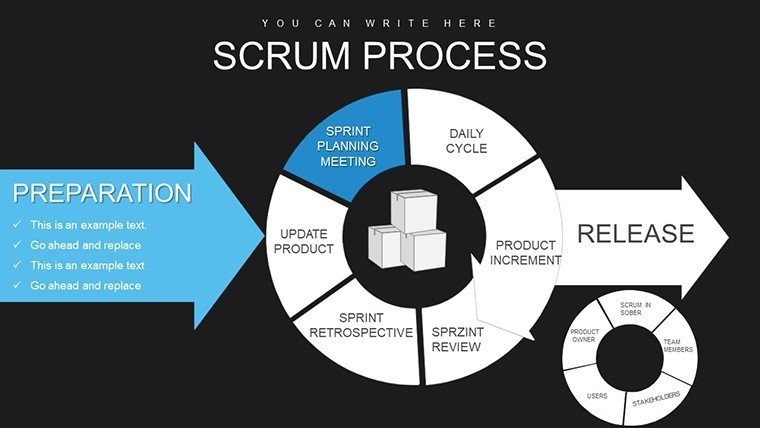
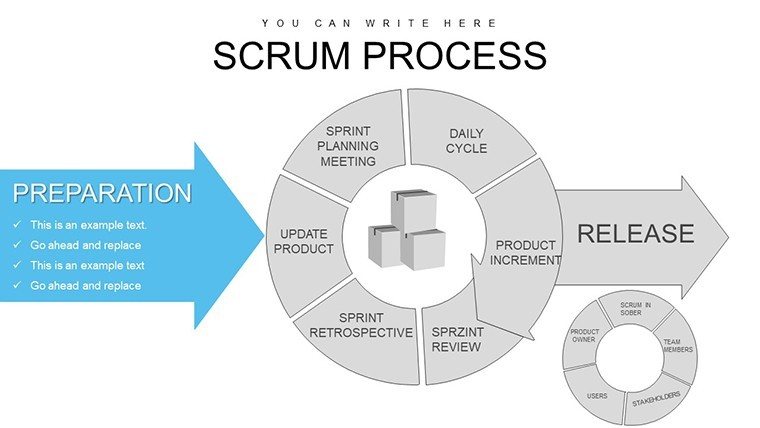
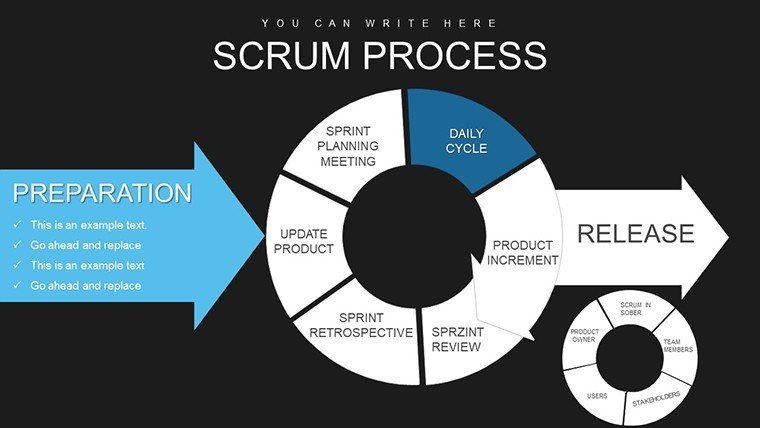
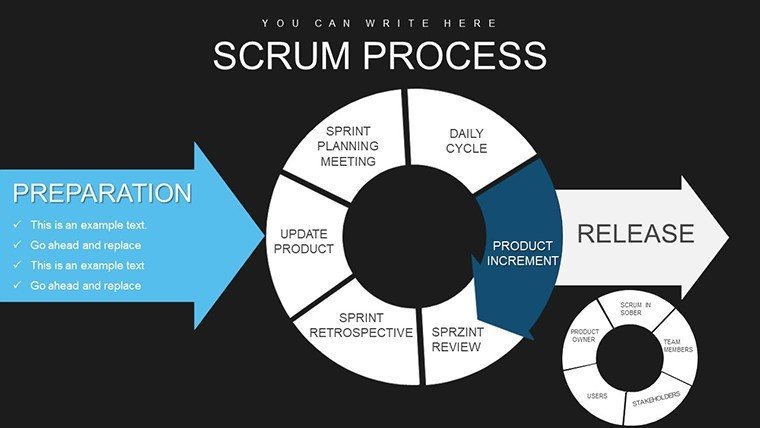
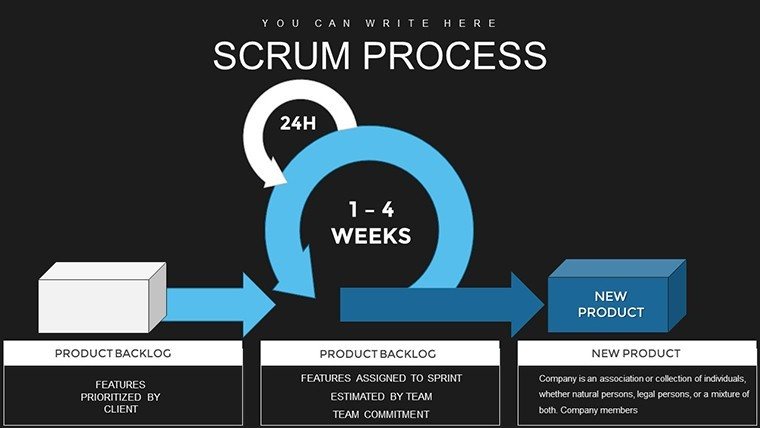
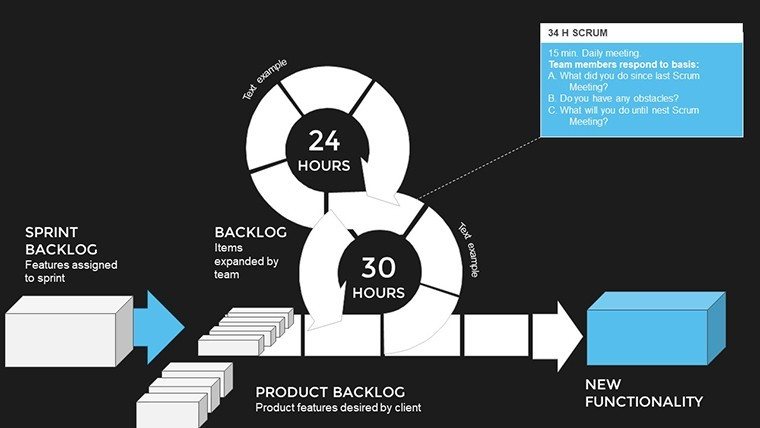
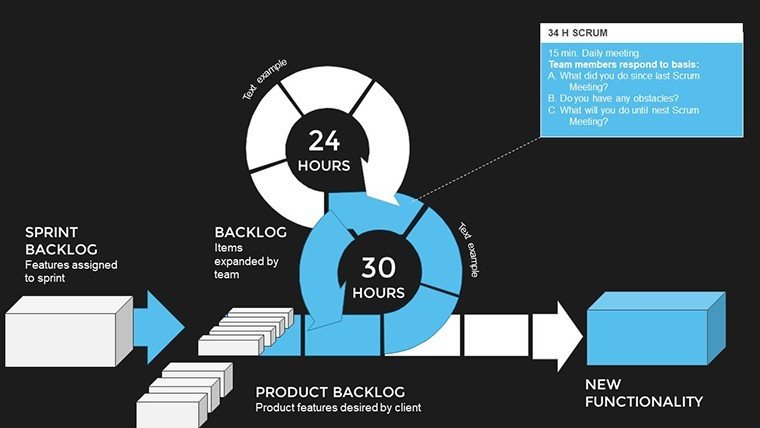
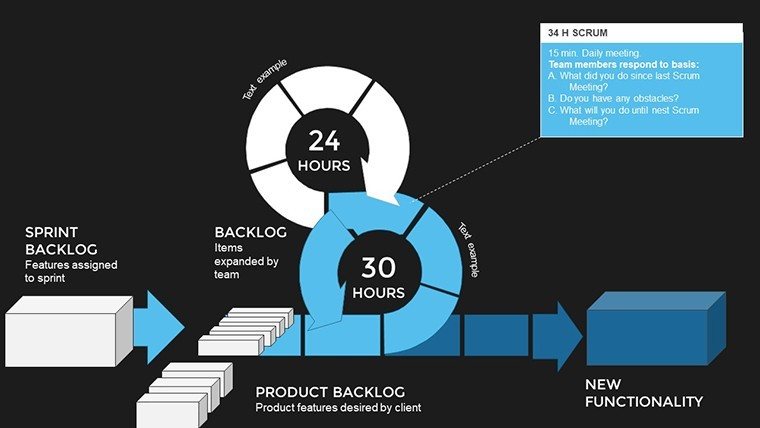
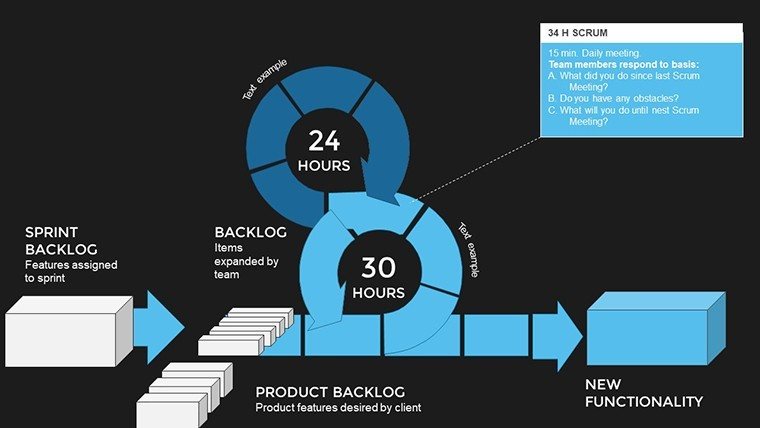
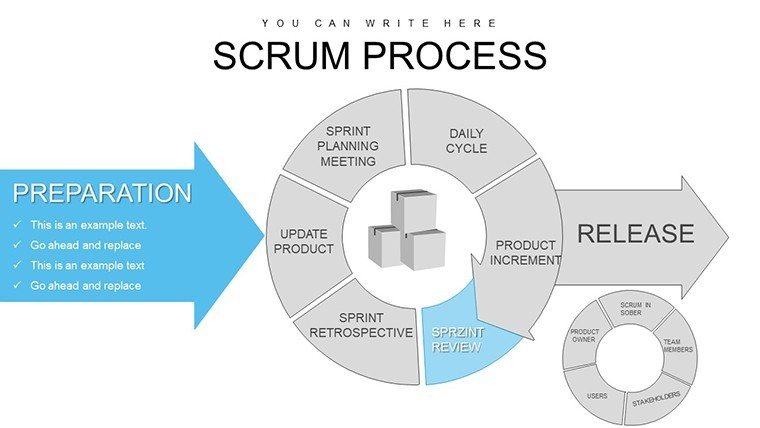
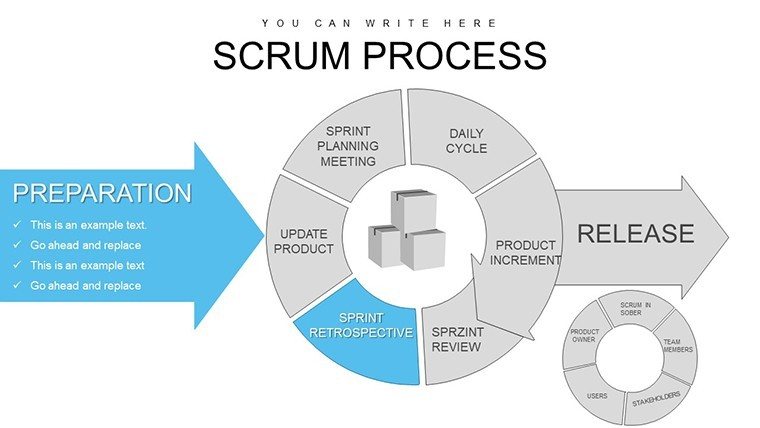
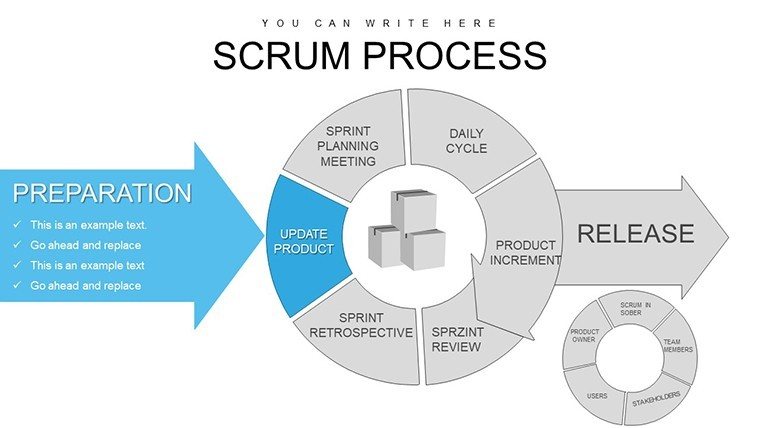
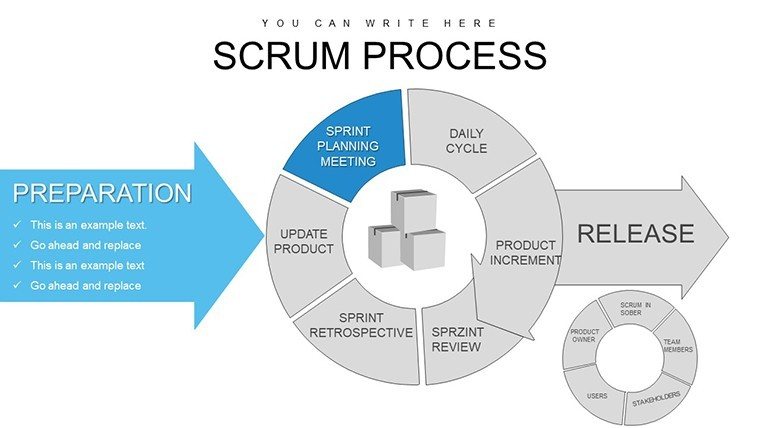
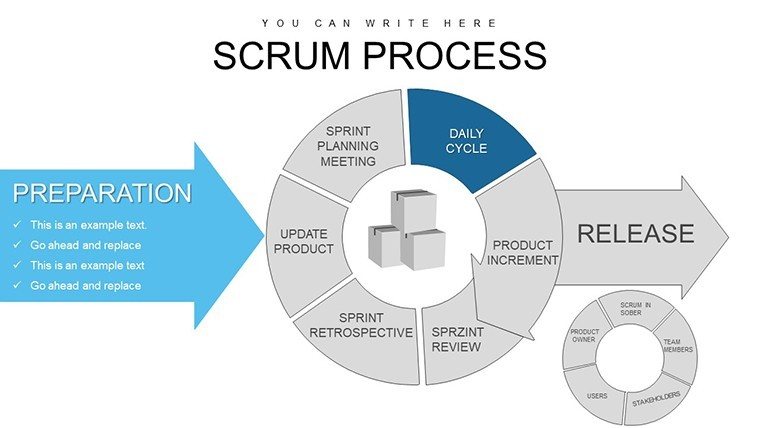
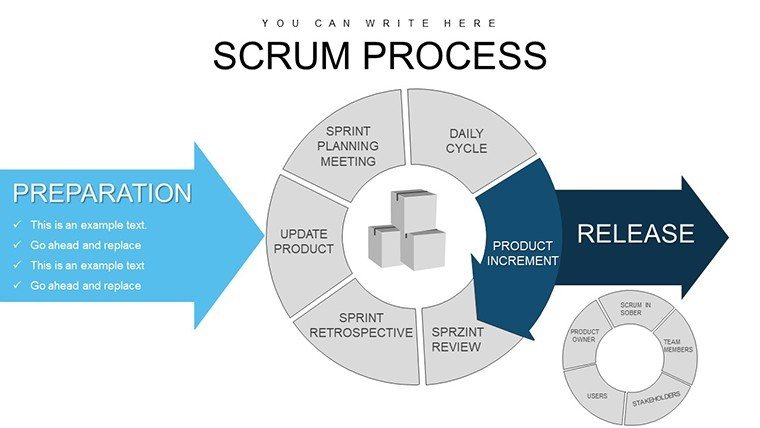
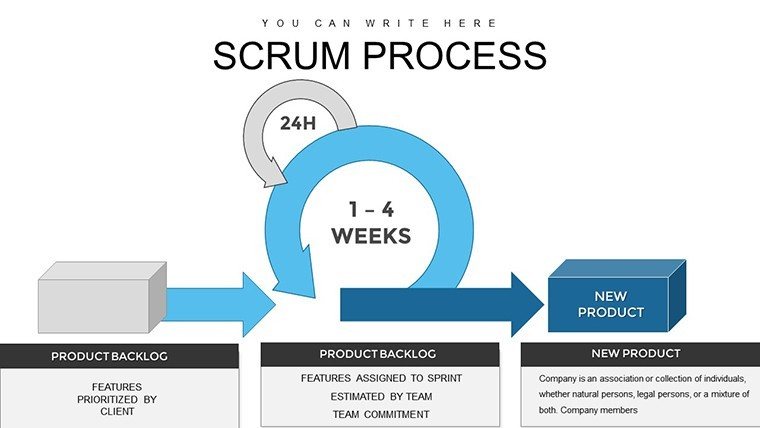
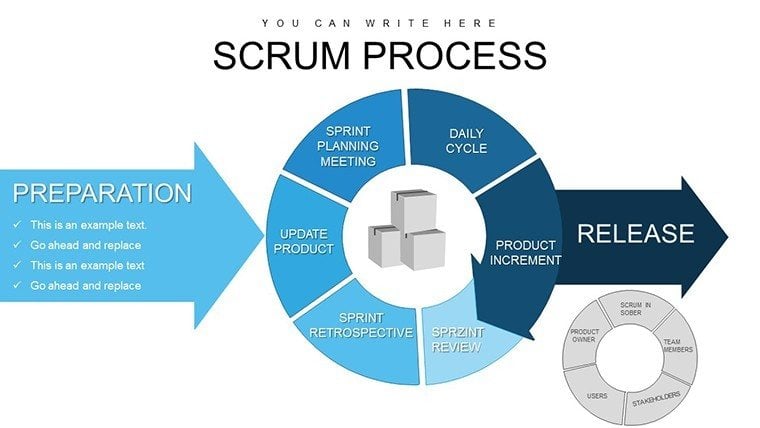
Navigating the complexities of agile project management demands tools that clarify rather than complicate. Enter our Scrum Process Flow PowerPoint Charts Template, a game-changer for teams embracing iterative development. With 26 meticulously crafted, editable slides, this template turns abstract scrum ceremonies into tangible, visual roadmaps. Tailored for project managers who juggle sprints and backlogs, it highlights key elements like product backlogs, sprint planning, and retrospectives with intuitive flow diagrams and pie charts. Compatible with PowerPoint and Google Slides, it ensures smooth integration into your existing workflow, whether you're in a co-located team or remote setup. Forget clunky, outdated charts that fail to capture the essence of scrum - this template infuses energy into your presentations, making stakeholders nod in agreement as they grasp your progress at a glance. It's more than visuals; it's a catalyst for aligned, motivated teams driving projects to successful completions.
Unlocking Agile Excellence with Scrum Flows
Scrum isn't just a methodology; it's a mindset, and our charts embody that by providing structured yet flexible visuals. Inspired by the Scrum Guide's principles, these flows help demystify roles like product owner and scrum master, using color-coded paths to show interactions. For example, in software development firms following SAFe frameworks, teams can map scaled agile processes, where pie charts break down velocity metrics and flows illustrate dependency resolutions. This approach not only adheres to best practices but elevates your authority in agile circles. In contrast to PowerPoint's default flowcharts, which often appear rigid and uninspiring, our template offers fluid designs with connector lines that adapt automatically, saving you precious setup time.
Standout Features for Seamless Scrum Visualization
- Integrated Flow Diagrams: Pre-built paths for scrum events, from daily standups to sprint reviews.
- Pie Chart Variants: Segment data for burndown charts or team capacity allocations.
- Customization Ease: Drag-and-drop elements, theme-consistent icons, and font scalability.
- Collaborative Tools: Notes sections for team inputs and export options for Jira integration.
- Visual Enhancements: Gradient fills and shadow effects for a modern, professional look.
Backed by 266 user ratings, these features address common pain points, like visualizing sprint goals without overwhelming slides. Educators training on agile can use them to simulate real sprints, aligning with PMI-ACP certification prep.
Diverse Applications in Agile Environments
Picture a team leader facilitating a retrospective: our flows chart what went well versus improvements, with pies quantifying feedback themes. This fosters constructive discussions and actionable insights. For consultants advising on digital transformations, integrate the template with case studies - like a retail giant that reduced time-to-market by 30% post-scrum adoption, visualized through before-and-after flows. Step-by-step usage: Open in PowerPoint, select a flow slide, populate with your sprint data, adjust pie segments via data editor, add custom icons from the agile-themed library, and animate transitions for emphasis. This streamlined process integrates with tools like Trello or Azure DevOps for data import.
In educational contexts, professors can adapt flows for case-based learning, such as analyzing Spotify's squad model. The template's real value emerges in high-stakes stakeholder meetings, where clear visuals prevent miscommunications and build trust. Imagine a non-profit coordinating volunteer efforts - scrum flows map task assignments, ensuring efficient resource use compliant with grant reporting standards.
Expert Tips to Enhance Your Scrum Presentations
- Use consistent color schemes for roles - e.g., blue for scrum master tasks - to aid quick recognition.
- Incorporate real-time data links if advanced, for live updates during reviews.
- Balance text and visuals; aim for 20% text to let flows dominate.
- Rehearse with timers to match sprint demo paces.
- Duplicate slides for what-if scenarios in planning sessions.
Versus basic tools, this template offers deeper insights, like embedded formulas for pie calculations, enhancing accuracy and professionalism.
Empower Your Team Now
Don't let scrum complexities hinder your progress. Grab this template and flow towards agile mastery, where every presentation propels your projects forward with clarity and confidence.
Frequently Asked Questions
How customizable are the scrum flow charts?Extremely - edit paths, colors, and add elements freely in PowerPoint.Does it support remote collaboration?Yes, fully compatible with Google Slides for team edits.Are there templates for specific scrum artifacts?Included slides for backlogs, burndowns, and velocity tracking.Can I integrate with agile software?Export/import data easily to tools like Jira.Good for
- Project roadmaps and sprint plans
- Product launch timelines
- Quarterly or annual review decks
- Company history and milestone summaries
Licence
reviews
Used this template for a college project and it saved me time.
The charts were readable and not overloaded.
A couple slides had too many arrows for my taste.
I liked how fast I could replace the demo content.
Pretty practical set of slides overall.
FAQ
Will it work in Google Slides?
Are fonts embedded?
Can I use this for client work?
What's the refund policy?
Do you update the template after purchase?
Similar templates
See all PowerPoint Charts →
All 26 slides