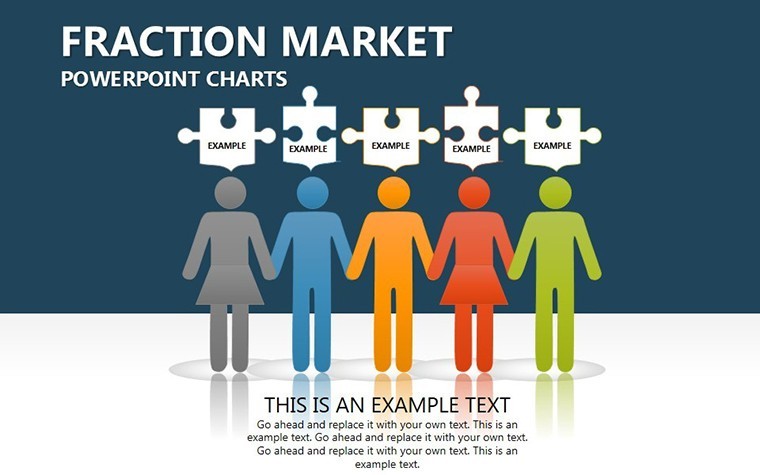
 Click to zoom
Hierarchical Needs Keynote Chart Template
| Format | .pptx |
| Slides | 13 unique layouts |
| Aspect ratio | 16:9 |
| Compatibility | PowerPoint |
| Animated | No |
| Language | English |
| License | Commercial |
| File size | — |
| Version | v1.0 |
| Last updated | October 2021 |
What's inside
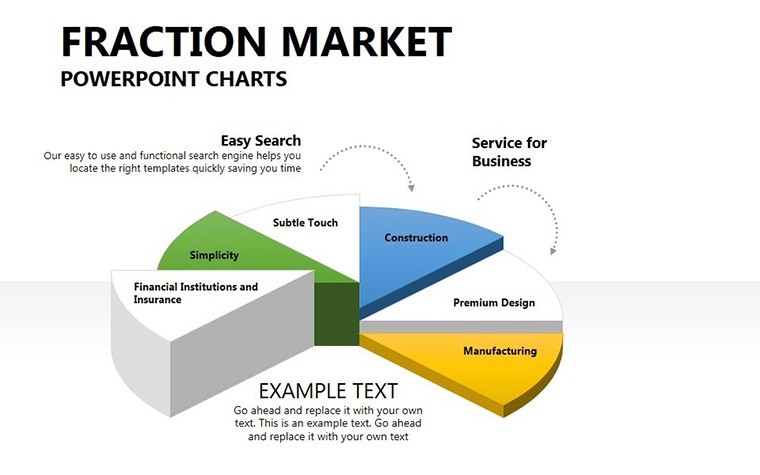
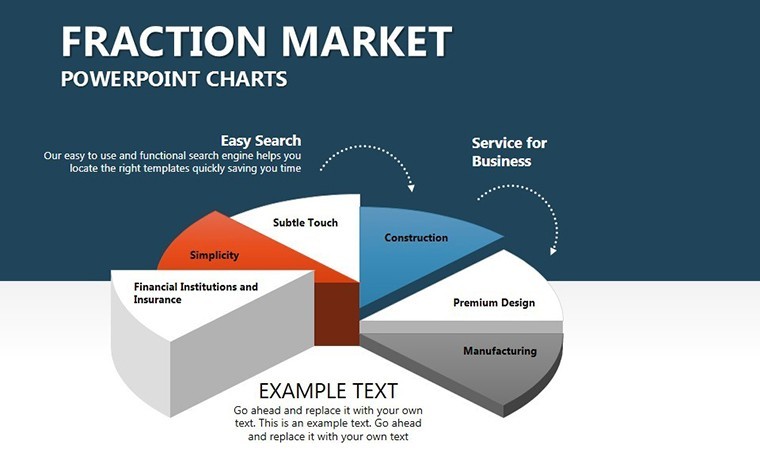
In the competitive arena of modern business, understanding your company's position relative to rivals is crucial, and nothing illustrates this better than a well-designed hierarchical chart. Our Hierarchical Needs Keynote chart template steps in as your go-to solution, offering 13 editable slides that map out market dynamics with precision and flair. Tailored for analysts, marketers, and executives who need to convey sales percentages and categorical volumes without overwhelming their audience, this template turns abstract numbers into hierarchical pyramids that tell a story of ascent or areas for improvement.
Picture this: You're preparing for a quarterly review, and instead of dry tables, you unveil a pyramid chart showing your brand's dominance in key segments. Compatible with Keynote and adaptable to PowerPoint or Google Slides, it supports quantitative measures like market share visuals, making it indispensable for strategic sessions. Drawing from established business intelligence practices, the template helps quantify hierarchies, revealing not just where you stand but how to climb higher - much like how leading firms use similar tools to forecast sales trajectories and adjust tactics accordingly.
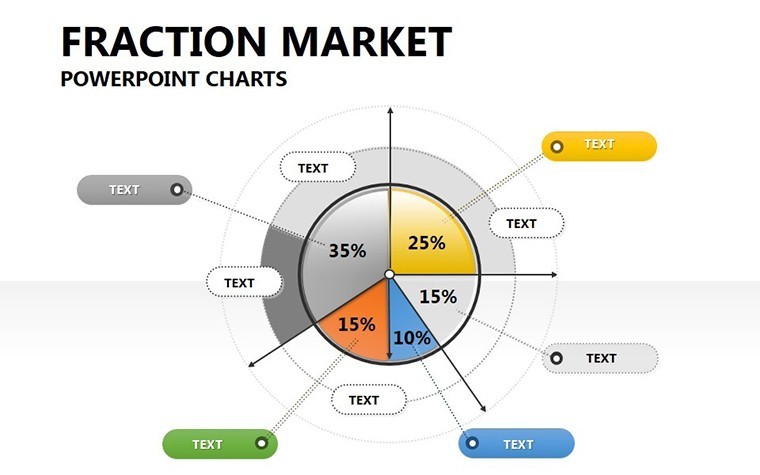
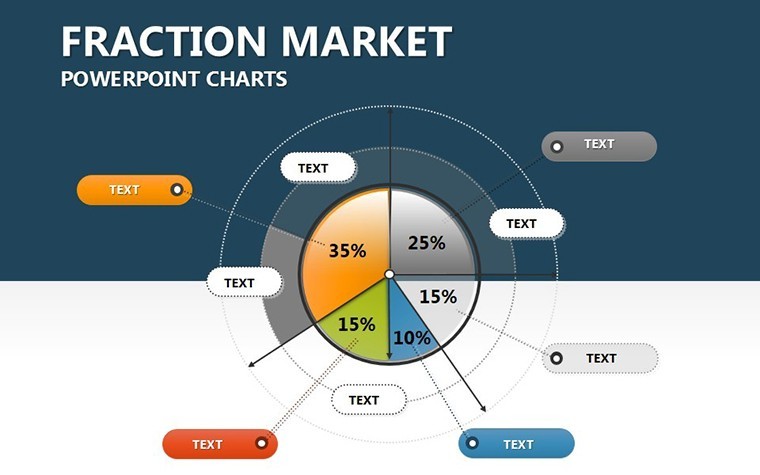
The beauty lies in its simplicity for complex data. Each slide builds on the last, from basic pie integrations to illustrative hierarchies that highlight interdependencies between market fields. In a real-world example, a retail chain leveraged this template to dissect consumer needs layers, identifying untapped opportunities that boosted their seasonal sales by 15%. This isn't mere visualization; it's a roadmap to informed decision-making, empowering you to advise stakeholders with confidence.
Unlocking the Features of Hierarchical Needs Charts
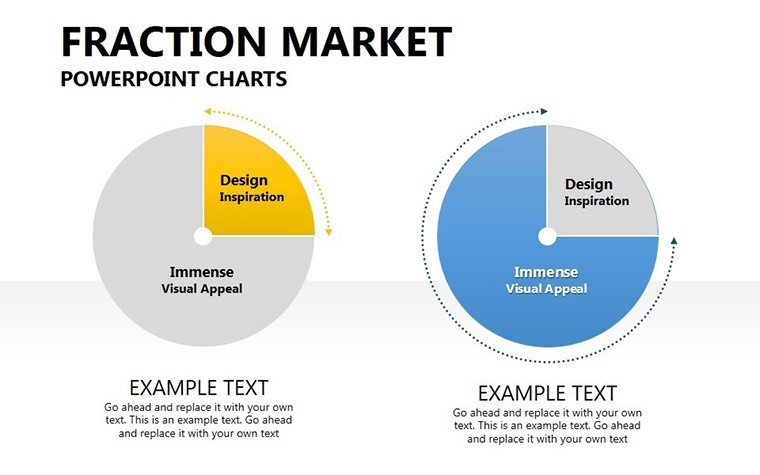
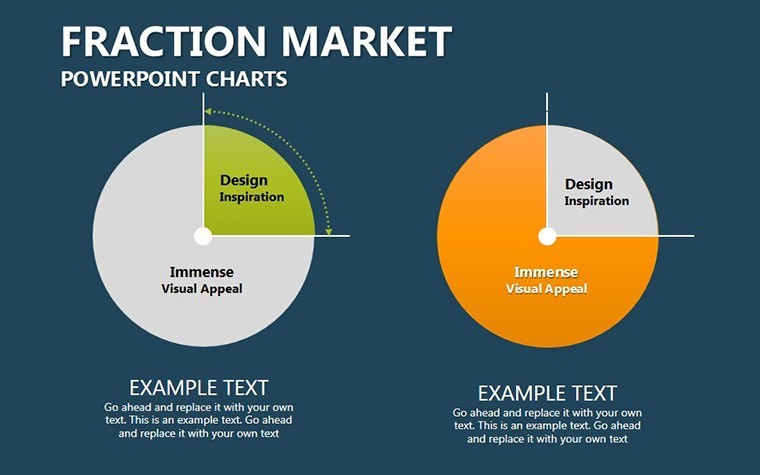
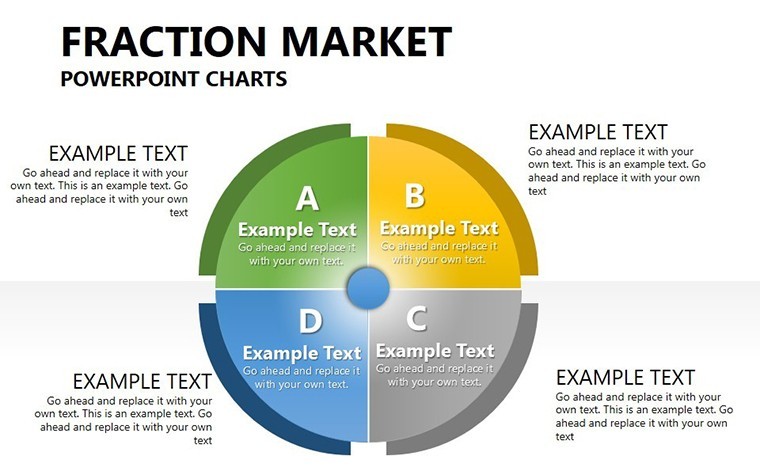
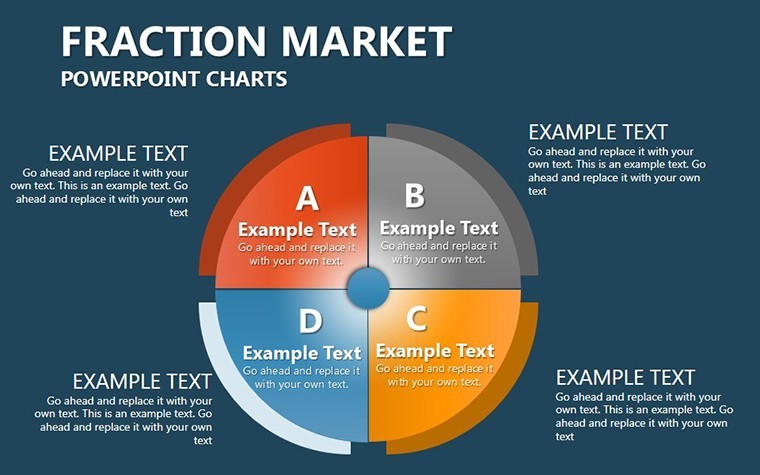
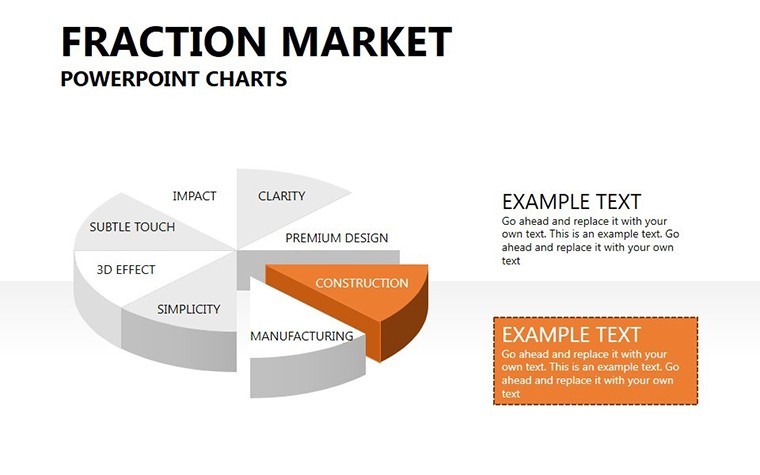
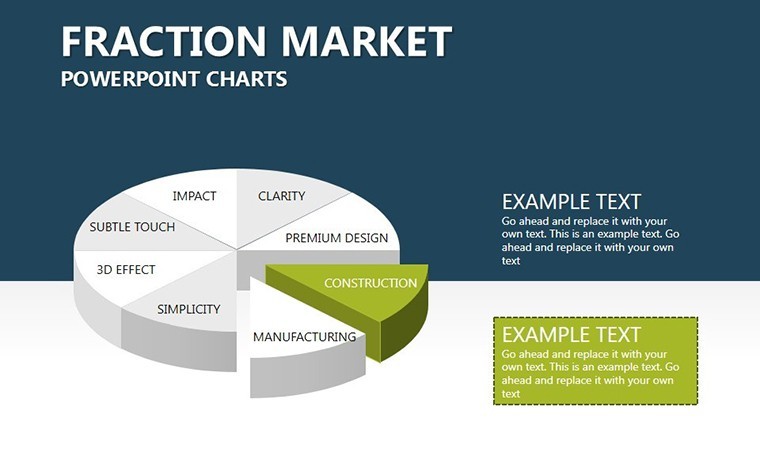
At the core of this template are features that blend ease with sophistication. With 13 slides focused on pie charts and illustrations, it's designed for users who value clarity in representing simple yet impactful data. The hierarchical structures allow for easy measurement of sales figures against competitors, using color-coded layers to denote volume and position.
- Pyramid and Layered Layouts: Intuitive designs that stack data hierarchically, ideal for showing progression from base needs to peak performance metrics.
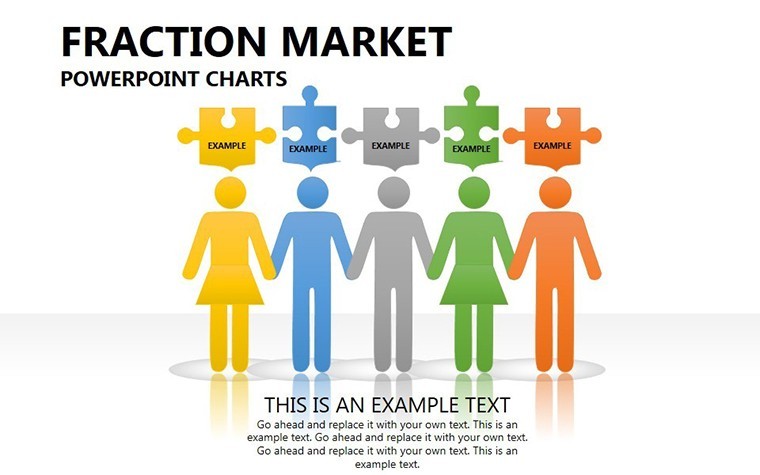
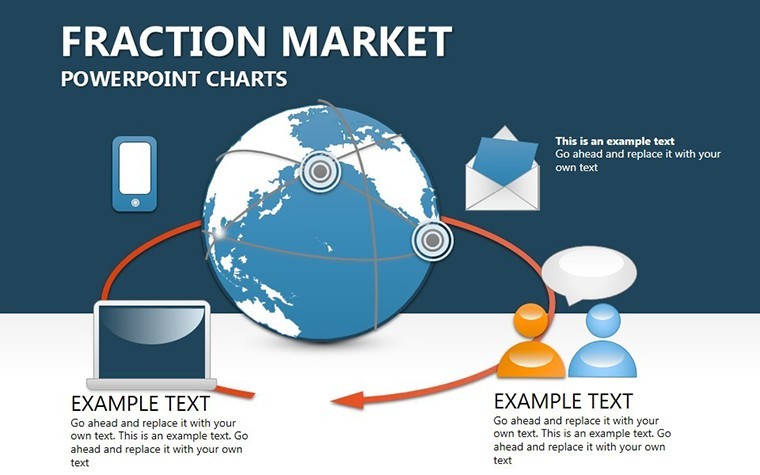
- Integrated Illustrations: Custom icons that enhance readability, ensuring your charts stand out in reports or live demos without distracting from the message.
- Seamless Editing Tools: Keynote's robust features let you swap data points effortlessly, with auto-adjusting proportions for accurate pie representations.
- Cross-Platform Versatility: Export options preserve hierarchy integrity when moving to Google Slides, maintaining professional polish across tools.
These elements are crafted with user experience in mind, reducing the time spent on formatting so you can focus on analysis. For instance, financial advisors have praised the template's ability to illustrate client portfolio hierarchies, providing a visual edge in client meetings that generic software can't match.
Practical Applications in Business and Beyond
This template shines in scenarios demanding clear data relationships, such as market positioning reports where sales volumes dictate strategy. In education, professors use it to teach economic hierarchies, breaking down Maslow-inspired consumer models into digestible slides that engage students. For entrepreneurs, it's a pitch essential, layering product features against market needs to secure funding.
Consider a step-by-step workflow for a marketing campaign analysis: Begin with a base slide outlining core market segments via pies. Layer on competitive standings in subsequent hierarchies, using illustrations to denote strengths. Conclude with advisory insights, perhaps animating the pyramid build to reveal growth potential. This approach not only clarifies data but also fosters discussion, as seen in consulting firms where such visuals have accelerated client buy-in.
Why It Outperforms Standard Chart Makers
Basic tools often falter with hierarchical data, leading to misaligned layers or loss of detail upon resizing. Our template counters this with vector precision and built-in relational links between slides, ensuring consistency. Animations, like gradual layer reveals, add dynamism absent in plain PowerPoint charts, making your presentations more memorable and persuasive.
Pro Tips for Optimal Use
To maximize impact, source data from credible analytics platforms and update pies dynamically if possible. Pair hierarchies with LSI terms like 'market segmentation' in your narrative for richer context. Test on various screens to fine-tune illustration scales, and consider embedding hyperlinks to source documents for added trustworthiness. For collaborative teams, the Google Slides compatibility streamlines feedback loops, turning solo efforts into collective wins.
Don't let hierarchical data remain hidden in spreadsheets - bring it to life with this template. Download now and position your business at the top of the pyramid.
Frequently Asked Questions
What does 'Hierarchical Needs' refer to in this template?
It represents layered market or consumer positioning, using pyramid charts to show relationships between sales data and competitive standings.
Are the pie charts fully customizable?
Yes, all elements including proportions, colors, and labels are editable in Keynote for tailored visualizations.
Can this be used for non-market analysis?
Certainly, it's versatile for organizational structures, educational hierarchies, or personal goal mapping.
Does it support animations?
Built-in subtle animations for layer builds are included, enhancing presentation flow.
How does it integrate with other software?
Export to PowerPoint or Google Slides retains most features, with minor adjustments for advanced effects.
What's the slide count and format?
13 editable slides in .key format, optimized for widescreen.
Good for
- Project roadmaps and sprint plans
- Product launch timelines
- Quarterly or annual review decks
- Company history and milestone summaries
Licence
reviews
I don’t care much about presentation design but this template was easy enough to use. Just replaced the text and exported.
The slides with bar charts actually helped explain my report better. I kept most of the original layout.
Needed something last minute for a client call. The charts and arrows already matched so I didn’t waste time fixing stuff.
It’s okay for basic presentations. A few slides felt repetitive but still usable.
I used this for a finance presentation and the dark chart backgrounds looked pretty good during projection.
FAQ
Will it work in Google Slides?
Are fonts embedded?
Can I use this for client work?
What's the refund policy?
Do you update the template after purchase?
Similar templates
See all Keynote Charts →



All 13 slides