 Click to zoom
Connection Processes PowerPoint Diagrams
| Format | .pptx |
| Slides | 16 unique layouts |
| Aspect ratio | 16:9 |
| Compatibility | PowerPoint |
| Animated | No |
| Language | English |
| License | Commercial |
| File size | — |
| Version | v1.0 |
| Last updated | August 2022 |
What's inside
Systems don't operate in isolation; they pulse with connections that dictate flow and evolution. The Connection Processes PowerPoint Diagrams Template captures this intricacy across 16 editable slides, modeling how control passes between activities and objects shift states. Ideal for unveiling the dynamic underbelly of computational or operational processes, this tool turns opaque mechanisms into illuminated pathways, helping you simulate, analyze, and communicate with finesse.
For system designers tracing algorithm lifecycles or managers diagramming workflow handoffs, these visuals clarify the sequential and parallel threads that bind actions. PowerPoint 2016+ ready in .pot/.potx formats, it's a $15 essential that bridges theory and practice, ensuring your presentations reveal rather than conceal complexities.
Envision a slide where arrows weave through state boxes, color-shifting to denote transitions - your audience follows the narrative effortlessly, grasping how one decision cascades into outcomes. It's the visual equivalent of debugging in real-time, fostering deeper understanding without the jargon.
Navigating the Web of Process Connections
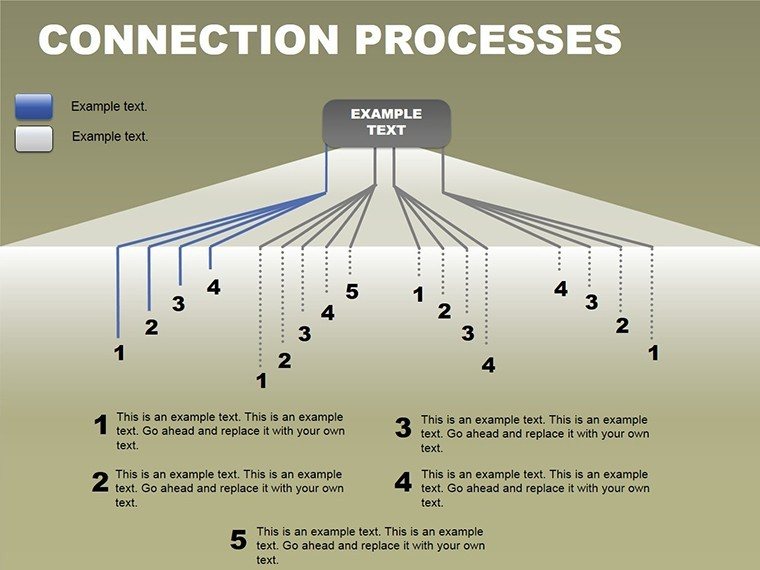
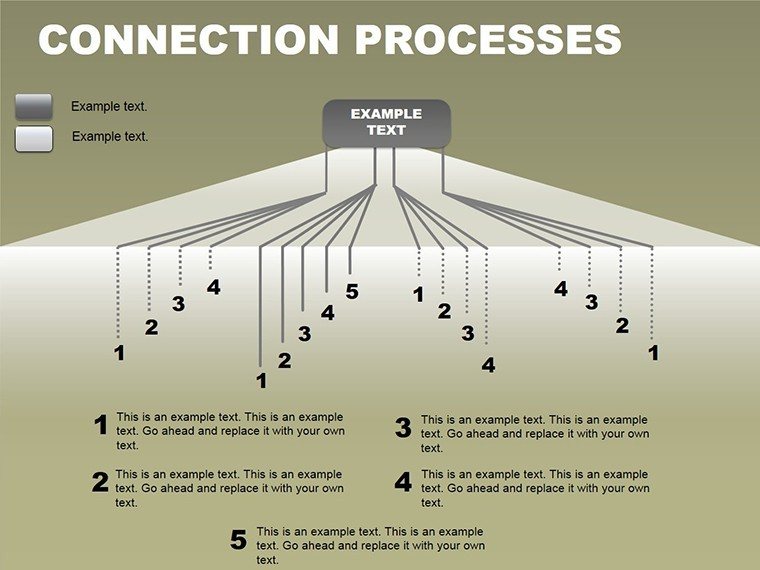
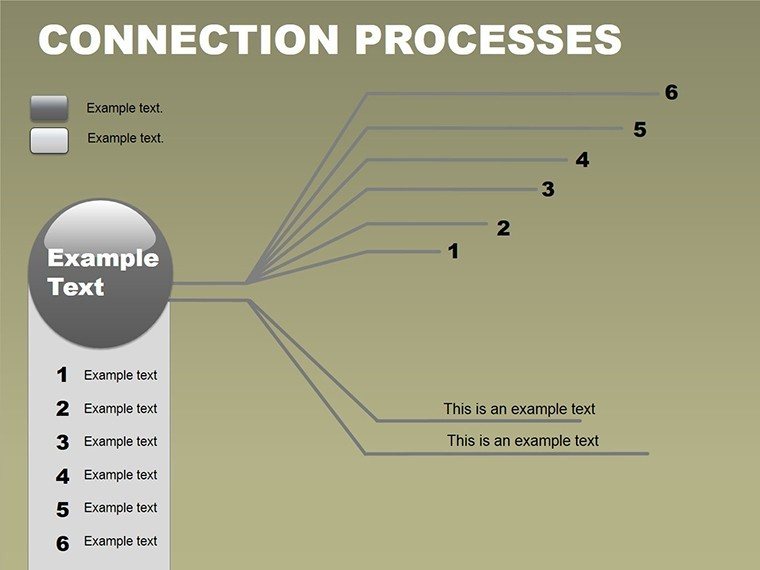
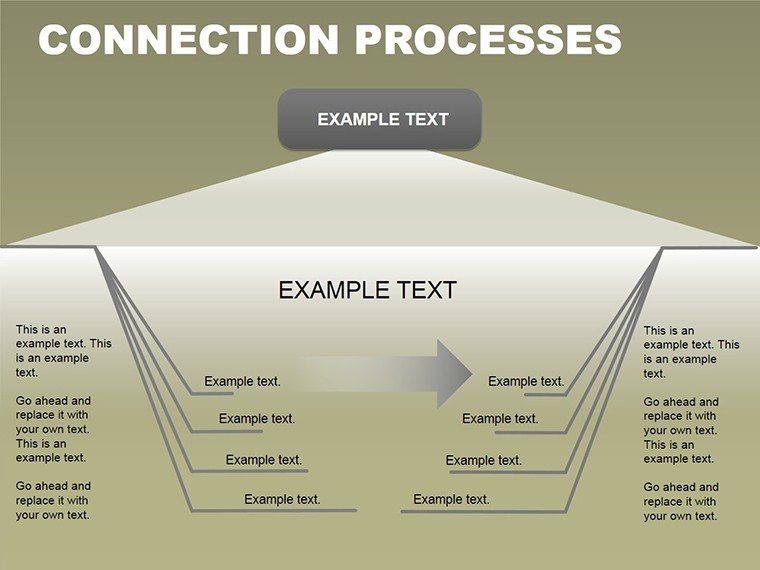
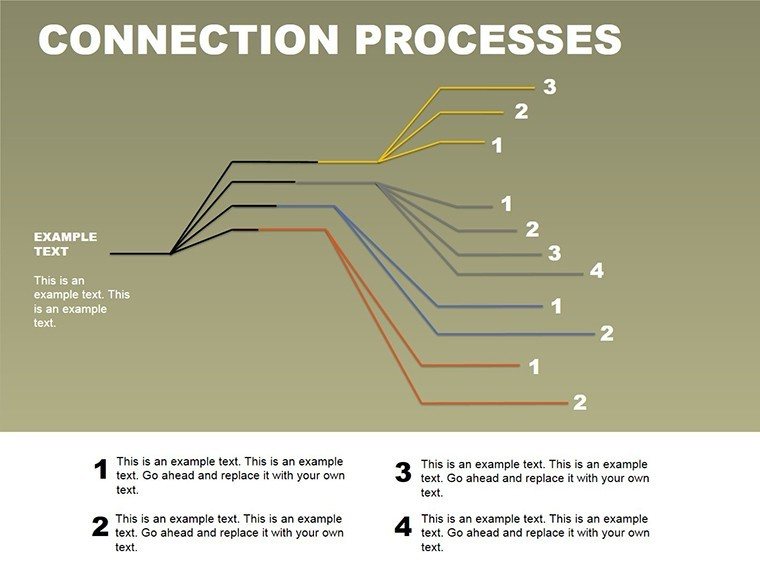
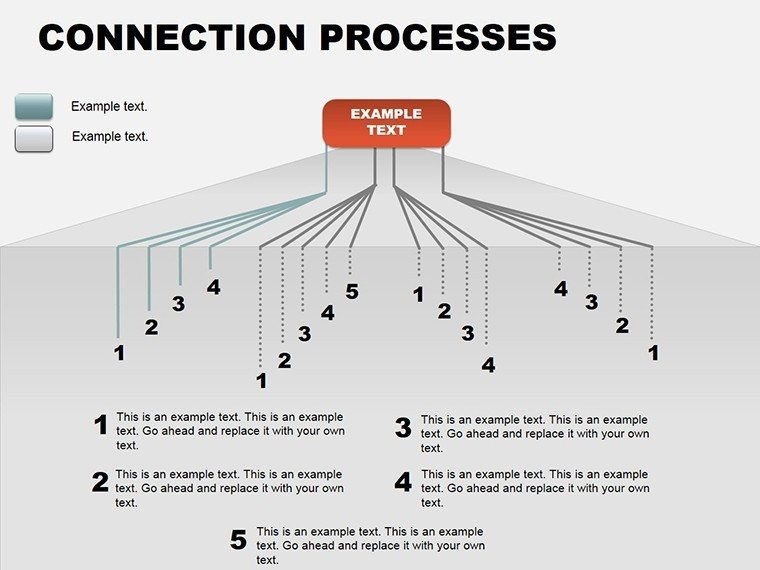
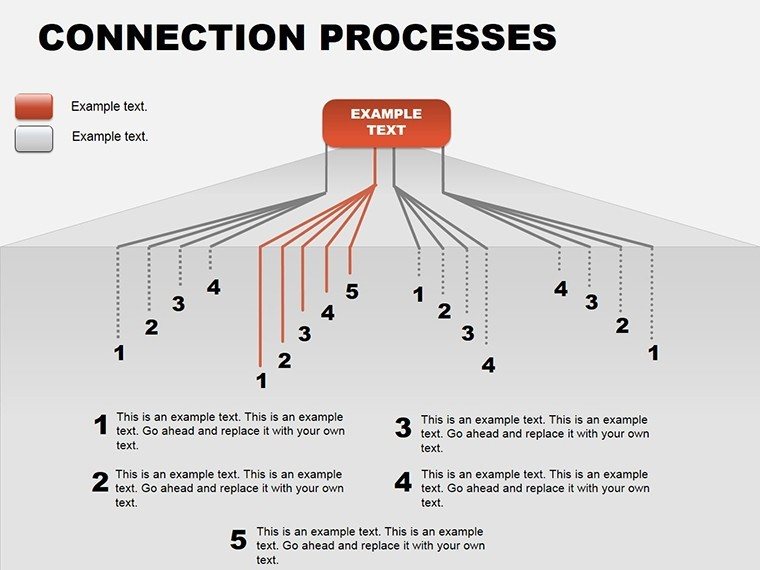
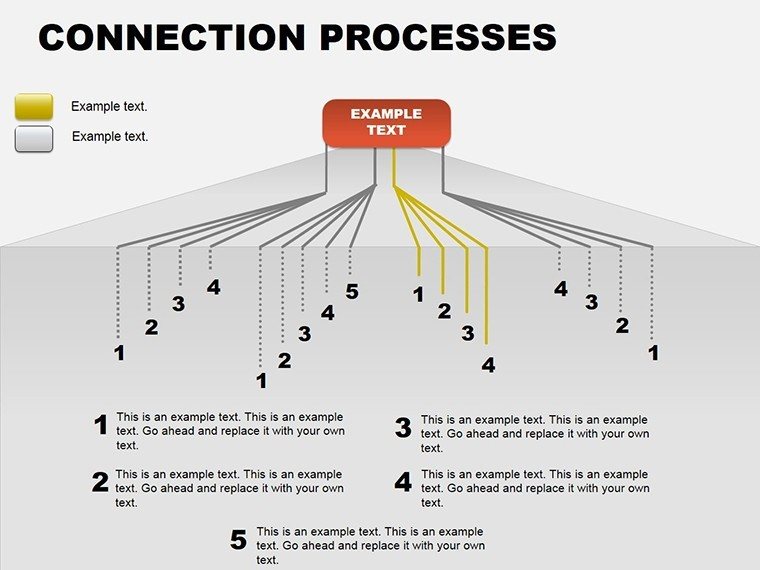
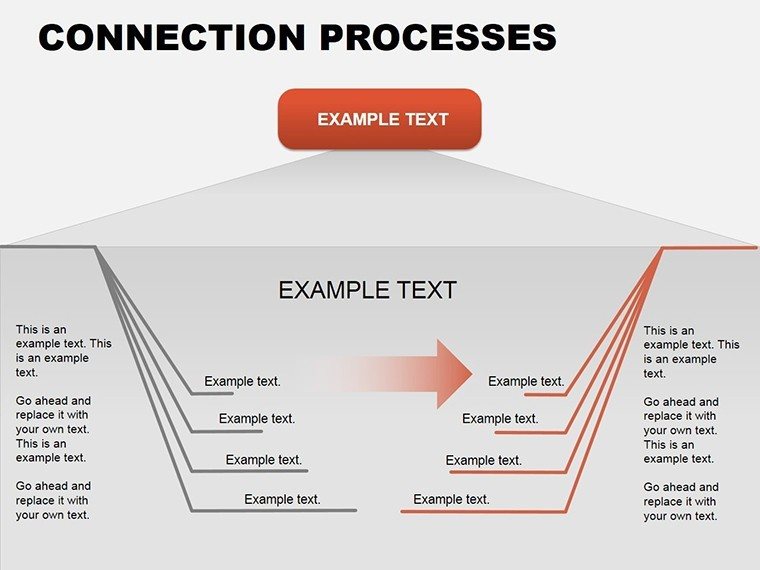
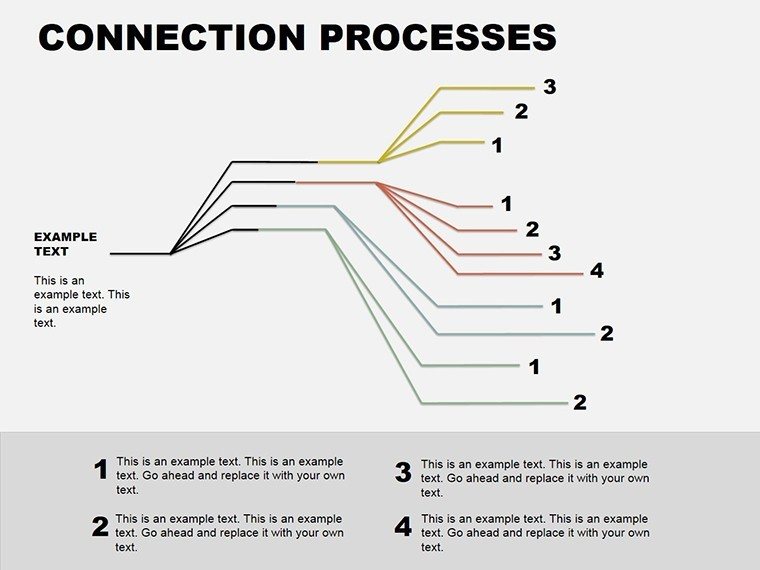
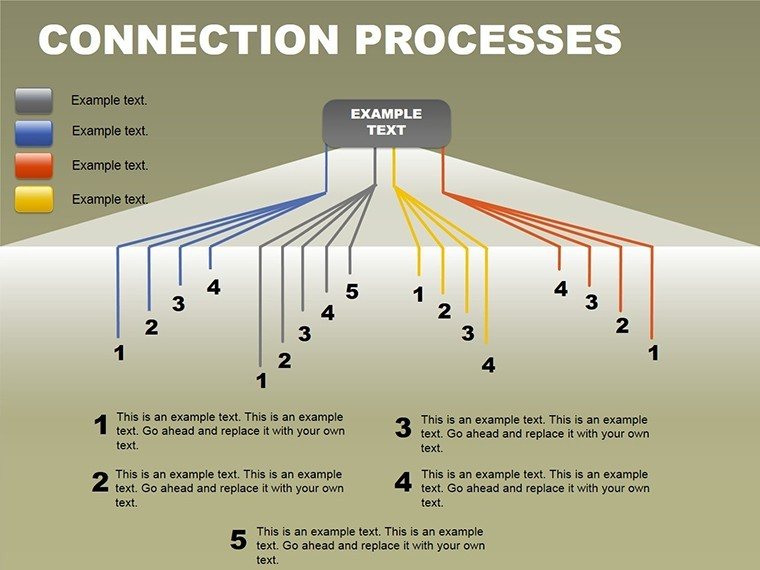
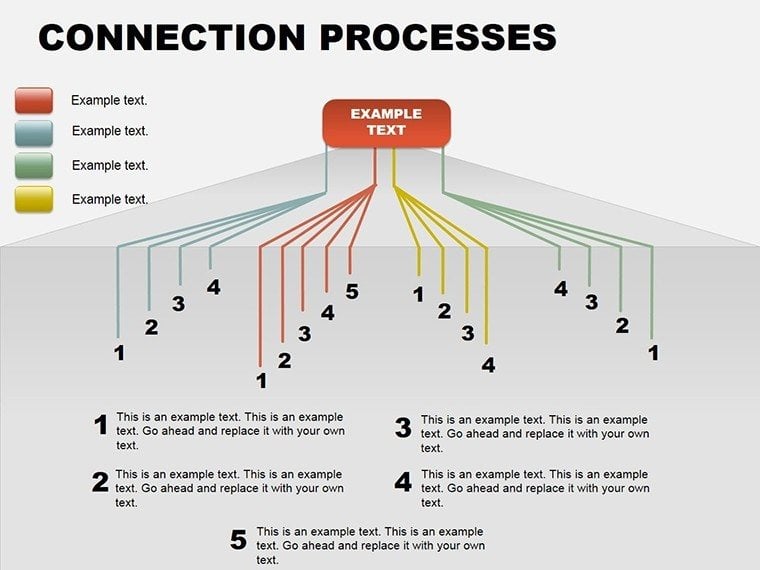
Spanning activity diagrams to state machines, the slides build a comprehensive toolkit. Early ones focus on linear connections: nodes linked by directed arrows, editable to label inputs/outputs like "user input triggers validation state." Parallel branches on slide 8 introduce forks and joins, simulating concurrent tasks with dashed lines for synchronization points.
Later slides delve into object lifecycles, circular processes showing state evolutions - idle to active to archived - with swimlanes for multi-entity views. Elements are grouped logically, with connector tools auto-snapping for precision. Neutral palettes allow thematic overlays, icons (e.g., gears for processes, flags for states) adding intuitive cues.
Building Your Process Model Methodically
- Define Scope: Outline key activities and states relevant to your system, sketching a rough map.
- Select Base Slide: Pick a linear or branched template matching your flow's complexity.
- Wire the Connections: Draw or edit arrows, assigning conditions like "if error, loop back."
- Layer States: Populate boxes with descriptions, using bold for entry/exit points.
- Simulate Runs: Animate paths to trace execution, pausing at decision nodes for emphasis.
This blueprint empowers precise modeling, turning abstract specs into actionable visuals.
Contexts Where Connections Click
Software architects employ these for UML-lite overviews: a connection diagram dissecting API calls, states reflecting response handling. In operations, a logistics firm visualized supply chain links, parallel paths for air/sea routes merging at distribution - streamlining bottleneck discussions. Educators in computer science labs used state transitions to demo finite automata, students replicating with custom inputs.
Business analysts map customer service flows, connections highlighting escalation triggers. Even in non-tech realms like healthcare, diagram patient journeys from intake to discharge, with conditional branches for complications. Sparingly, it echoes patterns from design pros like those in Grady Booch's object-oriented methods, but grounded in practical application.
- System Audits: Trace error propagations through connected nodes for root-cause reveals.
- Training Modules: Interactive versions let learners alter paths, exploring "what-if" scenarios.
- Proposal Visuals: Compact flows persuade stakeholders of streamlined efficiencies.
Such integrations demonstrate the template's utility in demystifying interconnected realities.
Outshining Simple Flowcharts
Basic flowcharts lack the state-aware depth here - these diagrams incorporate guards on transitions, adding conditional logic without extra tools. Modular components mean reusing connection clusters across slides, cutting redundancy. Files are lean, animations smooth via path-following effects that highlight active links.
Reliability shines: tested alignments prevent drift on resizes, alt texts like "Activity diagram with sequential connections from start to end state" ensure accessibility. For integration, embed Visio exports or link to BPMN tools for hybrid modeling.
Connect the dots in your next presentation - download the Connection Processes PowerPoint Diagrams Template for $15 and flow forward with clarity.
Frequently Asked Questions
How do these differ from standard flowcharts?
They emphasize state transitions and parallel paths, adding dynamic modeling beyond linear steps.
Can I add conditions to connections?
Yes, use text annotations or shape overlays to denote guards like [condition].
Are swimlanes included for roles?
Built-in on select slides, expandable to cover multiple actors.
What about exporting to other formats?
Save as PDF or image sequences for reports, retaining vector quality.
Is animation support robust?
Path animations trace connections sequentially, with triggers for branches.
Good for
- Project roadmaps and sprint plans
- Product launch timelines
- Quarterly or annual review decks
- Company history and milestone summaries
Licence
reviews
Some elements were slightly too large for my content.
Worked fine after small edits.
The circular diagram slides were useful for explaining team structure.
I didn’t really care about the design but it saved time.
FAQ
Will it work in Google Slides?
Are fonts embedded?
Can I use this for client work?
What's the refund policy?
Do you update the template after purchase?
Similar templates
See all Powerpoint Diagrams →
All 16 slides