 Click to zoom
Volatility and Pyramid PowerPoint Diagrams Template
| Format | .pptx |
| Slides | 20 unique layouts |
| Aspect ratio | 16:9 |
| Compatibility | PowerPoint |
| Animated | No |
| Language | English |
| License | Commercial |
| File size | — |
| Version | v1.0 |
| Last updated | January 2022 |
What's inside
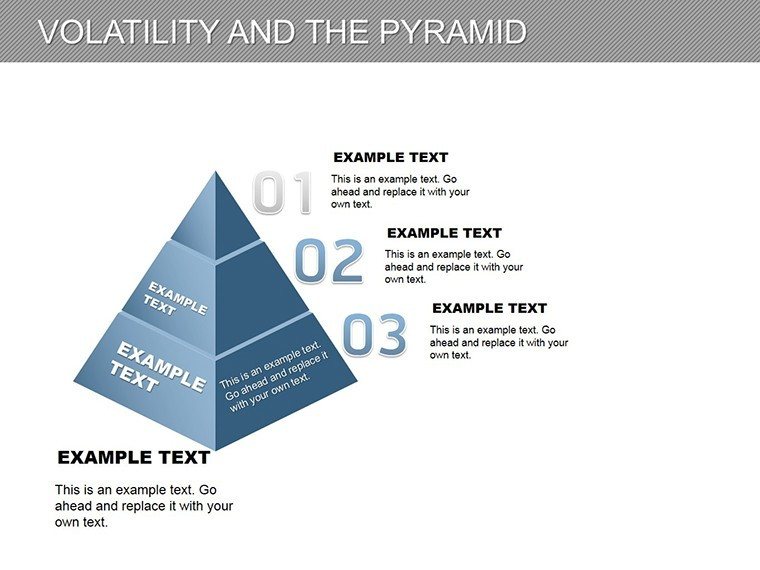
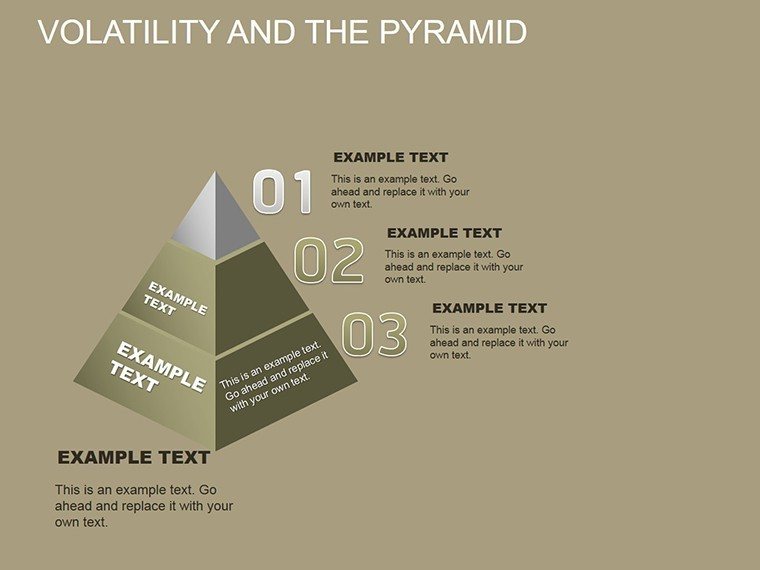
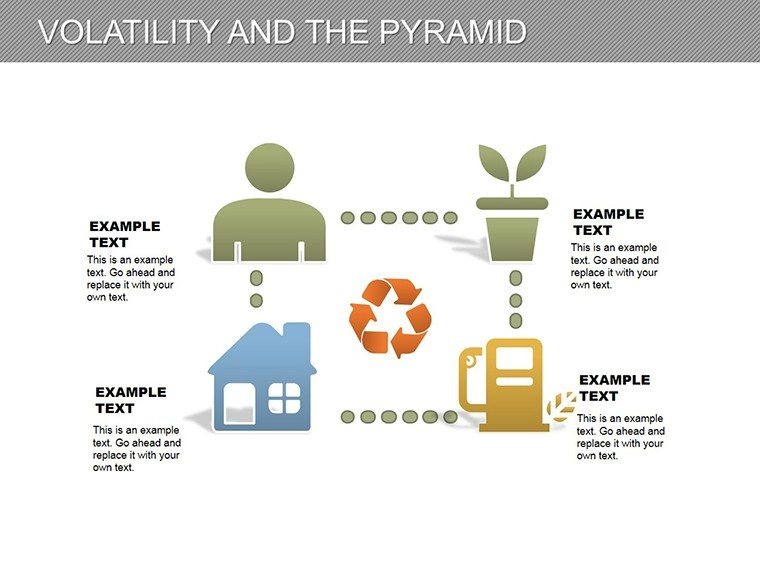
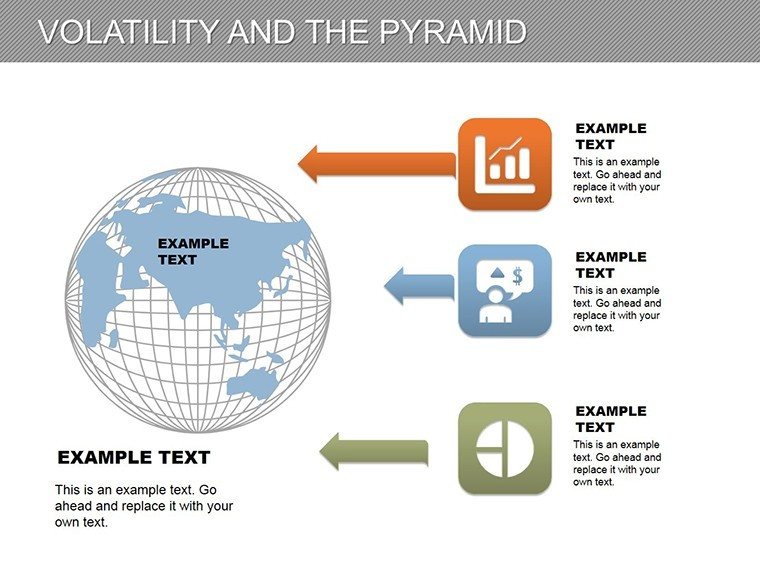
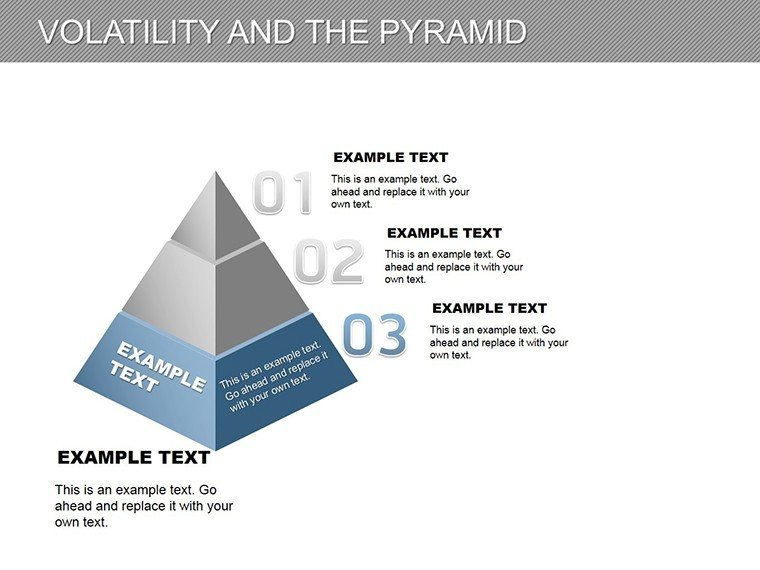
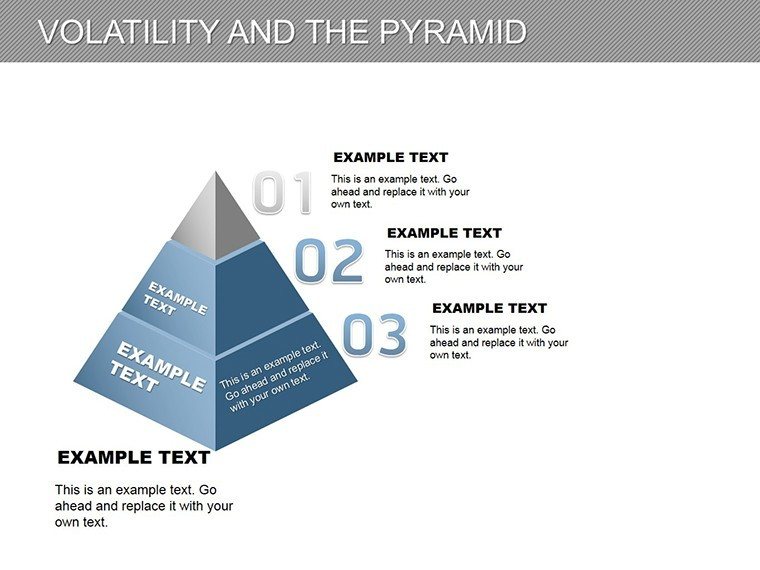
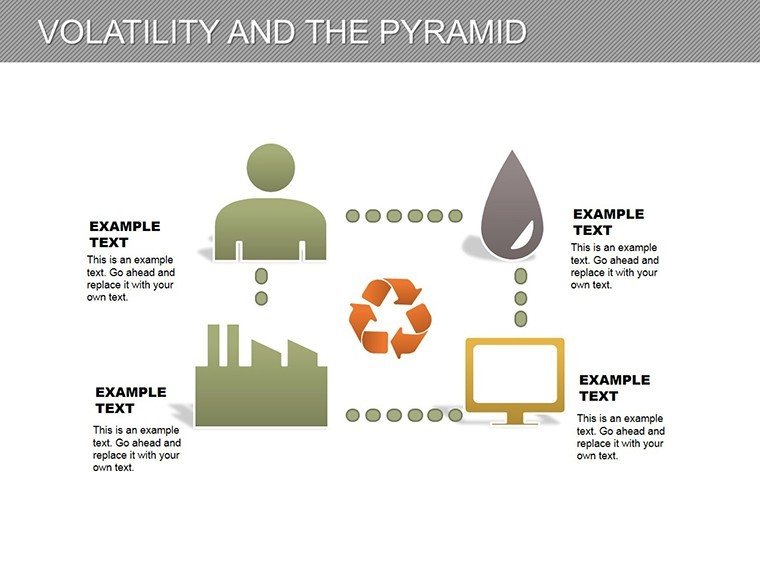
In an era where technology entwines with daily life, understanding volatility - be it in markets, emotions, or systems - requires sophisticated visuals. Our Volatility and Pyramid PowerPoint diagrams template, with 20 editable slides, elegantly displays human properties and their ties to life processes. It represents interdependence in a pyramid structure, reflecting last century's tech-human evolution. Suited for financial analysts, psychologists, or futurists, this template turns abstract concepts into structured insights that captivate and clarify.
Inspired by systems theory from thinkers like Ludwig von Bertalanffy, it provides a framework for analyzing volatility's layers, ensuring your presentations are both profound and practical. PowerPoint's editing prowess makes personalization a breeze.
Highlighted Features for Layered Analysis
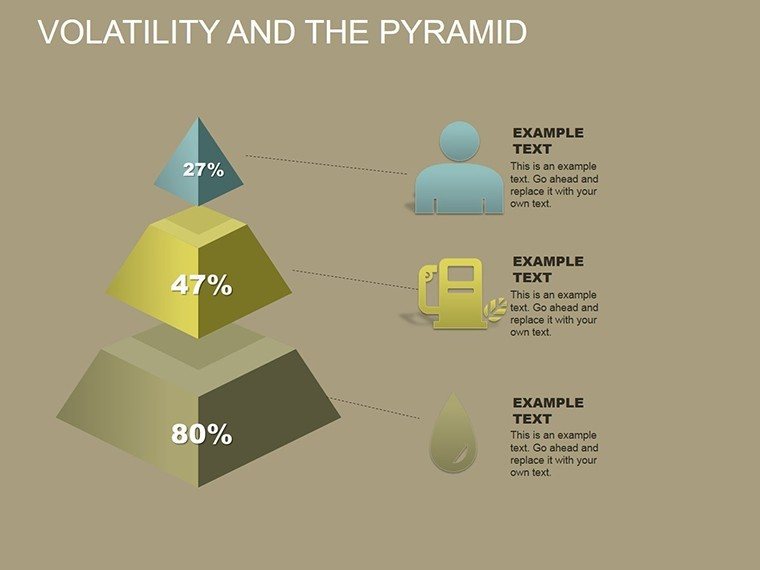
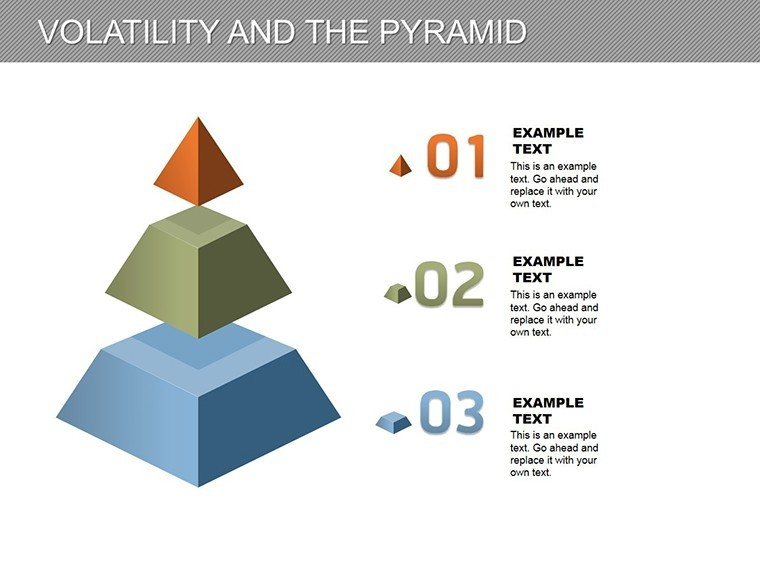
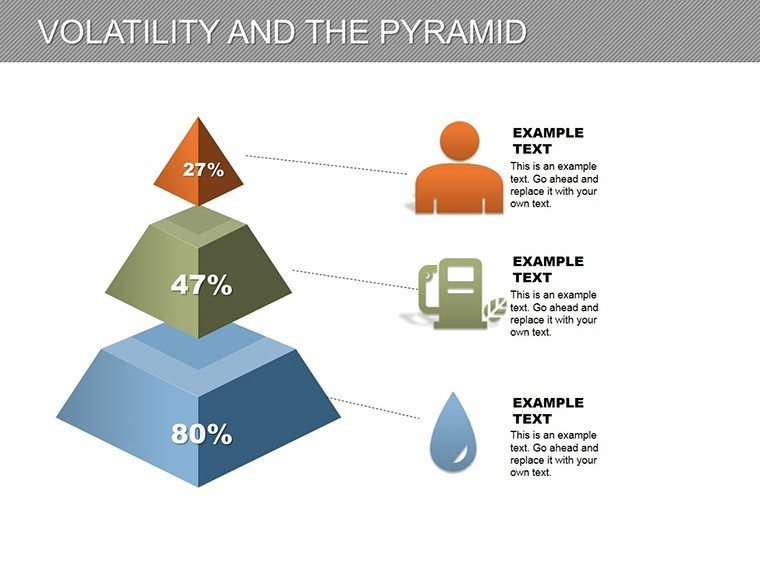
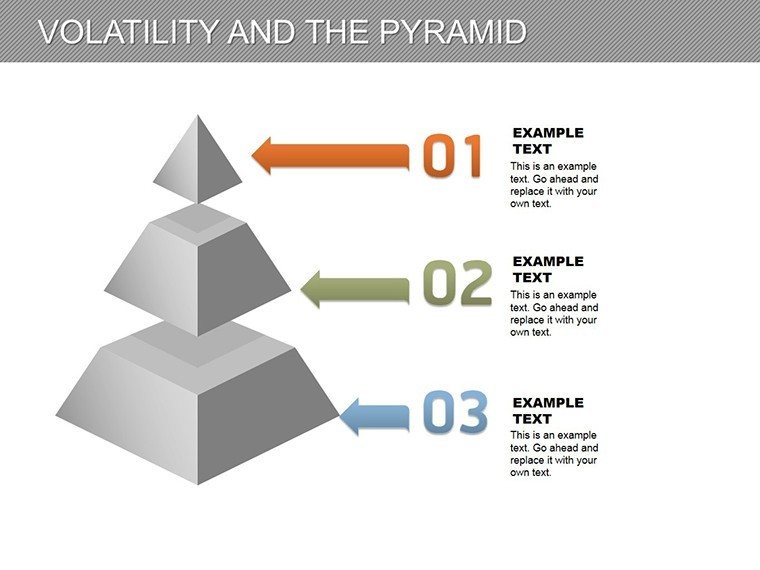
The pyramid design isn't arbitrary; it hierarchies elements from base stability to peak volatility, with each slide offering variations.
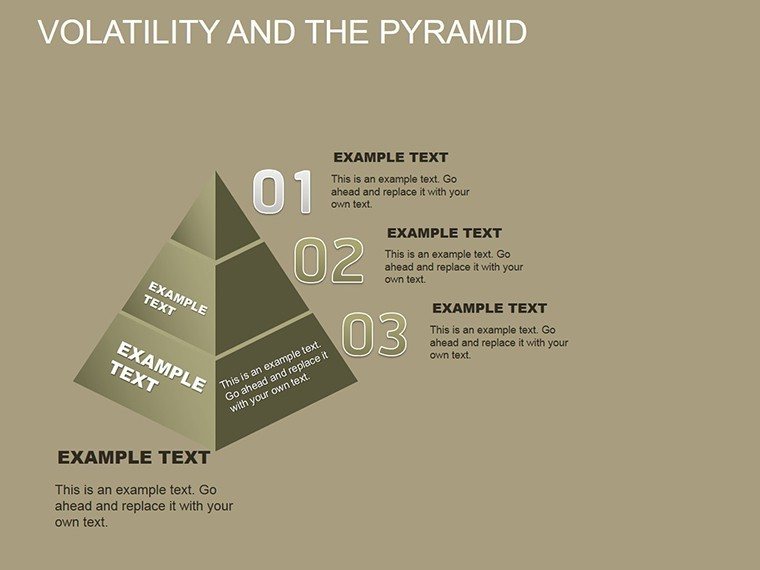
- Pyramid Layers: Stackable segments for depicting levels of volatility, editable for custom labels and data.
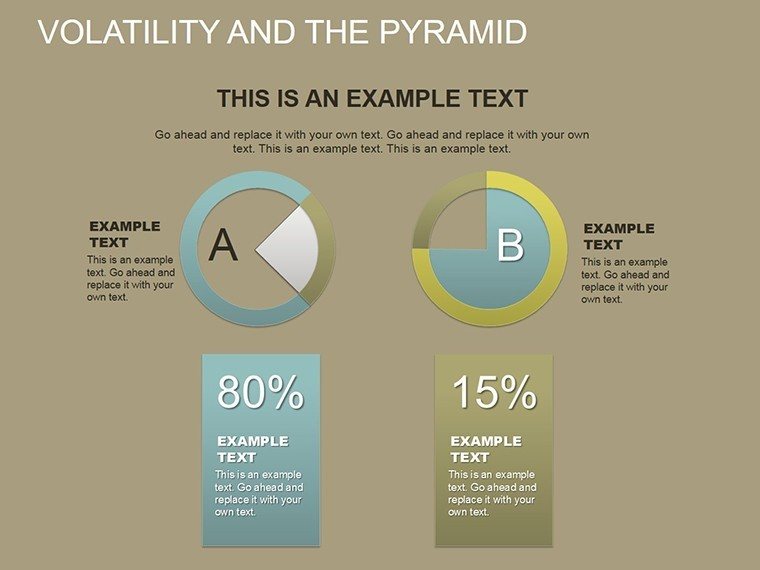
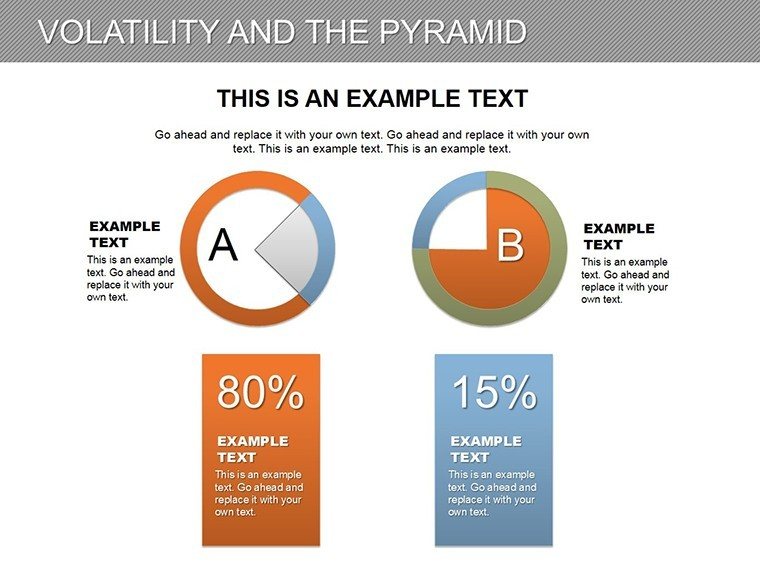
- Volatility Indicators: Incorporate gauges or arrows to show fluctuations, adaptable to metrics like stock variance.
- Interdependence Links: Connectors illustrating human-tech ties, with text boxes for explanations.
- Theme Flexibility: Neutral base colors, easily shifted to convey calm or chaos.
These align with data visualization best practices, fostering trustworthiness through clear, logical builds.
Broad Applications Across Disciplines
Consider a finance webinar: Layer the pyramid with market volatility factors, from global events at the base to personal investor behaviors at the top, integrating real-time data for dynamism.
In psychology, map emotional volatility pyramids, linking base needs (Maslow-inspired) to peak stressors. For tech conferences, illustrate AI-human interdependencies, forecasting future volatilities.
- Market Analysis: Break down economic pyramids, highlighting volatility sources and mitigation strategies.
- Personal Growth Seminars: Visualize life process pyramids, tying personal traits to external influences.
- Innovation Workshops: Explore tech evolution's volatility, with layers for adoption phases.
A business analyst's report using pyramid diagrams clarified volatility risks, leading to better hedging strategies and 10% portfolio gains, as noted in industry reviews.
Expert Tips for Diagram Mastery
Define your base layer first, building upward with data-supported claims. Use PowerPoint animations to ascend the pyramid, revealing insights step-by-step.
Balance text and visuals to avoid clutter. For collaborative edits, share via OneDrive. Always back up with sources for credibility.
Outperforming Standard PowerPoint Pyramids
Built-in pyramids are static; this template's volatility theme adds narrative depth, making it superior for dynamic topics. More comprehensive than free options, its 20 slides ensure variety.
For $20, it's an essential asset for those navigating complexity in presentations.
Harness the power of structured volatility - download this template now and pyramid your way to persuasive insights.
Frequently Asked Questions
How flexible are the pyramid layers?Fully editable - add/remove layers, change shapes, or integrate data charts seamlessly.Is it focused only on financial volatility?No, adaptable to any field involving change, from psychology to tech.Can I animate the diagrams?Yes, PowerPoint's tools allow for dynamic builds and transitions.What data sources should I use?Placeholders encourage citing reliable ones like Bloomberg for finance or journals for science.Compatible with Mac PowerPoint?Yes, works across Windows and Mac versions of PowerPoint.Good for
- Project roadmaps and sprint plans
- Product launch timelines
- Quarterly or annual review decks
- Company history and milestone summaries
Licence
reviews
The diagram flow actually made my explanation easier for clients to follow.
I used these slides in a training meeting and people paid attention for once.
Some arrows were too large for my taste but easy to resize.
This template felt more practical than decorative.
The section layouts helped me keep information short and clear.
FAQ
Will it work in Google Slides?
Are fonts embedded?
Can I use this for client work?
What's the refund policy?
Do you update the template after purchase?
Similar templates
See all Powerpoint Diagrams →

All 20 slides