 Click to zoom
3D Elements PowerPoint Charts Template for Immersive Data Displays
| Format | .pptx |
| Slides | 18 unique layouts |
| Aspect ratio | 16:9 |
| Compatibility | PowerPoint |
| Animated | No |
| Language | English |
| License | Commercial |
| File size | — |
| Version | v1.0 |
| Last updated | June 2024 |
What's inside
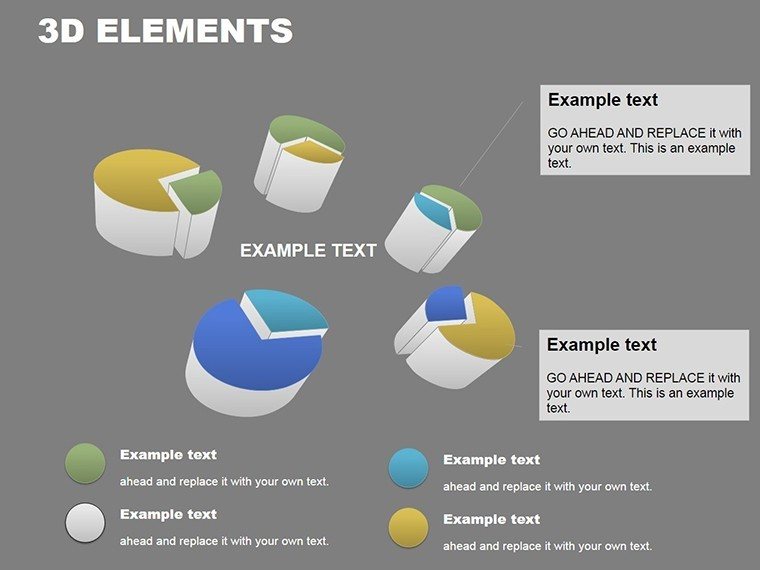
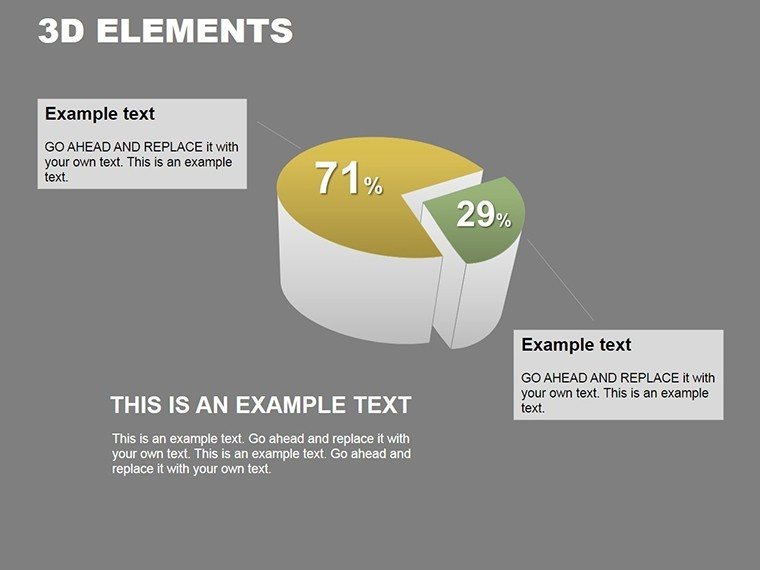
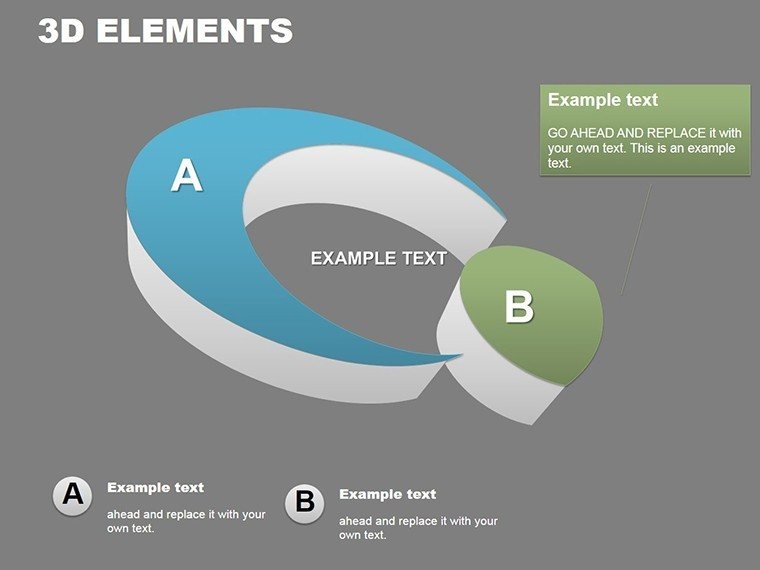
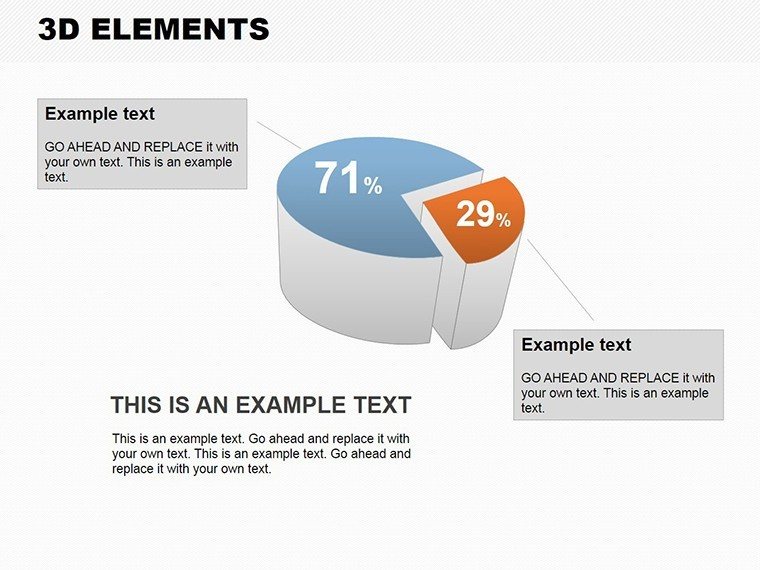
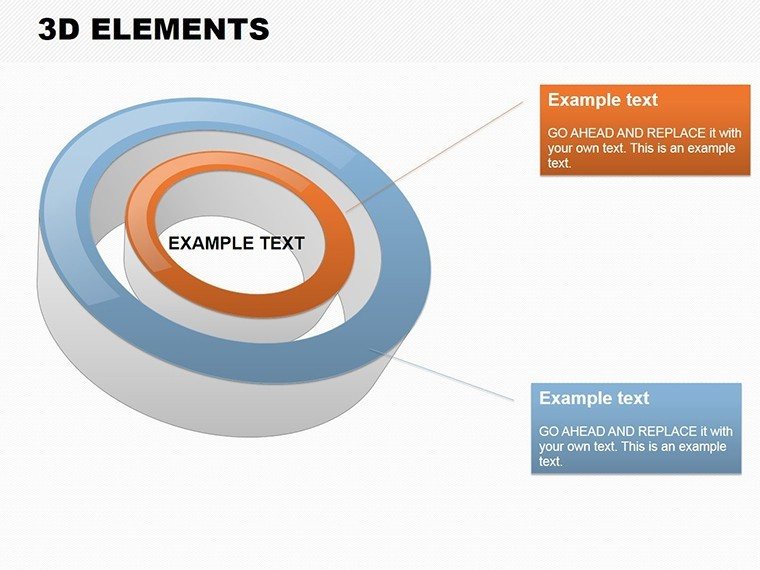
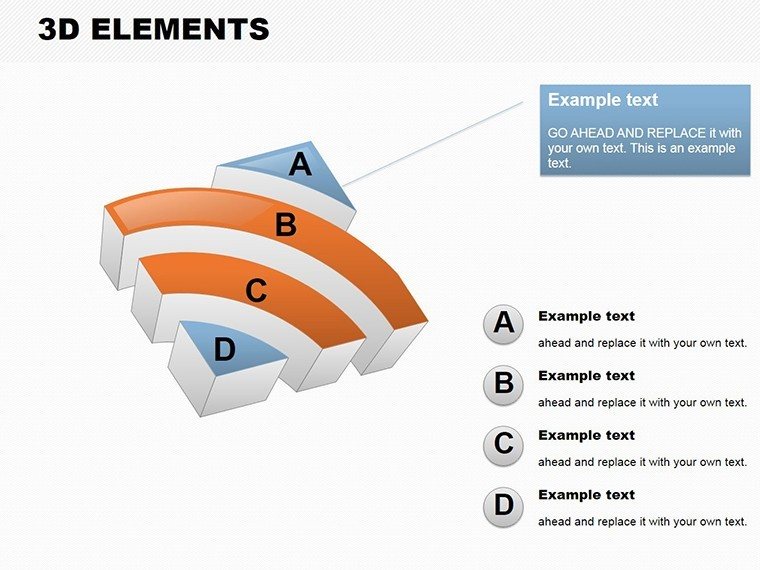
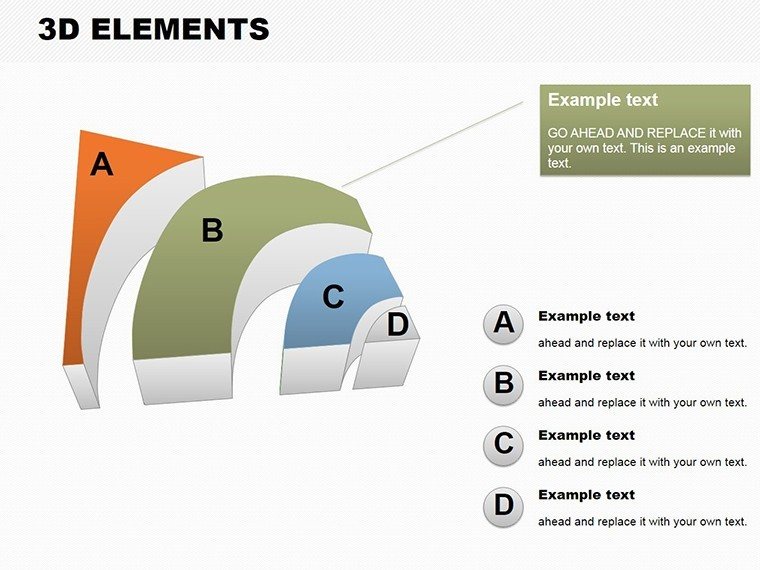
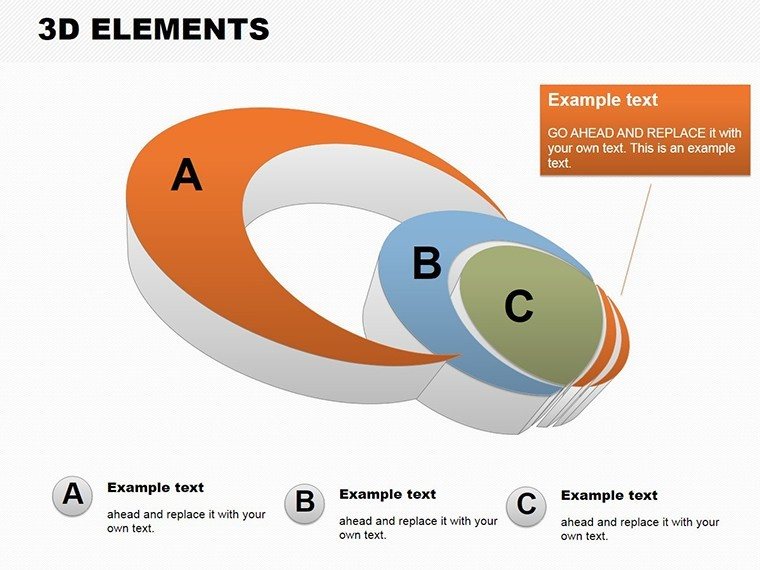
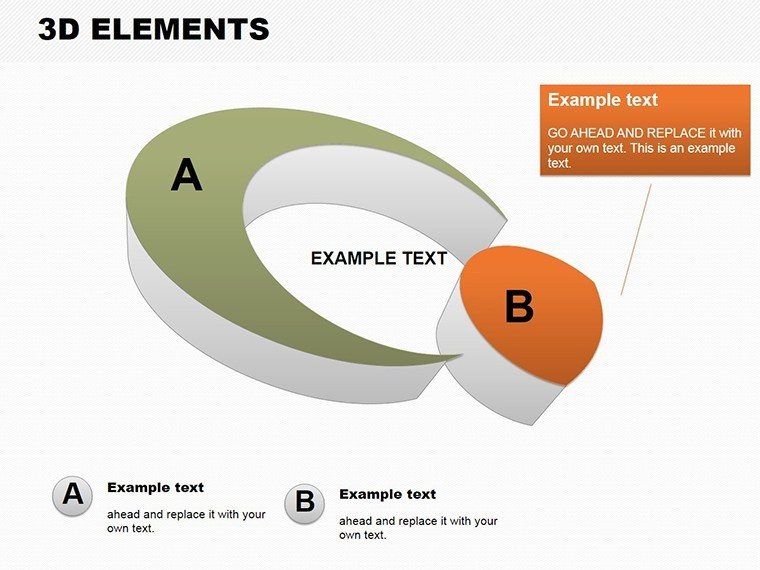
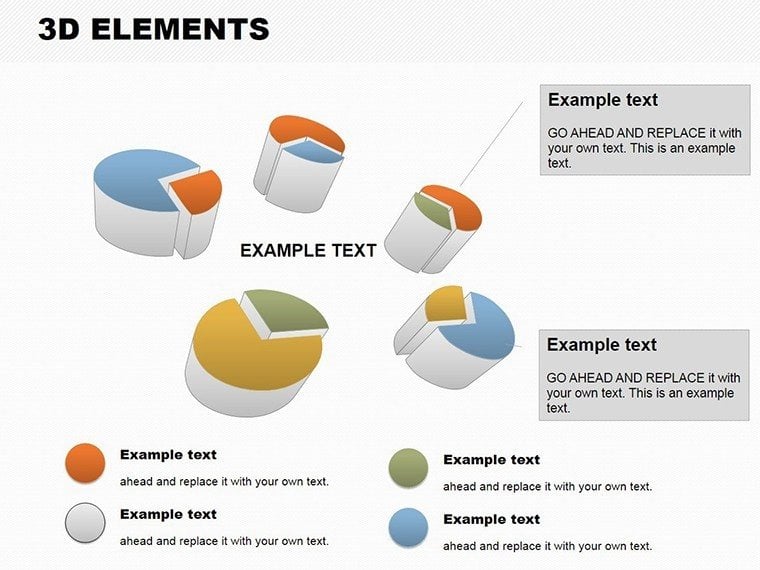
When data needs to leap off the screen, our 3D Elements PowerPoint charts template delivers with 18 editable slides that bring depth and dimension to your presentations. Crafted for users who demand more than flat graphics, this template excels in visualizing multi-layered information, from financial trends to scientific data. Envision a bar chart where sales figures tower realistically, or a pie chart that rotates to reveal hidden insights - perfect for finance analysts, educators, or marketers aiming to captivate. Fully compatible with PowerPoint and Google Slides, it features intuitive controls for resizing, recoloring, and animating elements, all while maintaining high fidelity. Inspired by advanced visualization techniques from sources like the Journal of Visual Communication, this tool not only enhances comprehension but also boosts retention, turning passive viewers into active participants in your data story.
Discover the Depth of 3D Features
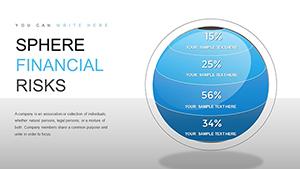
The template's 3D capabilities set it apart, offering shadows, perspectives, and extrusions that add realism to charts like scatter plots or area graphs. Each slide is optimized for performance, ensuring smooth transitions even on older hardware.
Effortless Customization Options
Adaptability is key: tweak angles for better viewpoint, integrate custom textures, or layer multiple charts for comparative analysis. In healthcare, for instance, use a 3D line graph to track patient recovery metrics over time, aligning with data standards from HIPAA-compliant reports.
Advantages That Elevate Your Presentations
Benefits include heightened engagement - research from Nielsen Norman Group indicates 3D visuals can increase viewer interest by 40%. It outperforms 2D alternatives by providing spatial context, ideal for complex datasets.
Beyond Basic Charts
Unlike default PowerPoint 3D, ours includes pre-animated rotations and interactive hotspots for deeper exploration.
Versatile Applications Across Fields
Business pros can illustrate market forecasts with towering bars; educators might depict ecological cycles in 3D for classroom impact, as in a biology lesson on food webs. A trainer's workshop on sales strategies could feature exploding pies to emphasize key segments, leading to better team uptake.
- Open in PowerPoint and select a base chart.
- Input data and apply 3D effects via simple sliders.
- Customize visuals with your palette.
- Add animations for narrative flow.
- Share or present with enhanced depth.
Seamless Tool Integration
Link to databases for real-time 3D renders or embed in e-learning platforms like Moodle for interactive modules.
Insider Tips for 3D Mastery
Avoid over-rotation to prevent disorientation; balance depth with clarity; reference design gurus like Bertin for perceptual accuracy. Test lighting effects for shadow realism in varied settings.
Dive into dimensional data - download this 3D charts template and redefine your visual storytelling today.
Frequently Asked Questions
Are the 3D elements fully adjustable?
Yes, adjust depth, rotation, and lighting for personalized visuals.
Does it work on Mac versions of PowerPoint?
Absolutely, compatible across Windows and Mac platforms.
Can I add my own data to the charts?
Yes, easy data input with automatic 3D rendering.
What chart types are supported in 3D?
Bar, pie, line, scatter, and area charts with 3D enhancements.
Is animation included for 3D effects?
Pre-built animations for rotations and reveals are ready to use.
Good for
- Project roadmaps and sprint plans
- Product launch timelines
- Quarterly or annual review decks
- Company history and milestone summaries
Licence
reviews
I downloaded it for an operations meeting and ended up using most of the charts.
The layout was straightforward and easy to edit quickly.
Not super modern looking but still practical.
Worked fine for showing project timelines and small data tables.
I had to adjust font sizes on several slides.
FAQ
Will it work in Google Slides?
Are fonts embedded?
Can I use this for client work?
What's the refund policy?
Do you update the template after purchase?
Similar templates
See all PowerPoint Charts →
All 18 slides