 Click to zoom
Sphere Financial Risks PowerPoint Charts Template - Master Risk Visualization
| Format | .pptx |
| Slides | 21 unique layouts |
| Aspect ratio | 16:9 |
| Compatibility | PowerPoint |
| Animated | No |
| Language | English |
| License | Commercial |
| File size | — |
| Version | v1.0 |
| Last updated | June 2024 |
What's inside
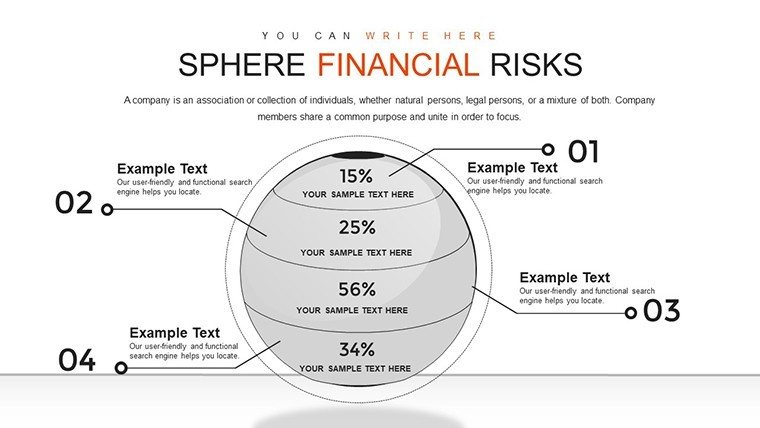
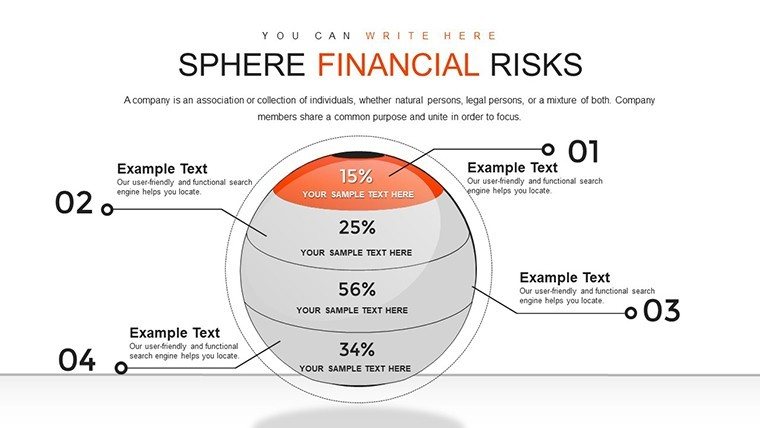
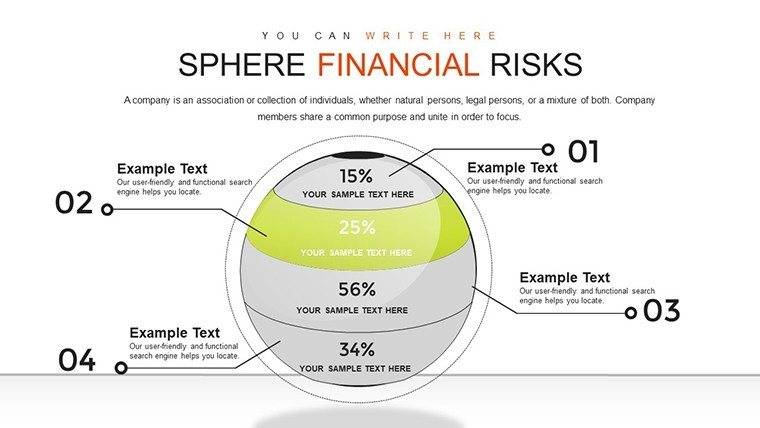
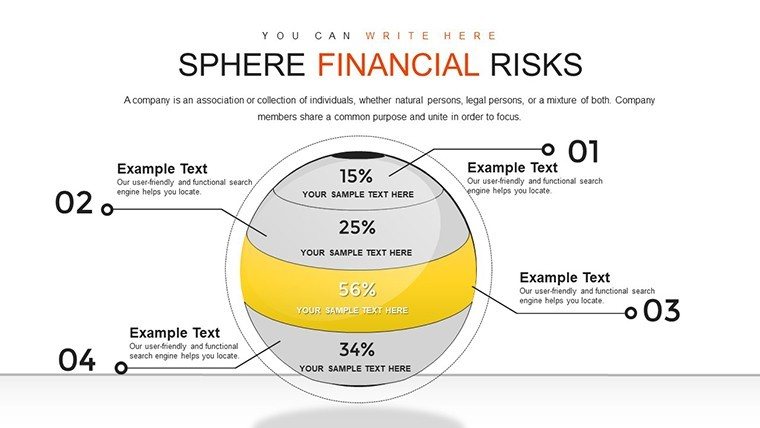
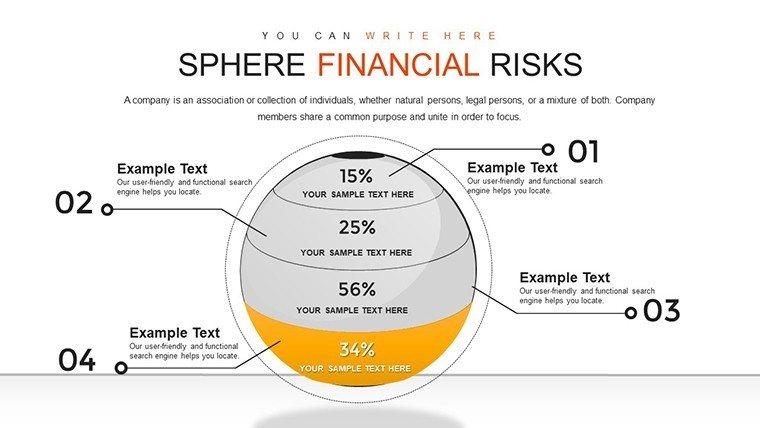
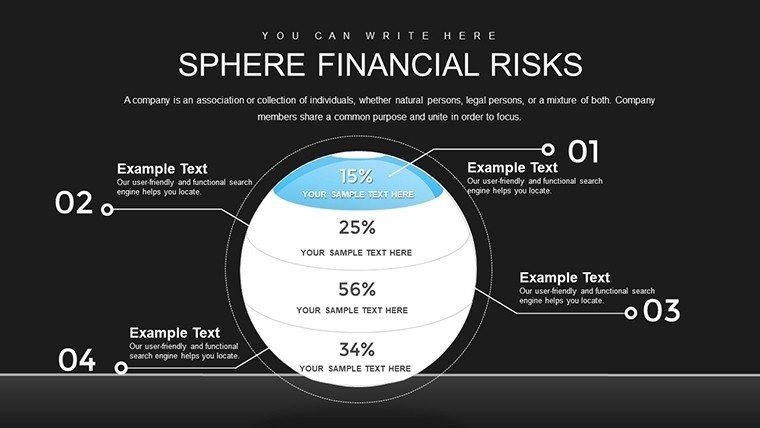
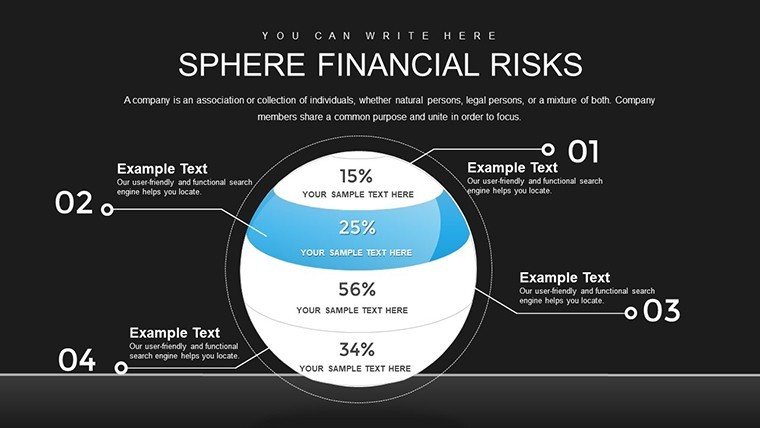
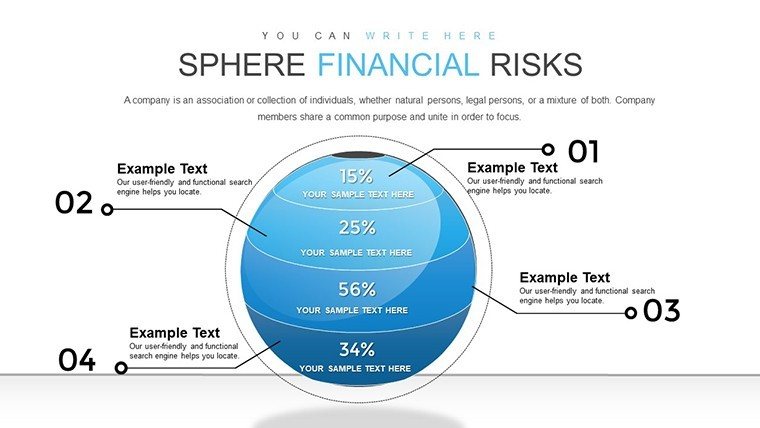
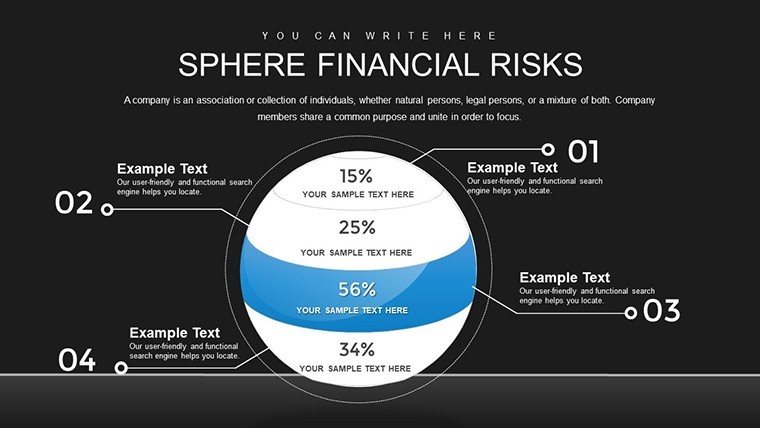
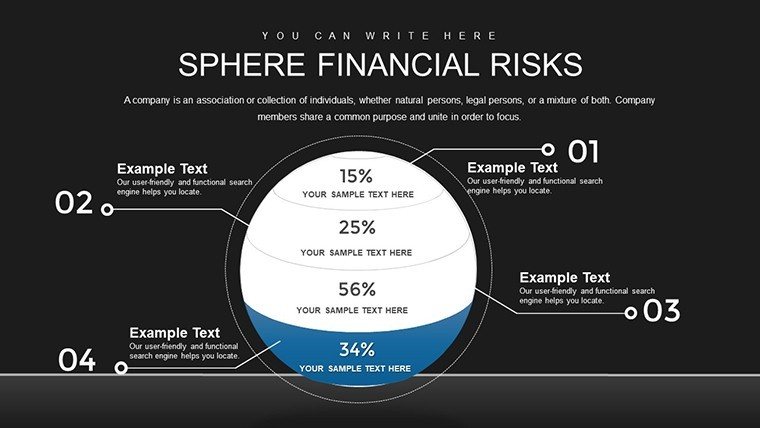
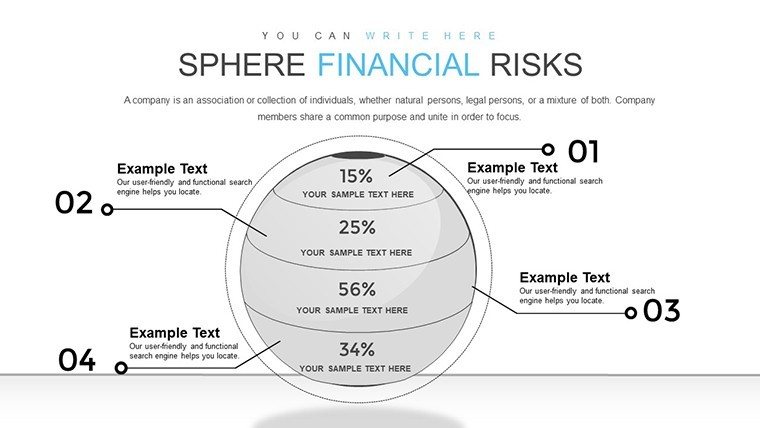
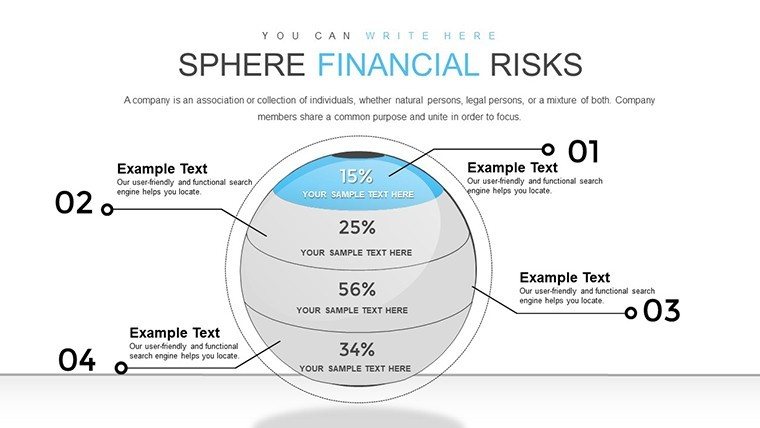
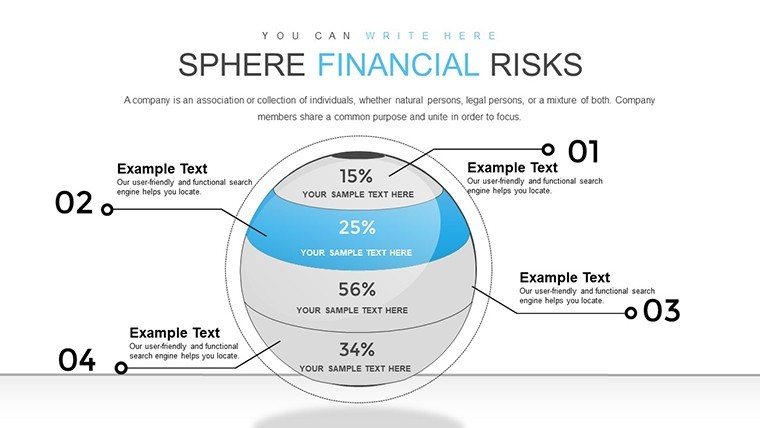
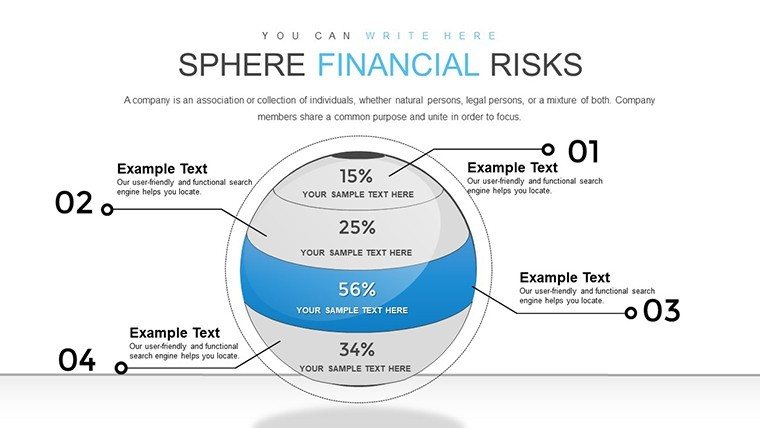
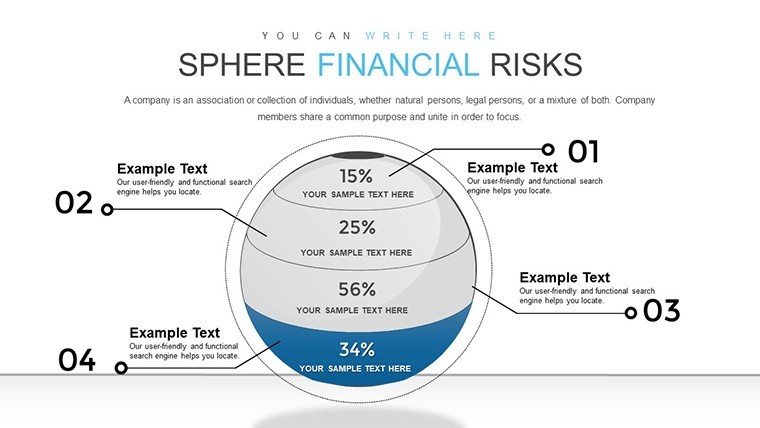
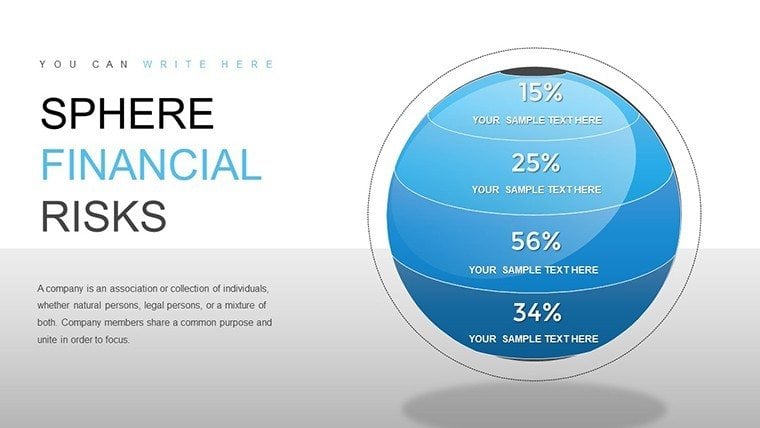
In the volatile world of finance, conveying risks effectively can make or break decisions. Our Sphere Financial Risks PowerPoint Charts Template steps in as your ally, offering 21 editable slides tailored for professionals like CFOs, risk analysts, and consultants. Visualize market volatility, credit exposures, and operational hazards through innovative sphere-based graphics that add a dynamic, three-dimensional feel to your data. This isn't just a template; it's a tool to transform abstract threats into tangible, actionable insights. Drawing from real-world applications, such as those in Deloitte's risk management reports, these charts help firms navigate uncertainties with confidence. Compatible with PowerPoint, it's easy to customize for board meetings or investor briefings, ensuring your message lands with impact and authority.
Delve into Sphere-Driven Risk Insights
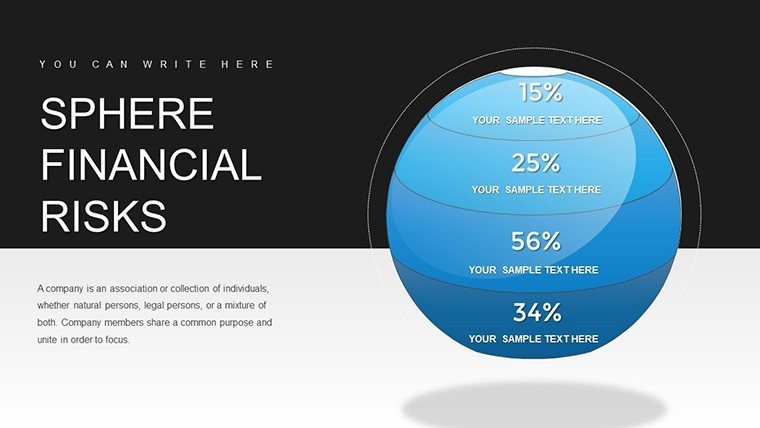
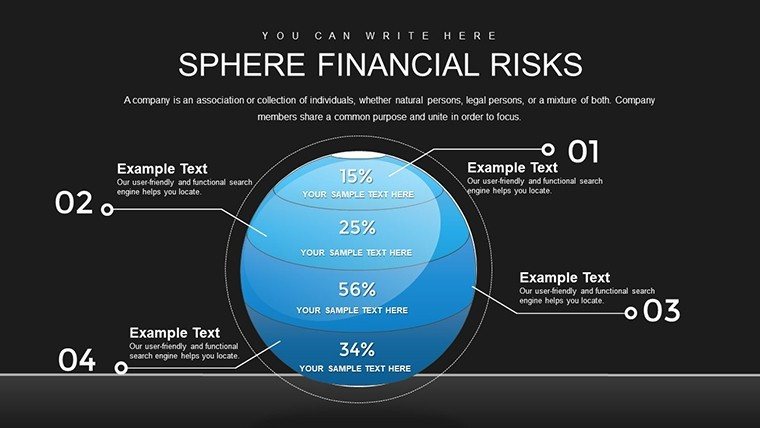
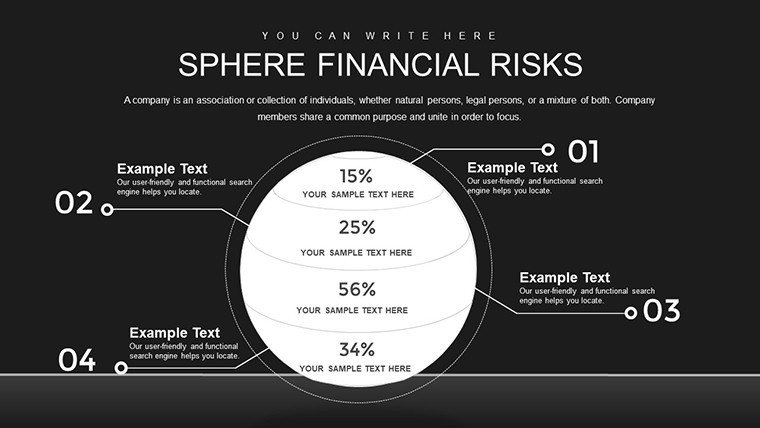
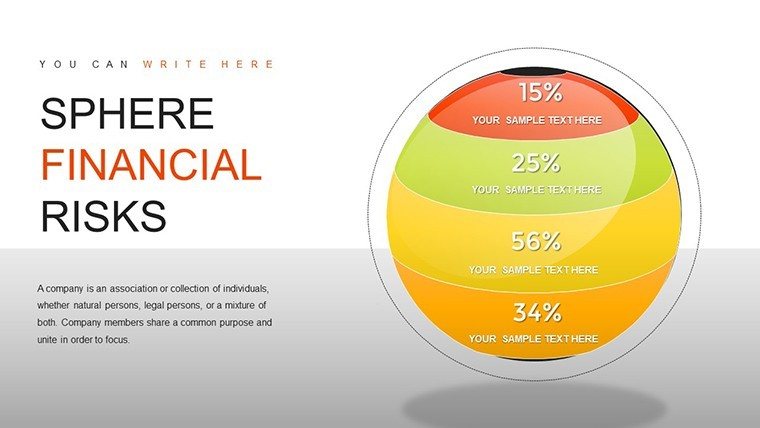
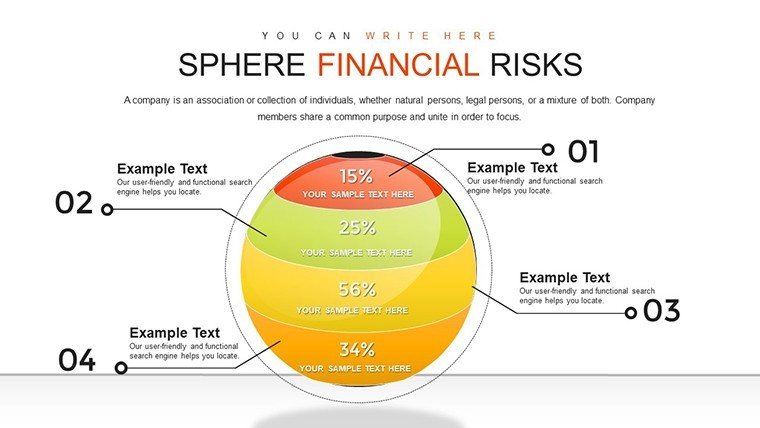
The spherical design isn't mere flair - it's a strategic choice for representing interconnected risks, much like how spheres symbolize wholeness in financial ecosystems. Each slide allows for deep customization, from altering color schemes to reflect risk severity (red for high, green for low) to resizing elements for emphasis. Consider a credit risk analysis: Use layered spheres to depict exposure levels, helping stakeholders grasp interconnections swiftly. This approach mirrors techniques used in award-winning financial reports, enhancing comprehension and fostering proactive strategies.
Standout Features for Financial Precision
- Spherical Chart Variations: Multi-layered spheres for hierarchical risk breakdowns, ideal for complex scenarios.
- Customization Flexibility: Edit fonts, layouts, and animations to suit your narrative style.
- Data-Ready Integration: Import from spreadsheets or risk software like RiskWatch for seamless updates.
- Engaging Visuals: Eye-catching animations that reveal data progressively, keeping audiences riveted.
- Professional Polish: Adheres to standards like those from CFA Institute for clear financial communication.
These elements combine to create presentations that not only inform but inspire action, backed by expertise in financial visualization.
Practical Scenarios for Risk Management
Apply this template in diverse settings. For investor presentations, showcase market risks with orbiting spheres illustrating volatility trends, drawing from cases like BlackRock's asset management pitches. In board meetings, use it to highlight operational risks, such as supply chain disruptions, promoting informed governance. Financial reports gain depth with interactive spheres comparing year-over-year risks, as seen in annual reports from Fortune 500 companies. A notable example: A banking executive used similar visuals to mitigate a potential crisis, averting losses per McKinsey insights on risk foresight.
Customization Workflow: From Concept to Delivery
- Open the template in PowerPoint and select a base slide.
- Input your risk data into the spherical charts.
- Adjust visuals for clarity, like scaling spheres by risk magnitude.
- Incorporate brand elements for cohesion.
- Add transitions and test for smooth playback.
- Share via email or cloud for feedback.
This process integrates with tools like Tableau for advanced data layering, streamlining your workflow.
Superior to Standard Charting Options
Basic PowerPoint lacks the thematic depth of our sphere designs, which provide a unique lens on risks. Benefits include heightened engagement - studies from Visual Capitalist show 3D-like visuals boost retention by 30% - and time efficiency. For trustworthiness, the template's structure supports compliance with regulations like Basel III, making it a staple for authoritative presentations. Link to our spheres category for more thematic variety.
Enhance UX with thumbnail previews in your deck, and alt texts like 'Sphere chart depicting market risk levels' for accessibility.
Expert Tips for Risk Presentation Excellence
- Layer data to avoid overload, revealing layers via clicks.
- Use contrasting colors for risk categories to aid quick scans.
- Incorporate narratives tying visuals to business outcomes.
- Practice delivery to synchronize animations with speech.
- Update with real-time data for ongoing relevance.
Drawn from seasoned analysts, these tips elevate your content to professional heights.
Secure Your Financial Edge Now
Empower your risk communications with this template - download and start mitigating threats visually. It's the step toward more resilient strategies.
Frequently Asked Questions
What types of risks can this template visualize?
It's versatile for market, credit, operational, and more, using spheres for interconnected views.
Is customization beginner-friendly?
Yes, with intuitive tools in PowerPoint - no advanced skills needed.
Does it support animations?
Absolutely, include dynamic reveals for engaging presentations.
What's the file format?
.pptx, compatible with recent PowerPoint versions.
Can I use it for educational purposes?
Sure, ideal for training on financial risks.
How do I import external data?
Copy from Excel or link directly for updates.
Good for
- Project roadmaps and sprint plans
- Product launch timelines
- Quarterly or annual review decks
- Company history and milestone summaries
Licence
reviews
Quick reaction: better than expected for the price.
Had to tweak quite a few things but end result satisfied me.
Bar graphs look sharp. Helped me in a tight deadline project.
The animations are smooth but I disabled most of them.
Neutral experience overall. Gets work done.
My team found the templates easy to collaborate on.
Slightly critical - fonts could use update but workable.
Downloaded for Keynote actually but PPT version worked.
FAQ
Will it work in Google Slides?
Are fonts embedded?
Can I use this for client work?
What's the refund policy?
Do you update the template after purchase?
Similar templates
See all PowerPoint Charts →
All 21 slides