 Click to zoom
Lobules Pie PowerPoint Charts Template: Segment Your Success
| Format | .pptx |
| Slides | 28 unique layouts |
| Aspect ratio | 16:9 |
| Compatibility | PowerPoint |
| Animated | No |
| Language | English |
| License | Commercial |
| File size | — |
| Version | v1.0 |
| Last updated | February 2026 |
What's inside
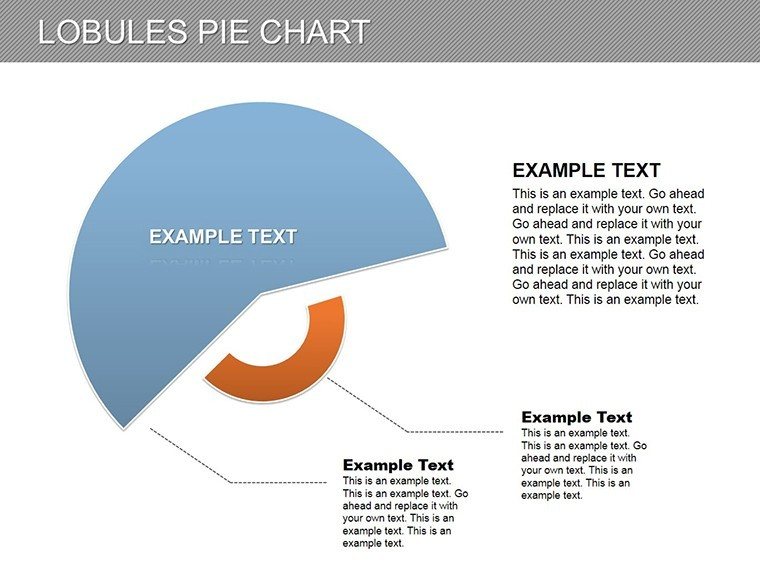
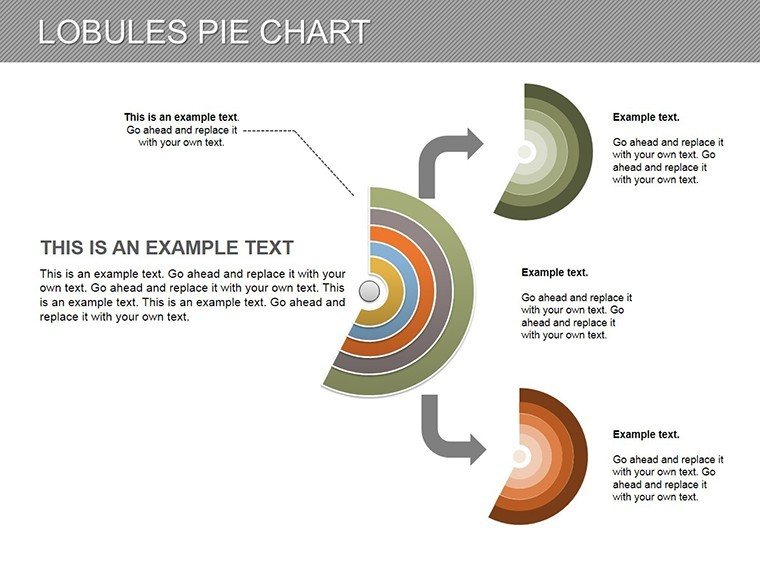
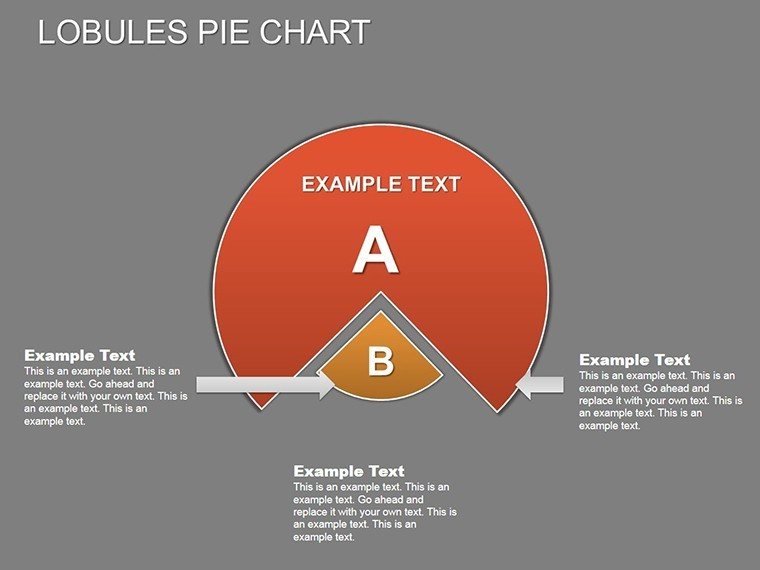
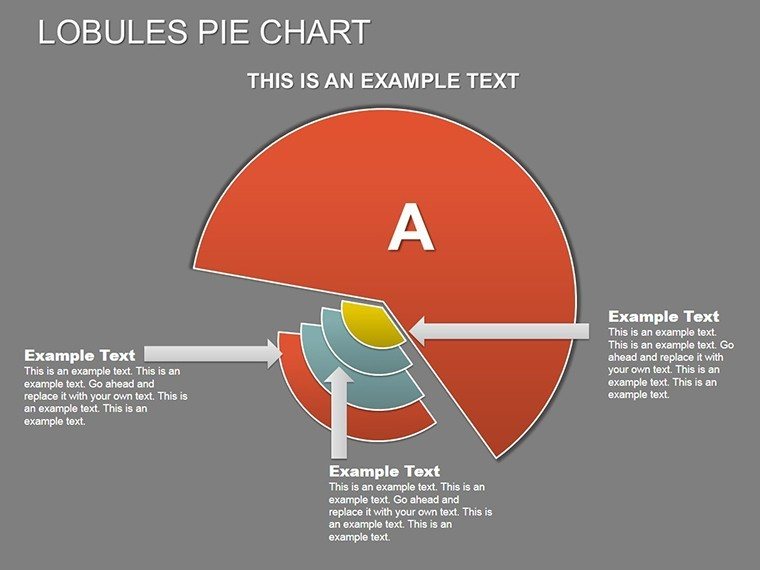
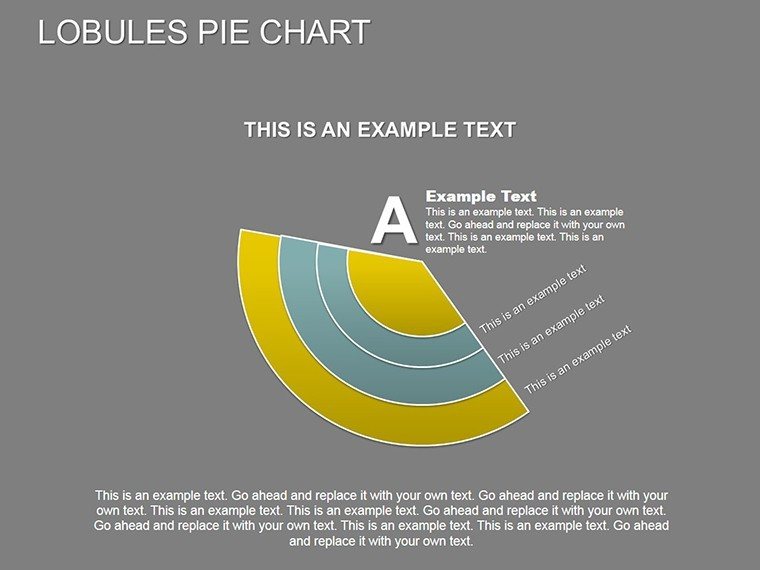
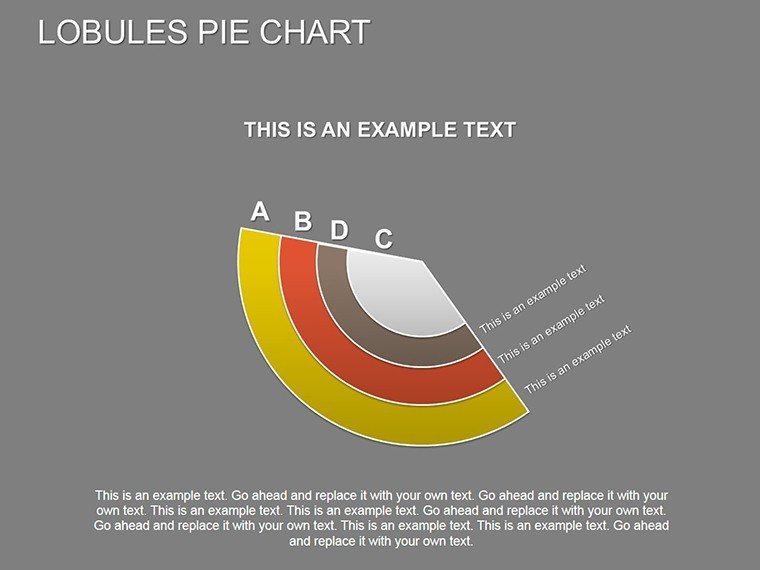
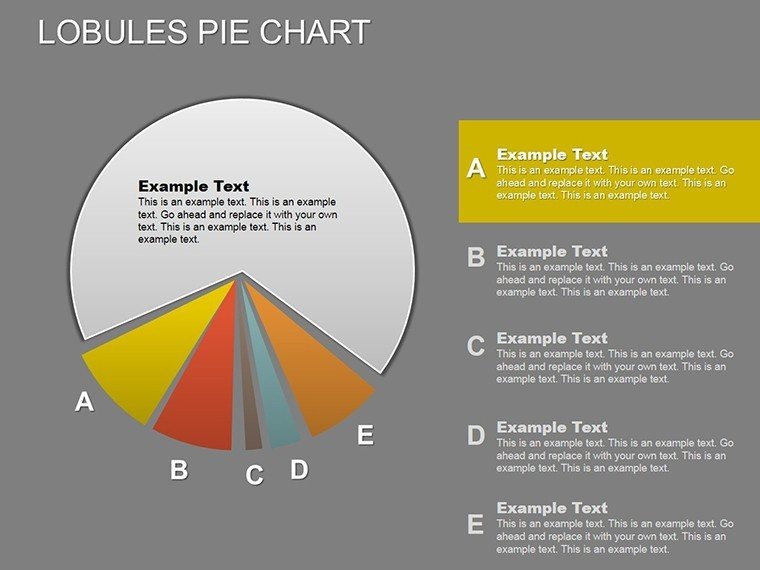
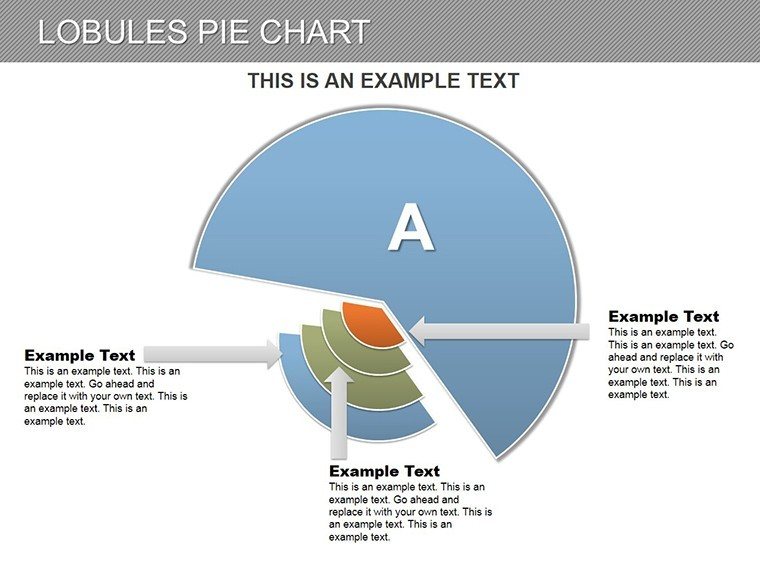
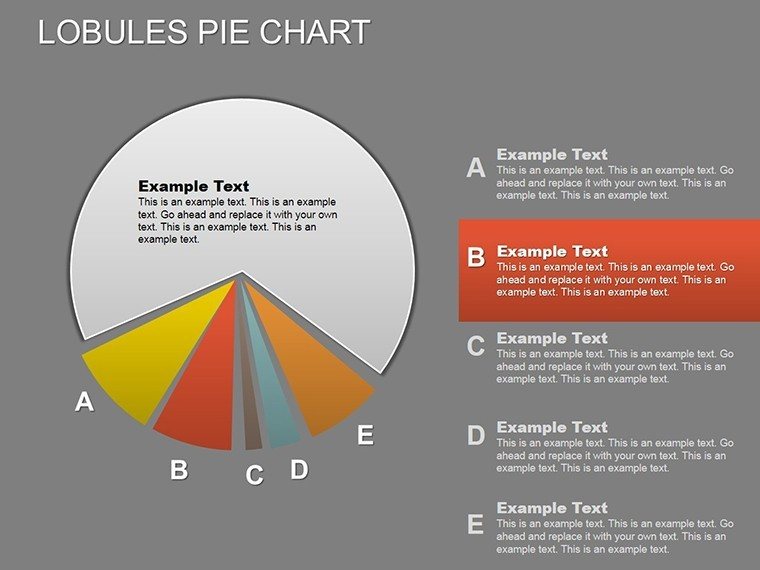
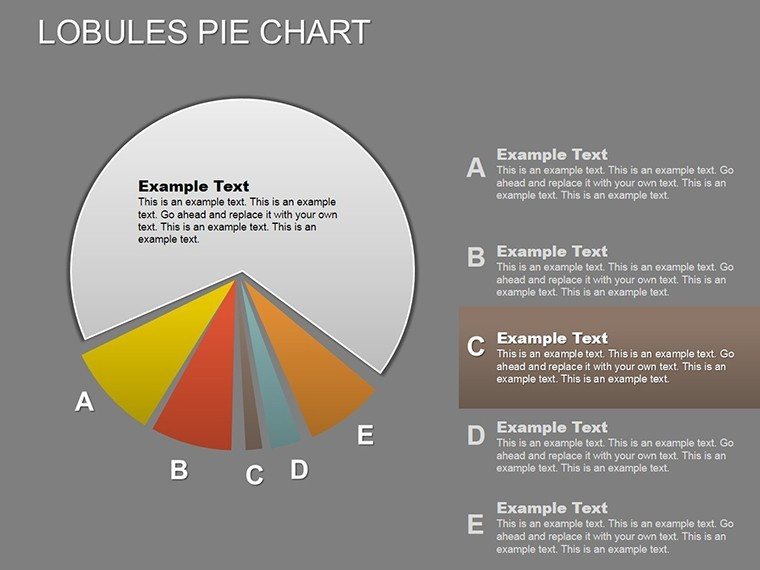
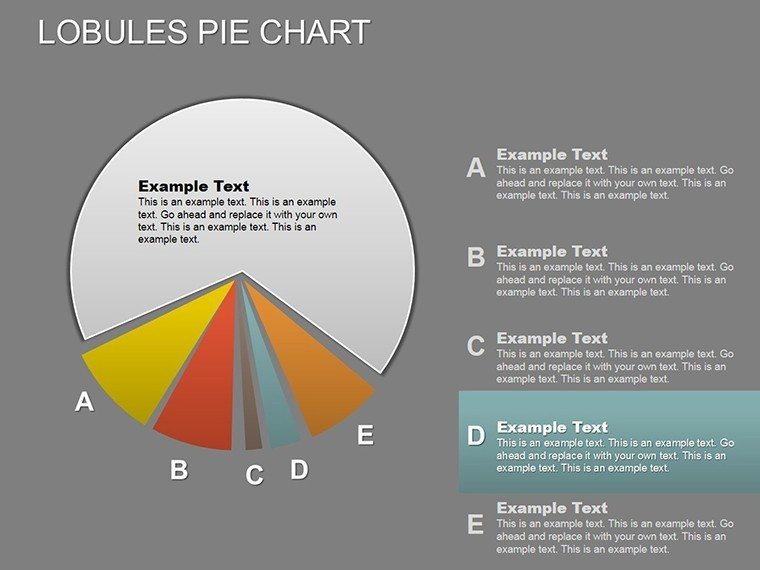
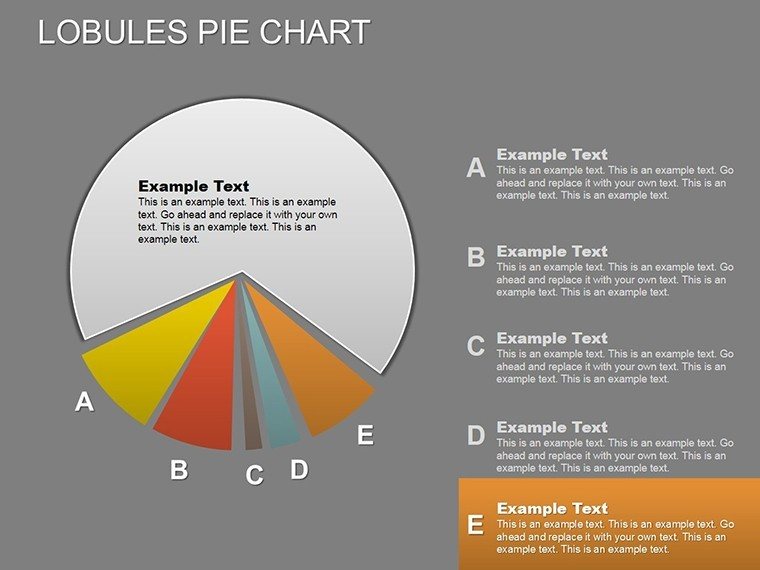
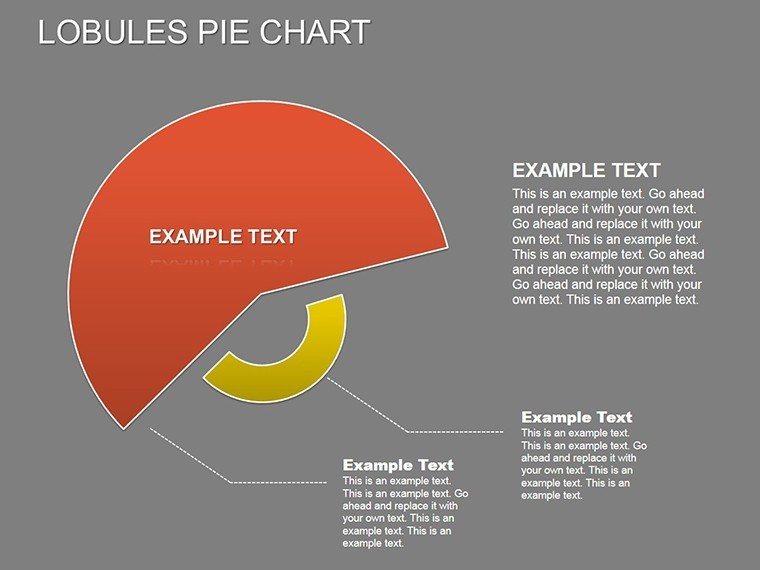
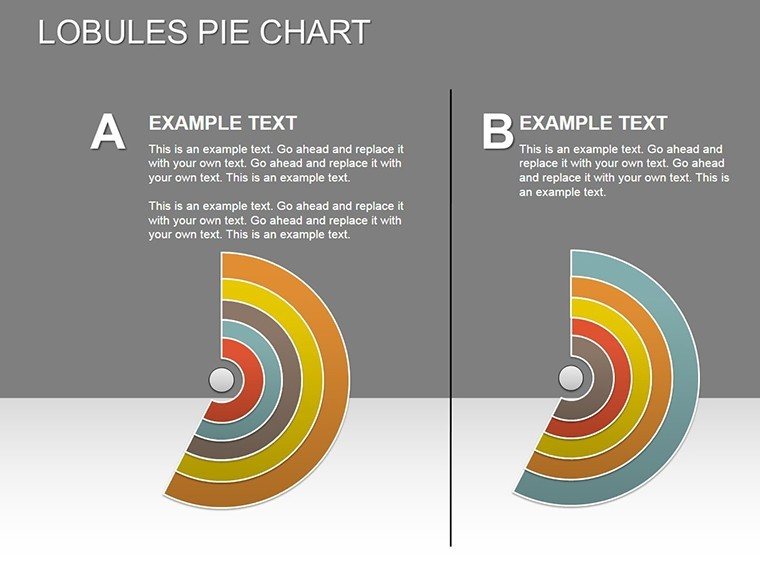
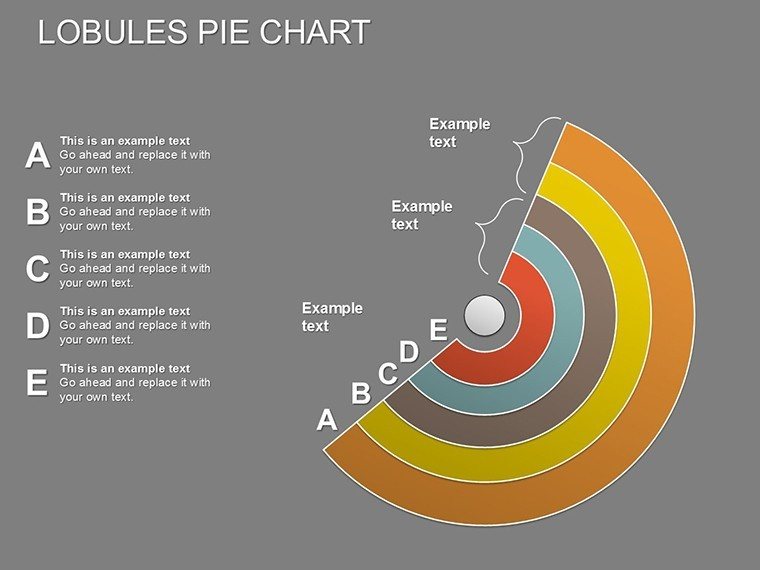
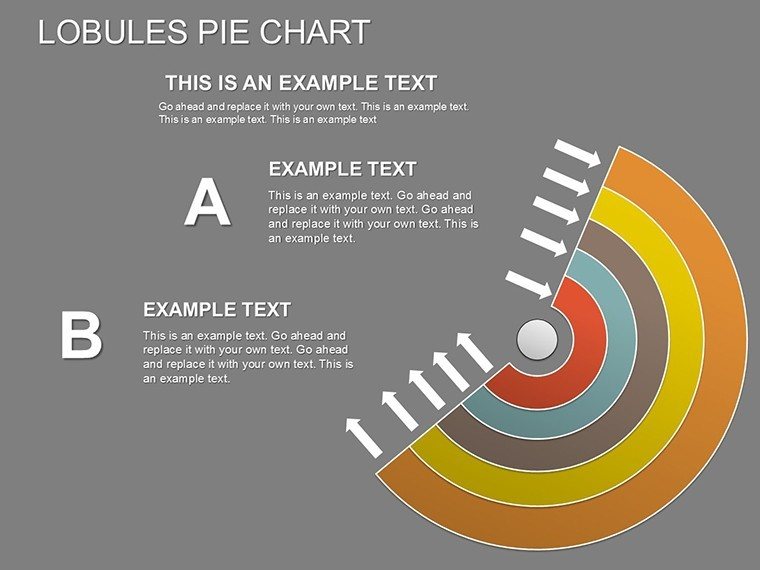
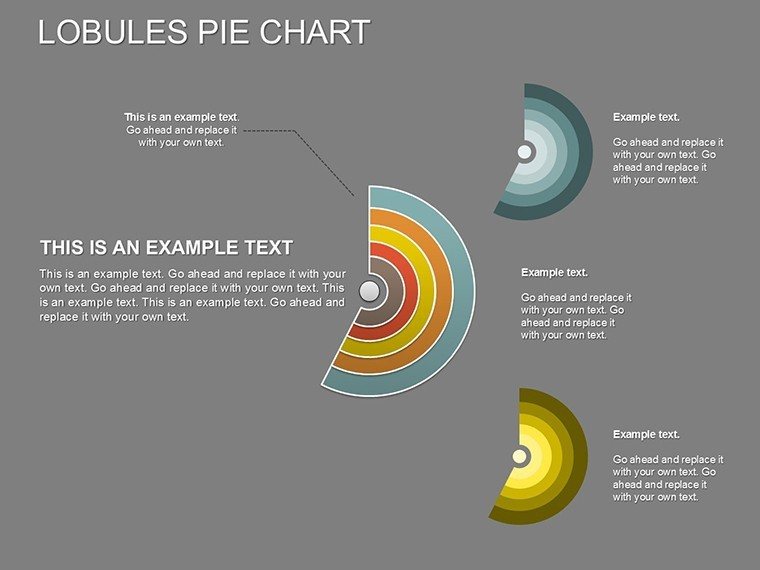
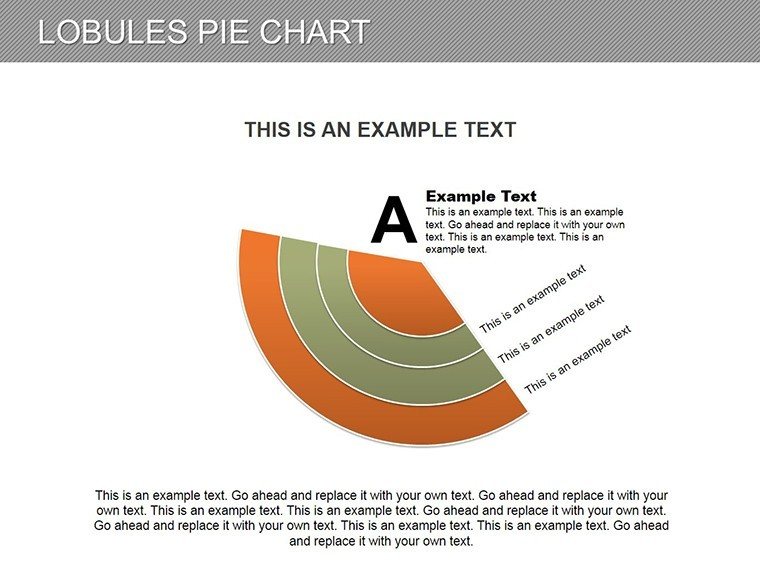
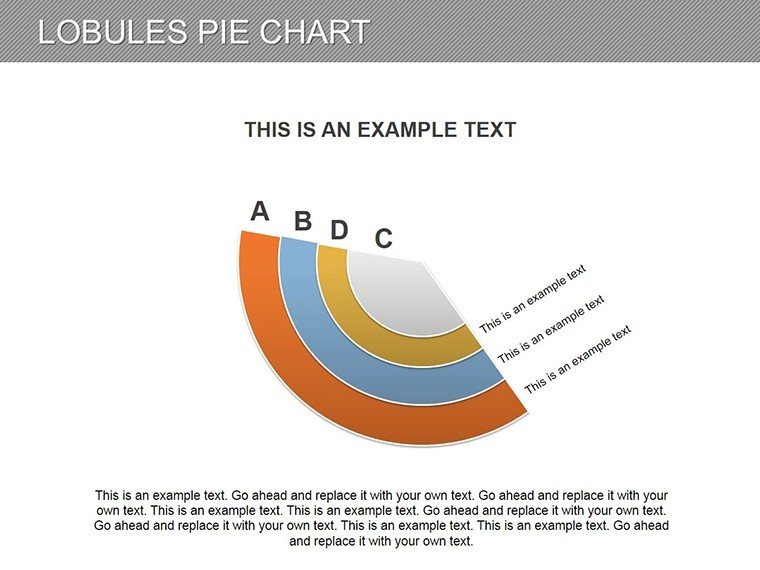
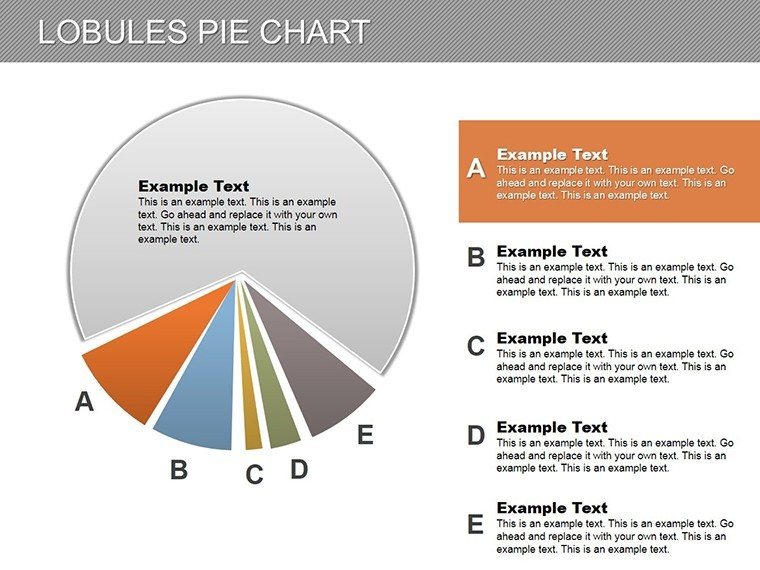
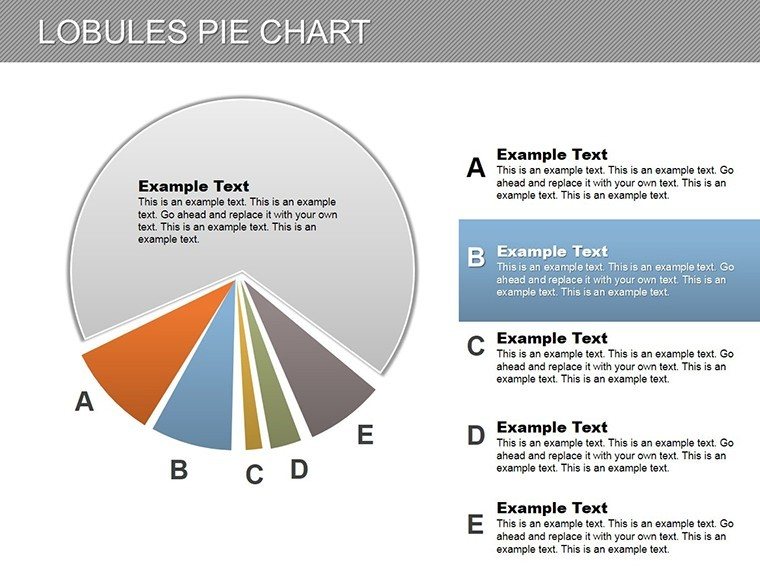
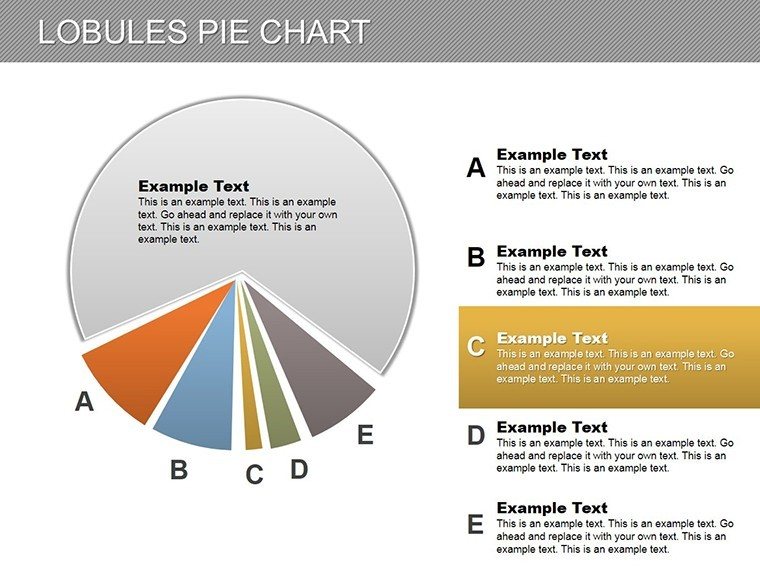
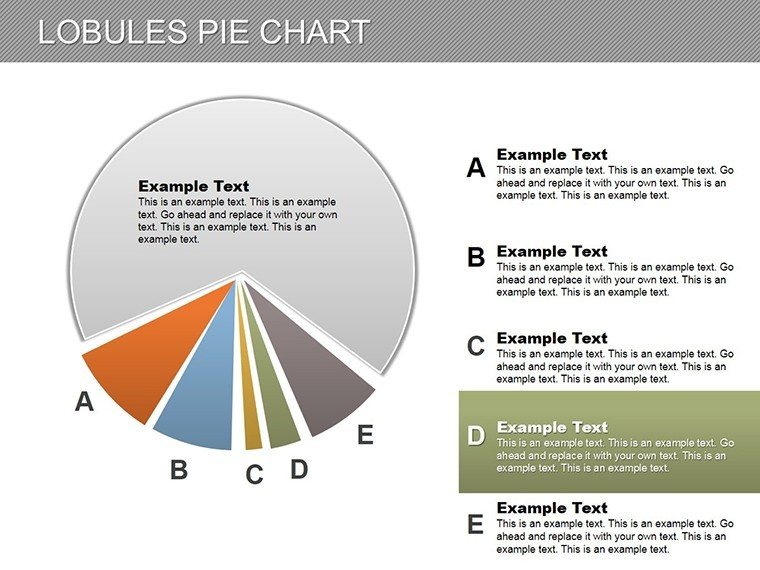
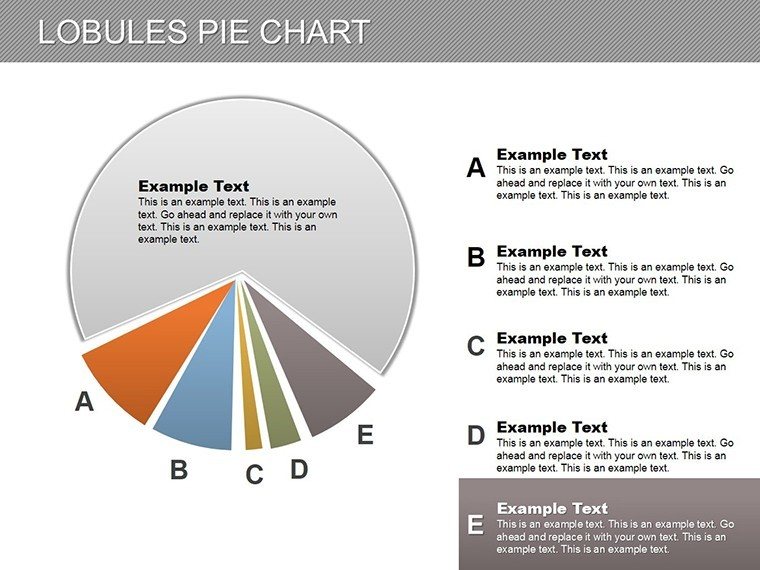
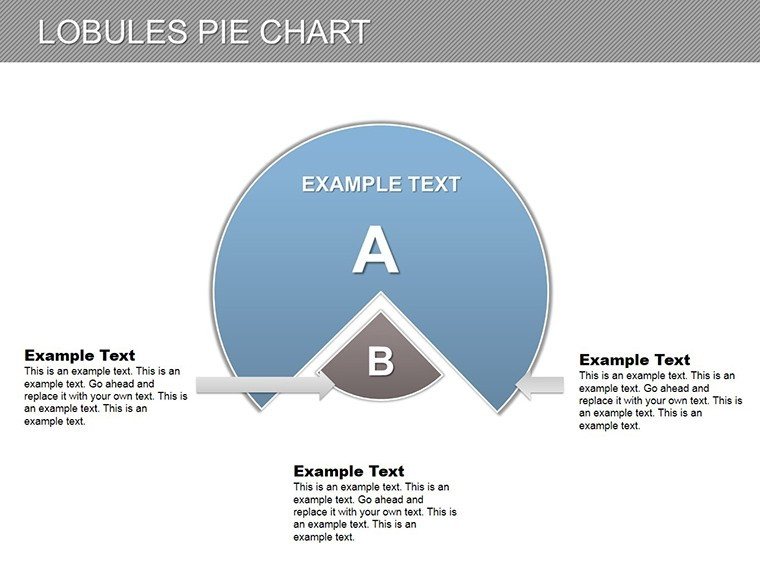
Pie charts get a sophisticated upgrade with the Lobules Pie PowerPoint Charts Template, offering 28 editable slides that feature lobed segments for nuanced data representation. This design adds depth to traditional pies, allowing for sub-divisions within slices to show multifaceted breakdowns. Suited for marketing strategists allocating budgets or educators teaching proportions, it brings data to life with visual elegance. The pie category focus ensures proportional accuracy, helping you communicate shares and wholes with authority and style.
Essential Features for Precise Pie Visuals
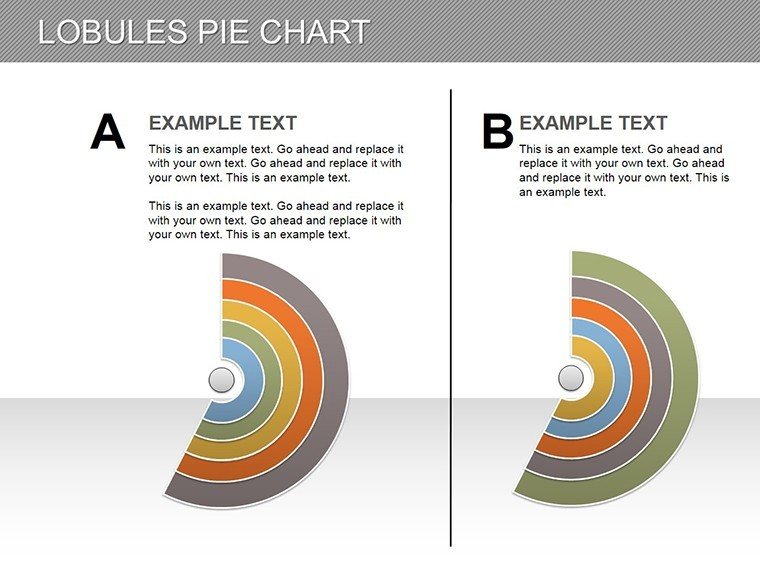
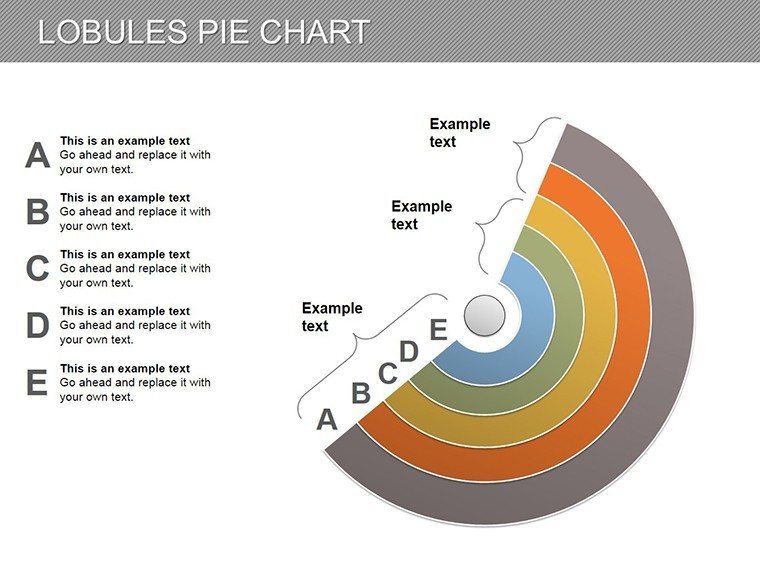
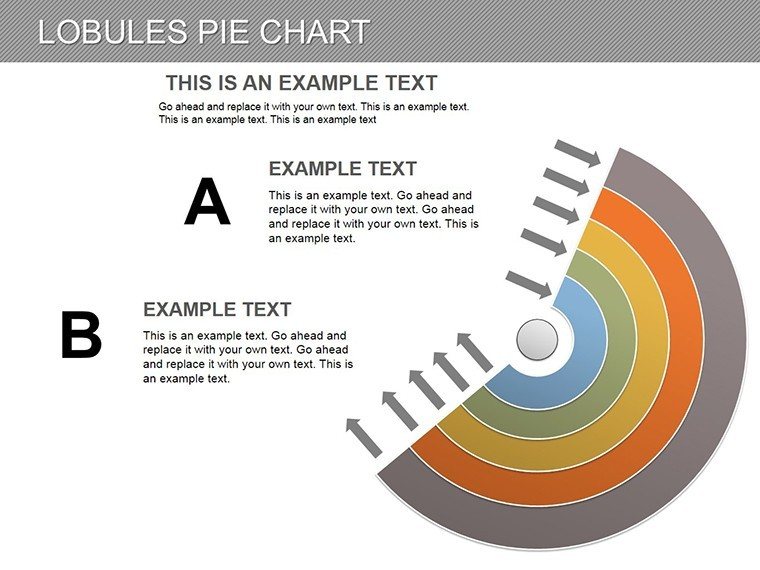
Each slide showcases lobule pies that divide data into textured segments, perfect for layered analyses like market share with regional subsets. Customization includes color gradients for emphasis, font adjustments for labels, and easy data swapping. Diverse layouts cover from basic percentages to complex hierarchical pies, all editable without advanced skills.
Layering Insights with Lobule Designs
Lobules add granularity, like in a budget pie where each slice breaks into expense categories. This, per data viz principles from Edward Tufte, minimizes chartjunk while maximizing information density. Animations can peel away lobules for progressive disclosure, enhancing storytelling in reports.
Targeted Use Cases and Examples
For sales teams, visualize revenue streams with lobuled pies showing product contributions. Educators might depict ecosystem balances, lobules representing species interactions. A project update could use it for resource allocation, leading to better team resource management in real projects aligned with PMBOK guidelines.
- Market Segmentation: Lobules detail demographics within shares.
- Financial Reporting: Break down profits by lobuled categories.
- Educational Tools: Teach fractions with visual lobule divisions.
Sync with accounting software for accurate pies, building trust through verifiable visuals.
Tips for Effective Pie Charting
Limit slices to 5-7 for readability, use contrasting hues, and label directly on lobules. Follow best practices for 3D avoidance to prevent distortion. These expert recommendations ensure your pies inform without misleading.
Claim Your Data Slicing Tool Now
This template empowers precise, pretty presentations. Download to segment your stories successfully.
Frequently Asked Questions
Why use lobules in pie charts?
They allow sub-segmentation, adding depth to standard pies for complex data.
Are the pies fully editable?
Yes, adjust data, colors, and lobule structures effortlessly.
Suitable for large datasets?
Best for proportional data; use filters for focus.
Compatible with older PowerPoint?
Works with 2010+ versions seamlessly.
Includes label options?
Yes, customizable labels and legends.
Can I export to PDF?
Yes, maintains quality for sharing.
Good for
- Project roadmaps and sprint plans
- Product launch timelines
- Quarterly or annual review decks
- Company history and milestone summaries
Licence
reviews
This worked fine for a small startup pitch deck.
The chart styles were simple and didn’t distract from the numbers.
I had to resize some icons because they looked oversized.
The dark background slides actually looked pretty nice in presentation mode.
Not bad for a quick download honestly.
FAQ
Will it work in Google Slides?
Are fonts embedded?
Can I use this for client work?
What's the refund policy?
Do you update the template after purchase?
Similar templates
See all PowerPoint Charts →
All 28 slides