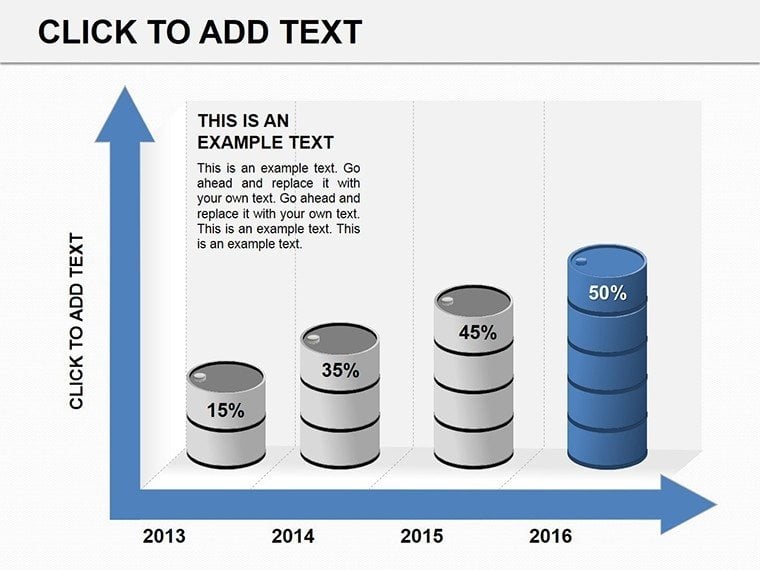
 Click to zoom
Financial Report PowerPoint Diagrams: Simplify Insights
| Format | .pptx |
| Slides | 13 unique layouts |
| Aspect ratio | 16:9 |
| Compatibility | PowerPoint |
| Animated | No |
| Language | English |
| License | Commercial |
| File size | — |
| Version | v1.0 |
| Last updated | October 2022 |
What's inside
Imagine standing in front of your board, armed with a deck that turns dense spreadsheets into compelling stories. That's the power of these Financial Report PowerPoint diagrams. Designed for professionals who juggle numbers daily, this template cuts through the noise of traditional tables, replacing them with intuitive visuals that highlight key metrics at a glance. Whether you're a CFO prepping quarterly earnings or a startup founder pitching to investors, these 13 editable slides help you focus on what matters: driving decisions with clarity.
At its core, this template reimagines financial reporting by leveraging clean lines, color-coded segments, and 3D elements that make data pop without overwhelming your audience. No more squinting at tiny figures or endless rows - each diagram distills revenue trends, expense breakdowns, and balance sheet snapshots into digestible formats. Compatible with PowerPoint 2016 and later, it's a breeze to tweak colors to match your brand or swap in your latest figures. Think of it as your secret weapon for those high-stakes meetings where every slide counts.
Unlocking the Core Features of Your Financial Visuals
Let's dive into what sets these diagrams apart. Starting with the revenue funnel slide, it uses a layered pyramid to show progression from leads to closed deals, complete with customizable icons for each stage. Adjust the heights to reflect actual conversion rates, and watch how it instantly reveals bottlenecks - perfect for sales strategy sessions.
- Balance Sheet Breakdown: A horizontal bar setup that segments assets, liabilities, and equity side by side, allowing quick equity health checks.
- Cash Flow Timeline: A curved arrow diagram tracing inflows and outflows over quarters, with embedded callouts for variances.
- Profit Margin Matrix: Grid-based visuals that cross-reference margins against product lines, highlighting top performers.
Each element is vector-based, ensuring scalability without pixelation, and the muted palette - grays, blues, and subtle greens - keeps the focus on data, not distractions. For instance, in a recent team review, a finance lead swapped the default metrics into this template and noted how the 3D pie for expense allocation made departmental overspends impossible to ignore.
Seamless Customization for Real-World Reporting
Customization here isn't just a buzzword; it's straightforward. Open the slide, select a shape, and the smart guides snap elements into place. Add your logo to the footer master, and it's branded across all 13 slides in under five minutes. If you're dealing with multi-currency reports, the flexible text boxes accommodate symbols effortlessly, while the animation presets - like sequential bar growth - add subtle motion to emphasize growth trajectories without gimmicks.
Consider integrating it into your workflow: Export from Excel, paste values into the linked charts, and refresh. This template shines in hybrid setups, where remote viewers appreciate the high-contrast design that holds up on shared screens.
Practical Applications in Business Finance
From boardrooms to investor calls, these diagrams adapt to your narrative. Picture a venture capital pitch: Use the growth projection slide - a line graph with shaded confidence intervals - to forecast scalability, tying back to funding asks. Or in internal audits, the variance analysis wheel spins out deviations from budget, prompting targeted discussions.
- Quarterly Earnings: Layer in YoY comparisons with dual-axis charts to spotlight seasonal dips.
- Budget Planning: Employ the donut segments for allocation previews, making stakeholder buy-in smoother.
- Risk Assessment: Map threats via interconnected nodes, visualizing mitigation paths like a financial roadmap.
In one application, a mid-sized retailer used the inventory turnover diagram to justify expansion, showing how optimized stock levels boosted margins. It's these targeted uses that turn raw data into strategic assets, helping you not just report numbers but influence outcomes.
Comparing to Standard PowerPoint Tools
Why choose this over vanilla shapes? Built-in themes save hours versus manual alignment, and the pre-set color harmonies ensure accessibility - think WCAG-compliant contrasts for diverse audiences. While basic PowerPoint offers flexibility, this template's finance-specific layouts, like the KPI dashboard aggregator, provide ready-to-go sophistication that novices can master quickly.
Pro tip: Pair it with conditional formatting from linked spreadsheets for live updates during presentations, a step up from static embeds.
Streamlining Your Presentation Workflow
Integrating these diagrams means less prep time and more impact. Start by outlining your key messages, then slot in relevant slides - the modular design lets you mix and match without reformatting. For collaborative teams, the .pptx format supports co-editing in real-time, with change tracking to avoid version chaos.
Enhance engagement by adding hyperlinks to detailed appendices, turning your deck into an interactive report. And for those all-nighters before deadlines, the consistent grid system ensures polished results, even under pressure.
Tips for Maximum Impact
To really shine, limit each slide to three data points - let the visuals breathe. Test on a projector early to confirm readability, and rehearse transitions to build narrative flow. Remember, the goal is insight, not information overload; these diagrams excel at that balance.
Ready to transform your next financial review? Download this template today and watch your reports resonate like never before.
Frequently Asked Questions
What formats are supported?
The template is in .pptx format, fully compatible with PowerPoint 2016 and newer versions, including Microsoft 365.
How editable are the diagrams?
All elements, from shapes to charts, are fully vector-editable, allowing color changes, data updates, and resizing without quality loss.
Can I use this for non-financial presentations?
Absolutely - adapt the layouts for any data-driven talk, like project metrics or performance reviews.
Is there support for animations?
Yes, subtle entrance and emphasis animations are pre-applied, customizable via the Animations pane.
What's the file size?
Around 5MB, optimized for quick loading and sharing.
Do you offer refunds?
Check our policy for details, but we're confident in the value provided.
Good for
- Project roadmaps and sprint plans
- Product launch timelines
- Quarterly or annual review decks
- Company history and milestone summaries
Licence
reviews
Used this for a manufacturing report.
FAQ
Will it work in Google Slides?
Are fonts embedded?
Can I use this for client work?
What's the refund policy?
Do you update the template after purchase?
Similar templates
See all Powerpoint Diagrams →

All 13 slides