 Click to zoom
Versatile Collection: PowerPoint Diagrams Pack
| Format | .pptx |
| Slides | 19 unique layouts |
| Aspect ratio | 16:9 |
| Compatibility | PowerPoint |
| Animated | No |
| Language | English |
| License | Commercial |
| File size | — |
| Version | v1.0 |
| Last updated | January 2026 |
What's inside
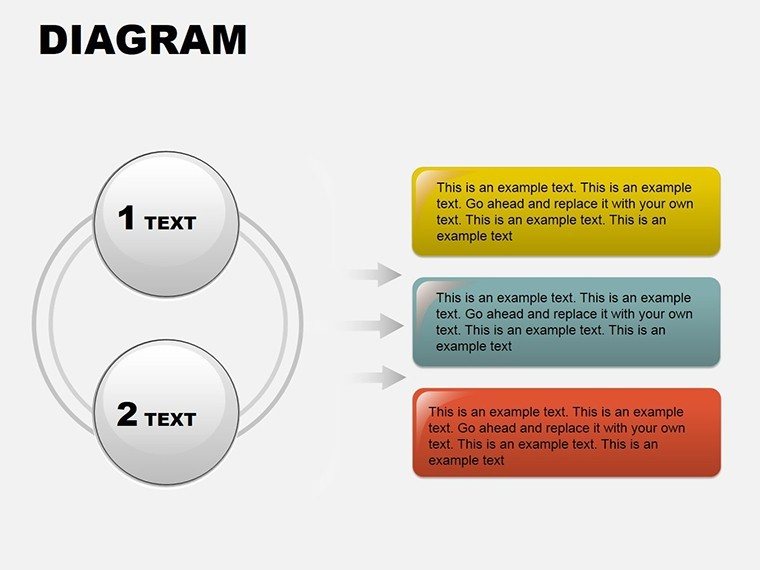
Ever stared at a blank slide, wondering how to weave data into a narrative that sticks? The Collection PowerPoint Diagrams template steps in as your versatile ally, offering 19 editable slides that blend clean minimalism with imaginative flair. Designed for the busy professional - be it a marketer crafting quarterly reports, an educator simplifying dense theories, or a consultant pitching bold strategies - this pack delivers ready-to-use diagrams that adapt to your vision without the hassle of starting from scratch.
Picture transforming a routine team update into a visual feast: pie charts that pulse with color-coded insights, arrow flows that propel your story forward, and thematic layouts that echo your brand's pulse. Compatible across PowerPoint versions from 2013 onward, these .pptx files load instantly, with smart art alternatives that outperform native tools in flexibility and polish. It's more than slides; it's a shortcut to decks that resonate, leaving colleagues nodding and clients leaning in.
Unlocking the Power of Diverse Diagram Types
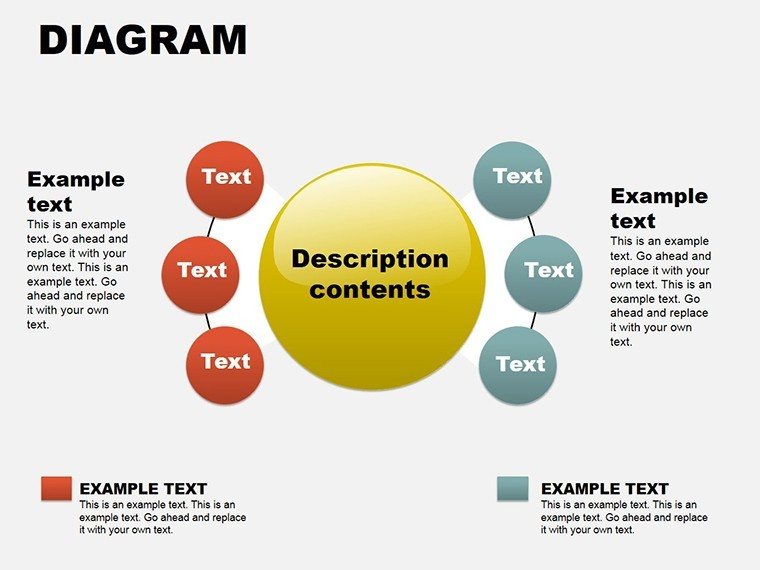
This collection stands out by curating a spectrum of diagram styles, each honed for specific storytelling needs. From foundational pie segments breaking down market shares to intricate arrow networks mapping project timelines, every element invites personalization. Dive into the modern themes for sleek corporate vibes or switch to vibrant hues for energetic workshops - your choice shapes the mood.
- Thematic Variety: Mix-and-match layouts spanning minimalist lines to bold illustrations, ensuring fit for any occasion.
- Customization Depth: Alter fonts for readability, recolor segments for emphasis, and rearrange nodes for logical progression.
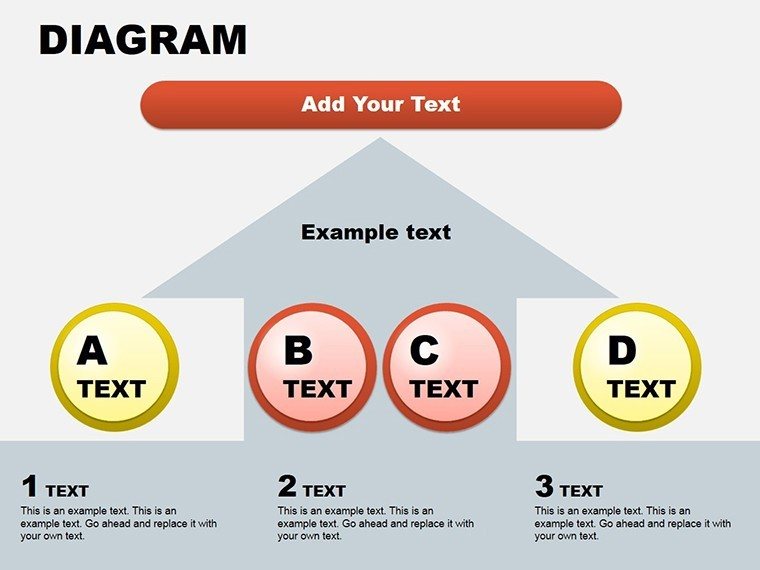
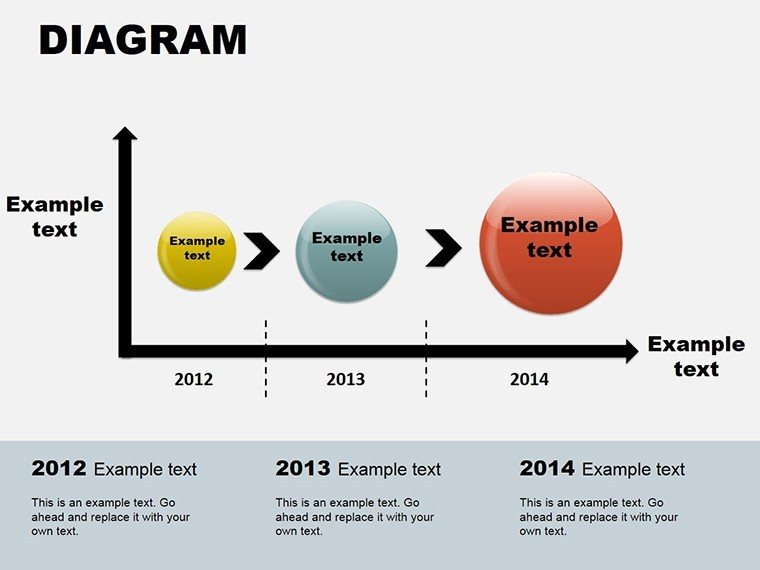
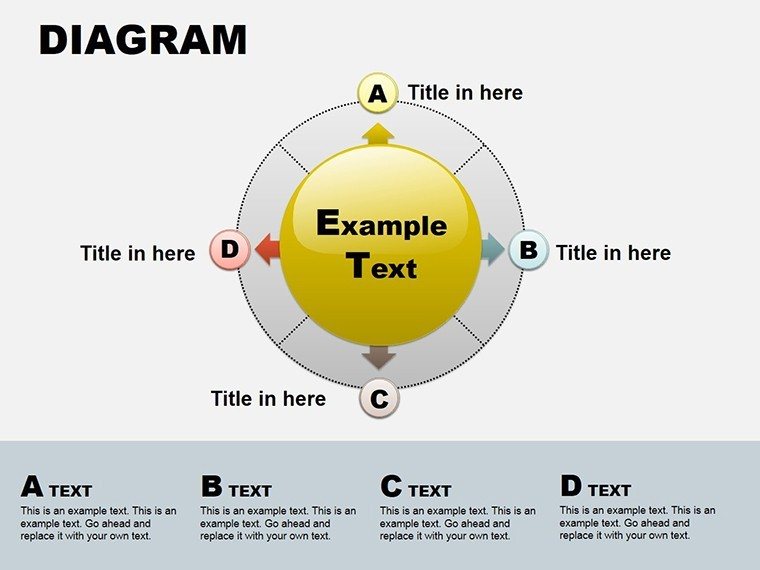
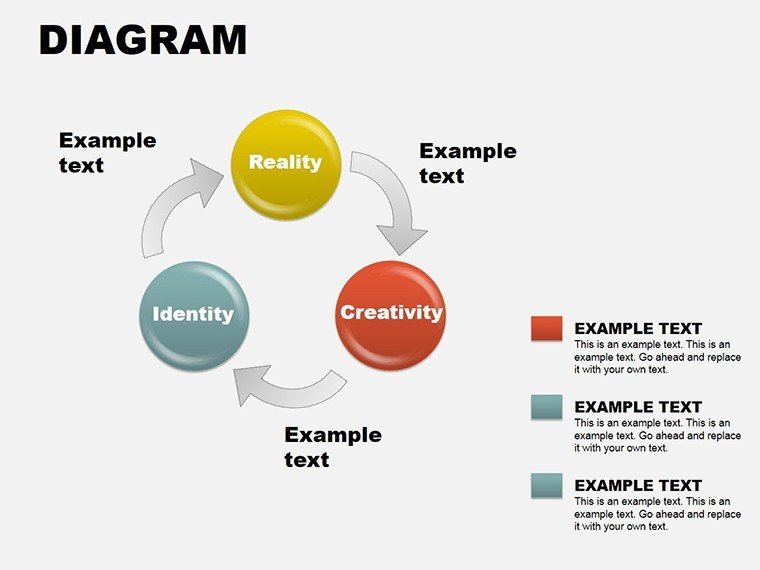
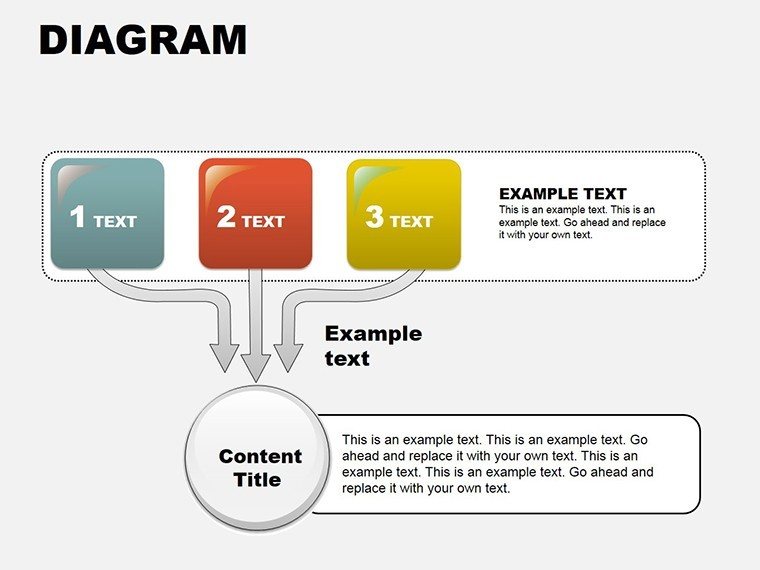
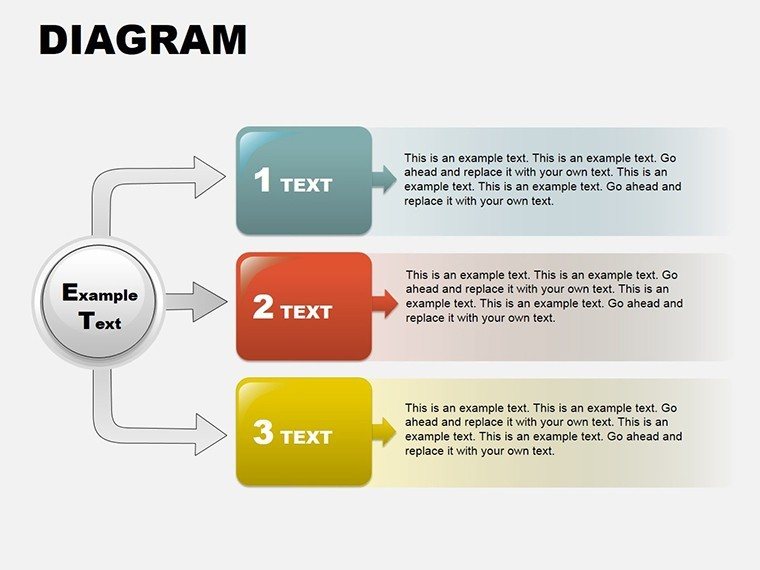
- 19 Tailored Slides: Includes essentials like bar comparisons (slide 5) and cycle loops (slide 12), plus hybrids for multifaceted data.
- Integrated Icons: Over 50 thematic symbols - gears for processes, lightbulbs for innovations - ready to embed and scale.
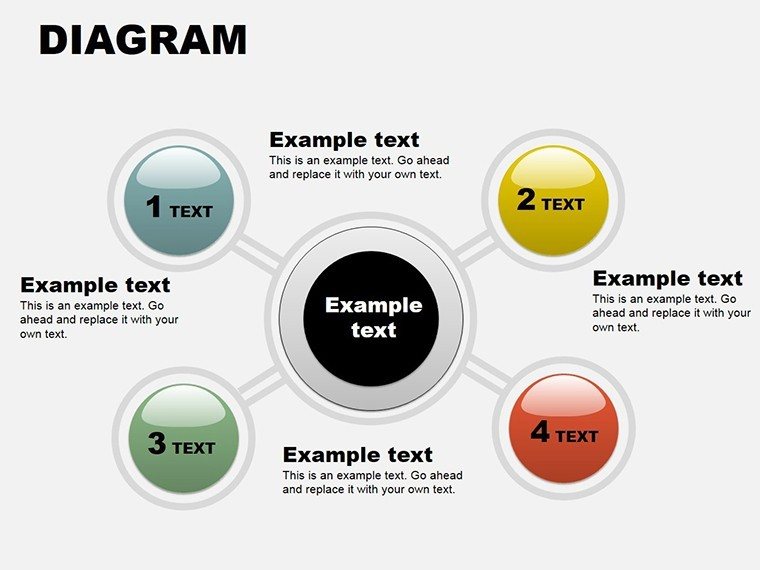
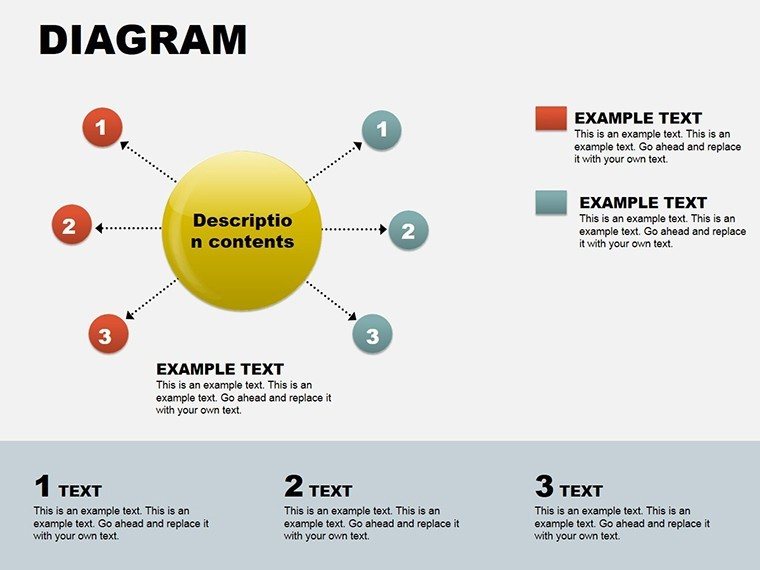
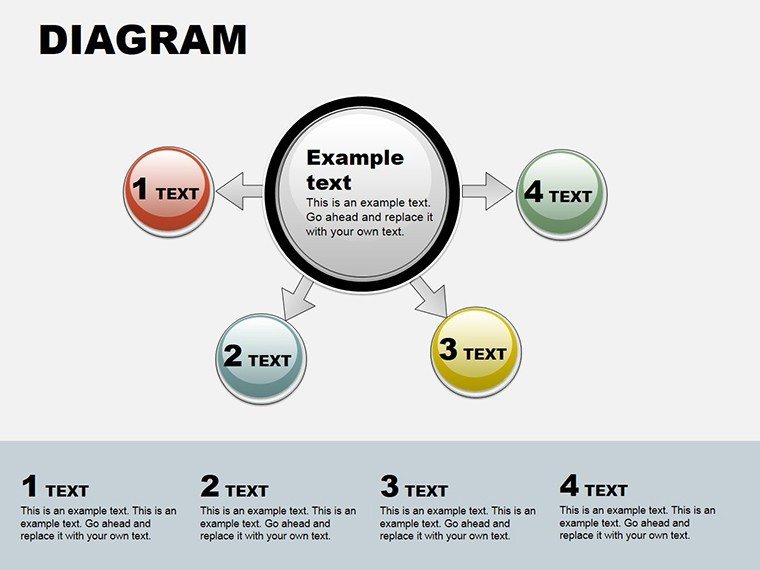
Take slide 8's radial diagram: it's primed for stakeholder mapping, where spokes radiate from a core objective, making relationships crystal clear at a glance.
Mastering Customization: A Hands-On Workflow
Customization here is intuitive, empowering you to iterate fast without design detours. Launch the template, select a slide, and watch options unfold in the ribbon - far smoother than cobbling together shapes manually.
- Select and Swap: Click a diagram element; the properties pane reveals edit modes for text, data, or visuals - update in seconds.
- Theme Alignment: Apply your palette via the design tab, watching accents ripple across all slides for instant cohesion.
- Enhance with Data: Link to Excel for live updates, or manually input via drag-drop for static overviews.
- Add Flair: Insert transitions like zoom-ins on key segments to build suspense and focus.
- Finalize Flow: Use outline view to reorder, then rehearse timings for flawless delivery.
This process shines in collaborative settings, where shared links allow real-time tweaks, turning solo efforts into group symphonies.
Practical Applications Across Industries
For marketers, slide 2's funnel diagram dissects customer journeys, layering stages with conversion visuals that mirror tools like Google Analytics. A sales lead might leverage slide 15's competitive matrix, plotting rivals in a grid where strengths glow and gaps highlight opportunities - echoing tactics from pros like Seth Godin, who emphasize visual permission to persuade.
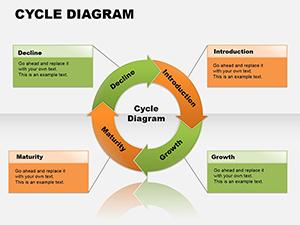
In education, educators use the cycle diagrams (slides 10-12) to loop through scientific methods, animating steps to mimic real experimentation. Business analysts adore the bar and line hybrids for forecasting, as in slide 18, where trends climb alongside benchmarks, simplifying boardroom debates.
Even in non-profits, these adapt: envision slide 6's org chart evolving into a donor hierarchy, with branches illustrating impact tiers. The pack's breadth ensures relevance, whether dissecting budgets or dreaming up initiatives.
Pro Tips for Diagram-Driven Storytelling
Anchor each diagram to one core message - overloading dilutes impact. Use whitespace around arrows to guide eyes, and test on varied devices for legibility. For data-heavy slides, opt for subtle shadows to add dimension without clutter.
Standing Apart from Standard Slide Builders
While PowerPoint's defaults suffice for basics, they falter on nuance - this collection bridges that with pre-balanced compositions that resist distortion. No more wrestling alignments; instead, focus on insights. It integrates seamlessly with add-ins like Morph for fluid scene changes, amplifying engagement over static stacks.
Embrace this pack to craft decks that don't just inform but transform - sparking ideas that linger long after the applause.
Curious to build your masterpiece? Grab the Collection PowerPoint Diagrams pack and redefine your slide game today.
Frequently Asked Questions
How versatile are the themes in this collection?
Extremely - spanning clean corporate to playful creative, with full edit controls to blend styles as needed.
Can I link diagrams to live data sources?
Yes, via PowerPoint's chart tools, pulling from Excel for automatic refreshes on updated figures.
Is it beginner-friendly for non-designers?
Definitely; guided edits and tooltips make complex changes straightforward, no expertise required.
What if I need more than 19 slides?
Duplicate and modify existing ones, or mix with other templates for expanded decks.
Does it work on Mac PowerPoint?
Fully compatible, with identical features across Windows and macOS versions.
Are animations included by default?
Basic ones are preset; customize further in the animations pane for tailored effects.
Good for
- Project roadmaps and sprint plans
- Product launch timelines
- Quarterly or annual review decks
- Company history and milestone summaries
Licence
reviews
The hierarchy diagrams were useful for explaining our department structure.
I only needed a couple slides and deleted most of the deck.
Easy to swap colors without ruining the layout.
One of the charts broke after copy paste but I fixed it.
Saved me some time before a Monday meeting.
FAQ
Will it work in Google Slides?
Are fonts embedded?
Can I use this for client work?
What's the refund policy?
Do you update the template after purchase?
Similar templates
See all Powerpoint Diagrams →
All 19 slides