 Click to zoom
Collection Cycle Period PowerPoint Diagrams Template
| Format | .pptx |
| Slides | 12 unique layouts |
| Aspect ratio | 16:9 |
| Compatibility | PowerPoint |
| Animated | No |
| Language | English |
| License | Commercial |
| File size | — |
| Version | v1.0 |
| Last updated | May 2024 |
What's inside
In the fast-paced world of finance and operations, clarity on collection cycles can mean the difference between smooth cash flow and nagging delays. The Collection Cycle Period PowerPoint Diagrams Template steps in as your visual ally, offering 12 editable slides packed with flowcharts, timelines, and stage breakdowns to demystify these processes. Tailored for business analysts, project managers, educators, and financial pros, it turns convoluted procedures into straightforward narratives that inform and inspire action.
Whether you're dissecting accounts receivable in a quarterly report or explaining patient billing in a healthcare seminar, this .potx template - compatible with PowerPoint 2016 and beyond, plus Google Slides - delivers high-quality graphics that adapt to your needs. Adjust colors, fonts, or data on the fly, and watch as step-by-step visuals make even the densest topics accessible. A financial consultant adapted these for a client audit presentation, crediting the timeline slide for spotlighting bottlenecks that led to a 15% efficiency gain - though results vary by implementation.
Key Elements That Power Your Cycle Visuals
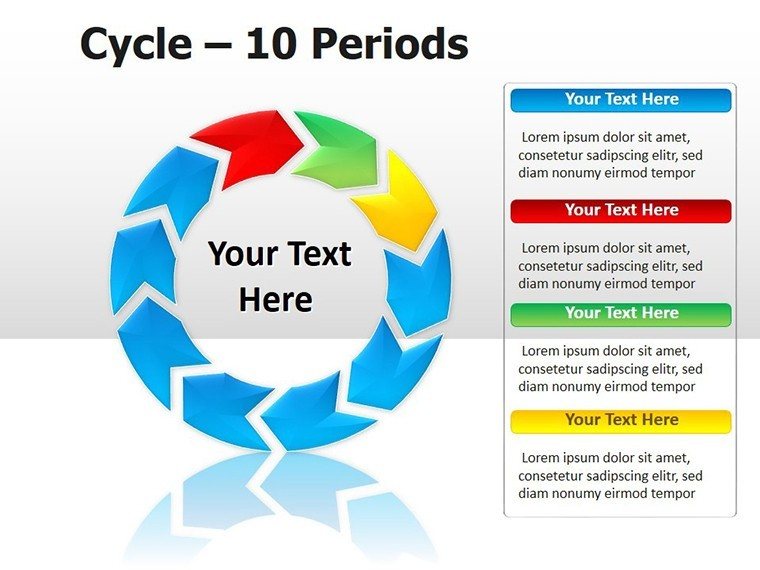
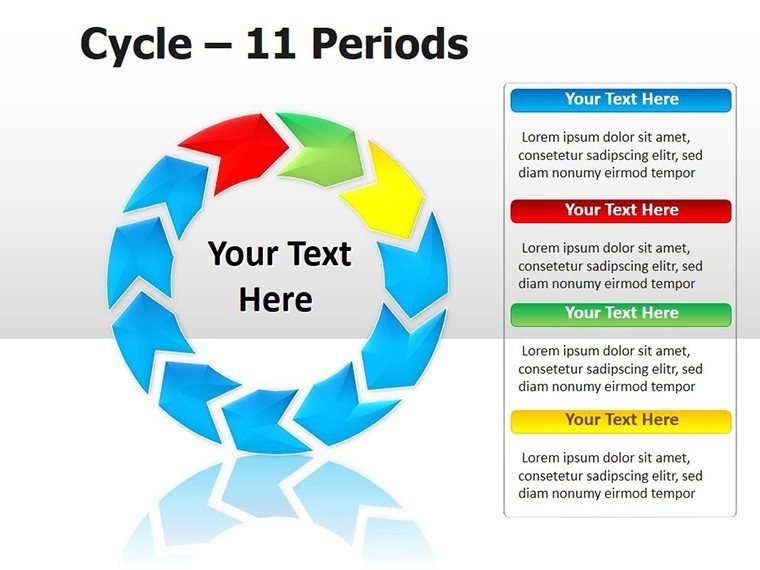
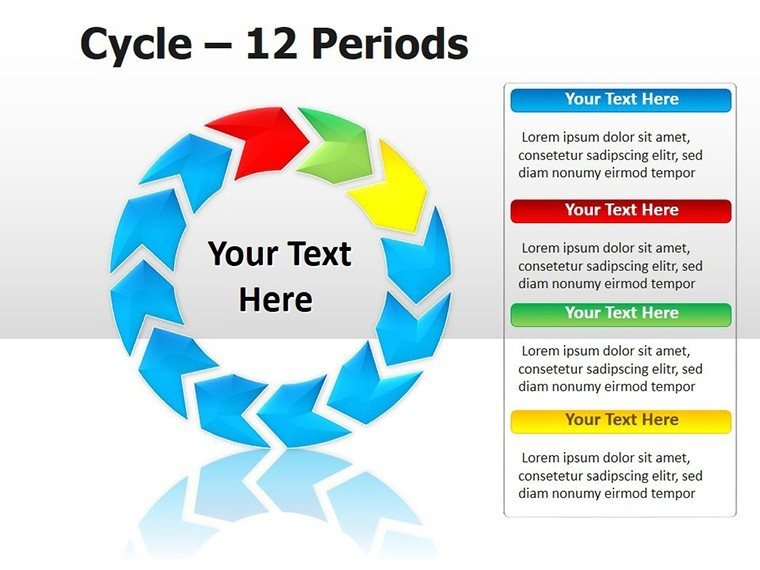
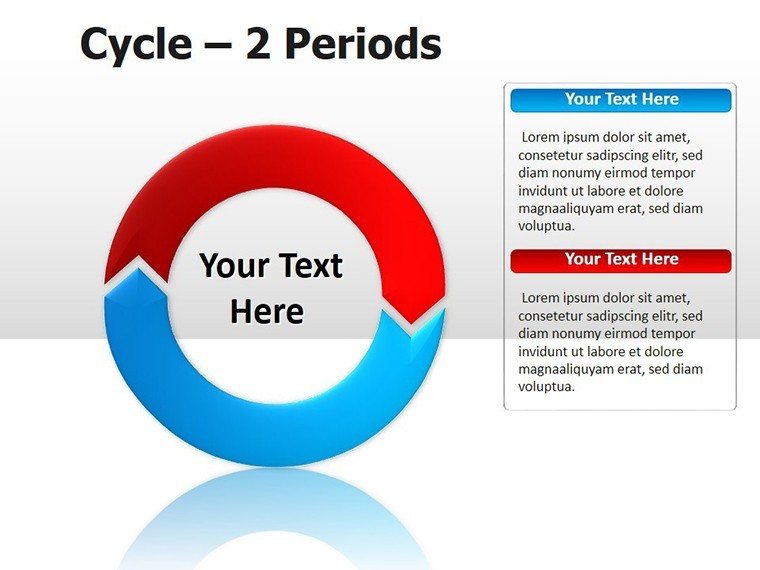
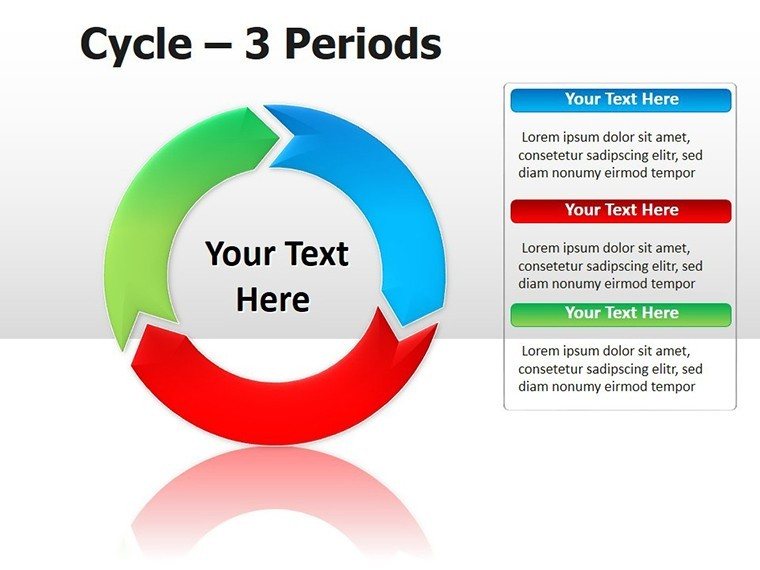
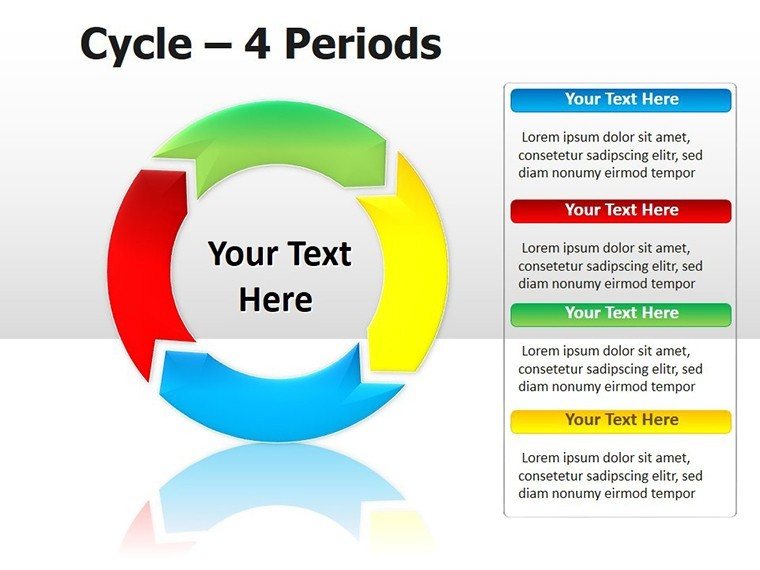
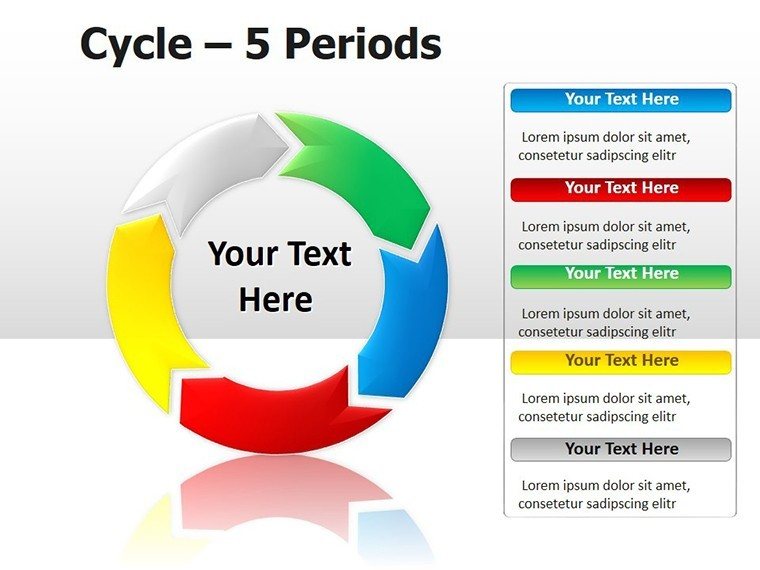
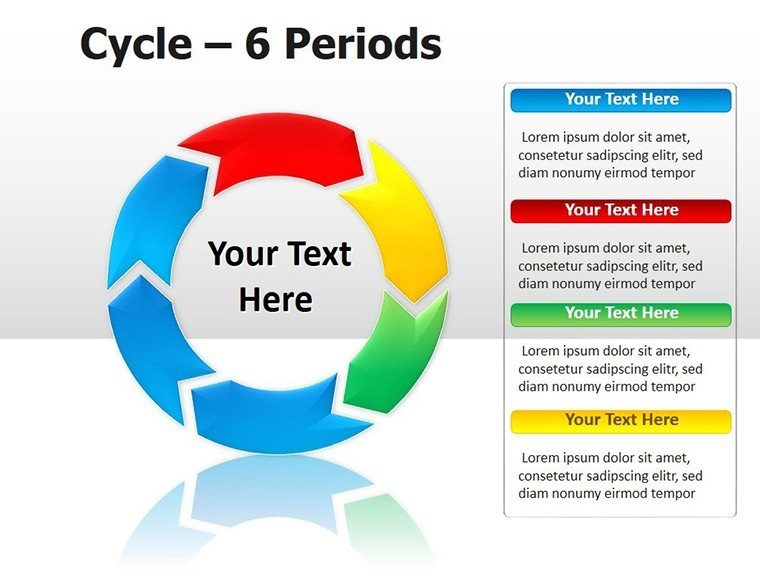
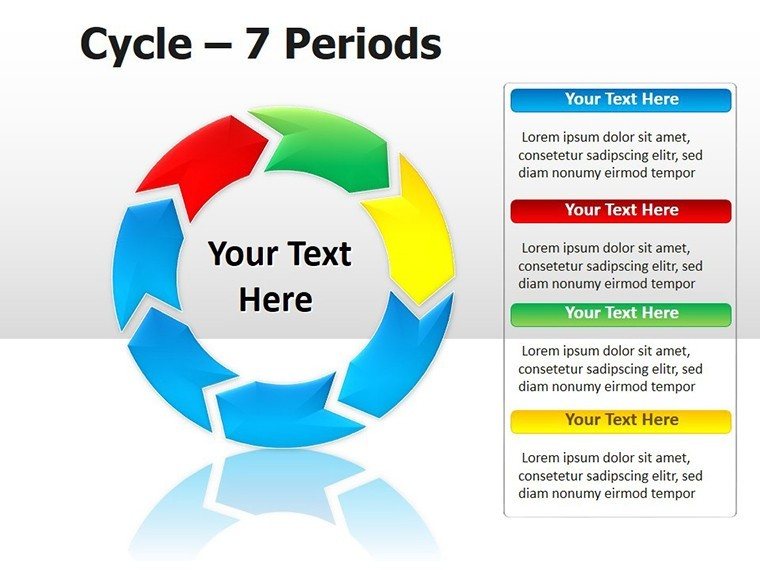
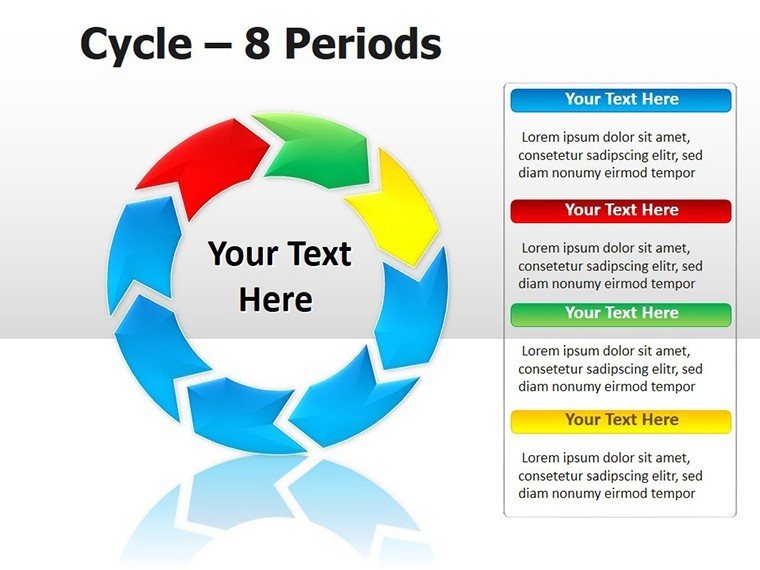
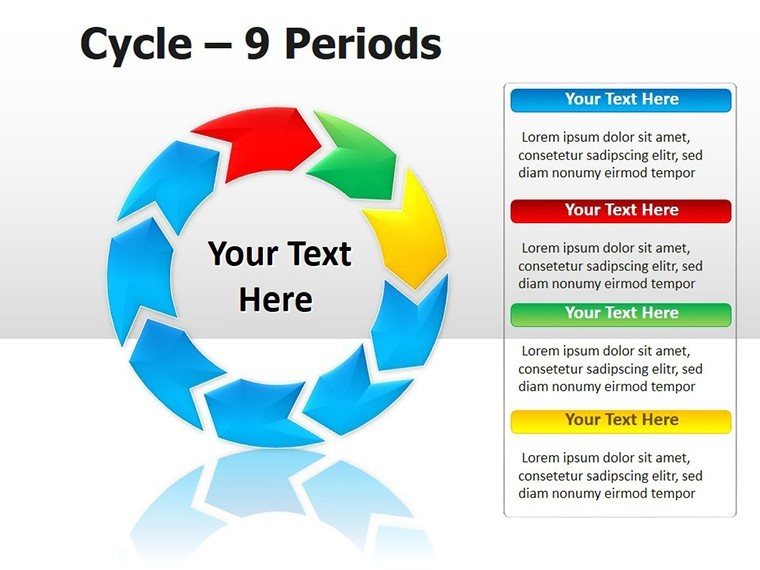
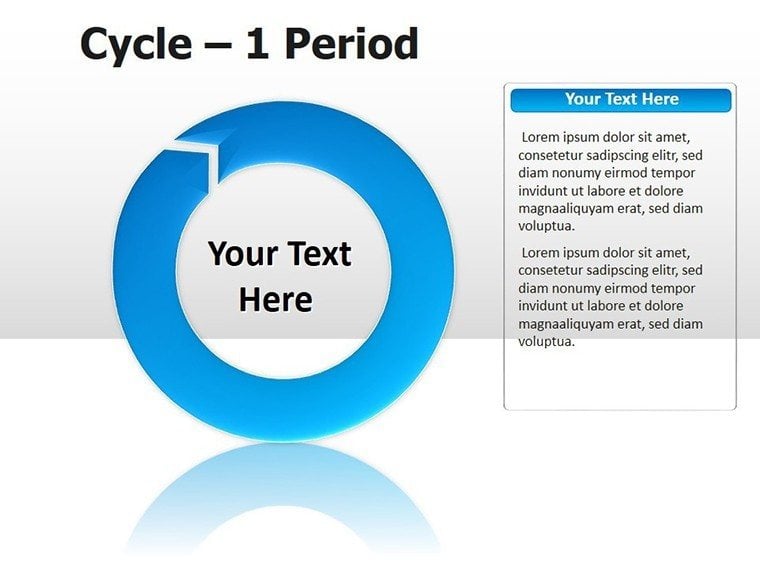
Slide 1 sets the foundation with a comprehensive cycle overview, a looping arrow diagram encircling phases like invoicing and follow-up. Progress to slide 4's detailed flowchart, branching into decision points for disputes or escalations - perfect for operational deep dives. The timeline templates in slides 7-9 stretch across periods, marking durations with milestone markers, while step-by-step stages in the later slides use sequential icons for granular walkthroughs.
Every element is customizable: Swap industry-specific icons (e.g., dollar signs for finance, stethoscopes for health), resize paths for emphasis, or embed formulas for dynamic calculations. Professional themes ensure cohesion, whether for dark conference rooms or bright webinars.
- Cycle Flowcharts: Looped paths to illustrate repetition and continuity.
- Flexible Timelines: Horizontal or vertical spans for period tracking.
- Stage-by-Stage Breakdowns: Numbered visuals for procedural clarity.
- Adaptable Graphics: High-res, theme-ready for any sector.
Versatile Scenarios: Applying Cycles Across Industries
For finance teams, slide 6's radial diagram maps collection stages from issuance to receipt, highlighting average days outstanding with color gradients. In healthcare, educators use slide 10's linear process to outline insurance claims cycles, each step a badge for verification or appeals - making lectures more relatable. Project managers in business ops might chain slides 2-5 for vendor payment flows, integrating Gantt-like elements to forecast delays.
A hands-on approach: Begin with audience needs - finance? Emphasize metrics; education? Focus on pedagogy. Tip from workflow experts: Animate paths sequentially to guide eyes, revealing one phase at a time for better comprehension over static views.
- Identify Your Cycle: Pick slides matching your process length.
- Input Data: Fill timelines with dates, values, or descriptions.
- Customize Visuals: Align colors to company branding or risk levels.
- Integrate and Share: Link to spreadsheets, then export for multi-format use.
Versus generic tools, this template's pre-vetted layouts save design time, letting you prioritize insights. It's built for credibility, with clean aesthetics that convey expertise in client-facing scenarios.
Refining for Precision: Tips to Maximize Effectiveness
Enhance retention by pairing diagrams with real examples - overlay a case like a retailer's seasonal collections on slide 8. For virtual delivery, ensure high contrast for screen shares. The modular design allows mixing slides across decks, creating hybrid views for cross-department reports.
Unlock clearer cycles and stronger outcomes. Secure this template for $24 and cycle toward success.
Frequently Asked Questions
What industries does this template suit best?
Finance, healthcare, education, and business management, with adaptable elements for others.
Are the diagrams editable in Google Slides?
Yes, import the .potx and edit freely for team collaboration.
How many slides are included?
12 slides, from overviews to detailed stage visuals.
Can I adjust colors and fonts easily?
Definitely - use PowerPoint's theme tools for quick, consistent changes.
Does it include high-quality graphics?
All elements are vector-based for sharp, professional outputs.
Good for
- Project roadmaps and sprint plans
- Product launch timelines
- Quarterly or annual review decks
- Company history and milestone summaries
Licence
reviews
It's okay I guess but I've seen better free templates online this one is average.
The file opened without any issues and I could edit it on my Mac using PowerPoint for Mac.
Put together a matrix for a decision making exercise and the four quadrant layout was clean.
The template has way too many arrows pointing everywhere I deleted half of them.
Used the radial diagram for a mind map and the circle layout was symmetrical.
FAQ
Will it work in Google Slides?
Are fonts embedded?
Can I use this for client work?
What's the refund policy?
Do you update the template after purchase?
Similar templates
See all Powerpoint Diagrams →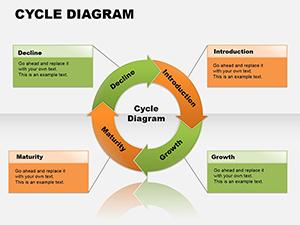
All 12 slides