 Click to zoom
Triangular Cycle Keynote Charts: Streamline Progress Visualization
| Format | .pptx |
| Slides | 9 unique layouts |
| Aspect ratio | 16:9 |
| Compatibility | PowerPoint |
| Animated | No |
| Language | English |
| License | Commercial |
| File size | — |
| Version | v1.0 |
| Last updated | September 2021 |
What's inside
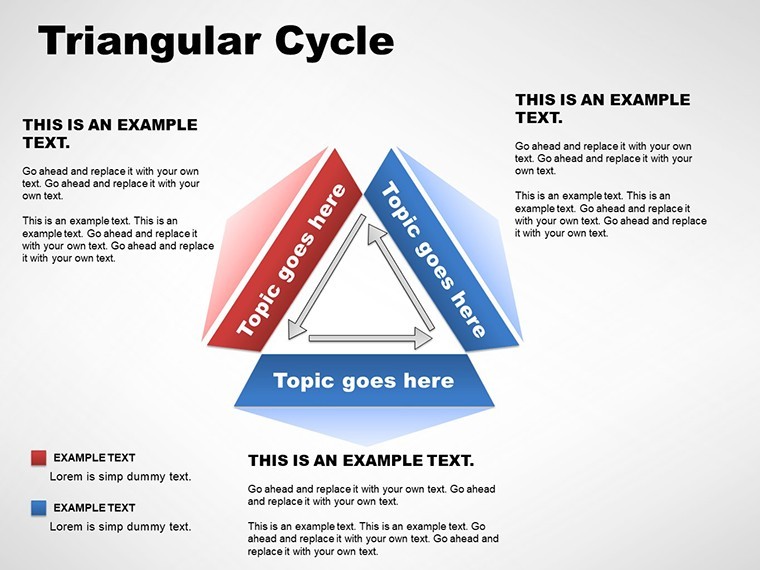
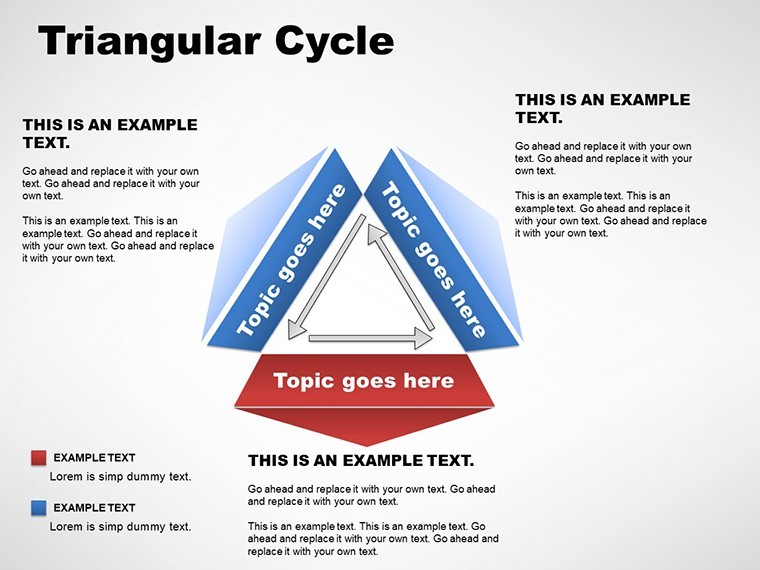
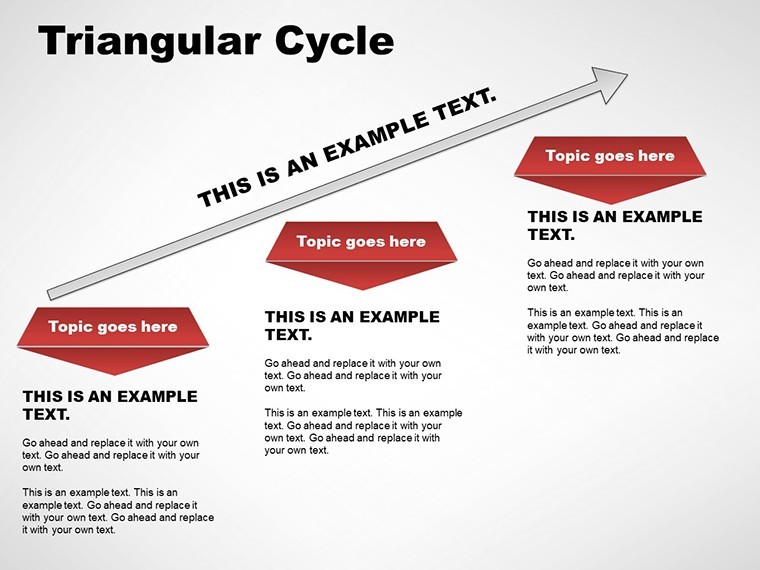
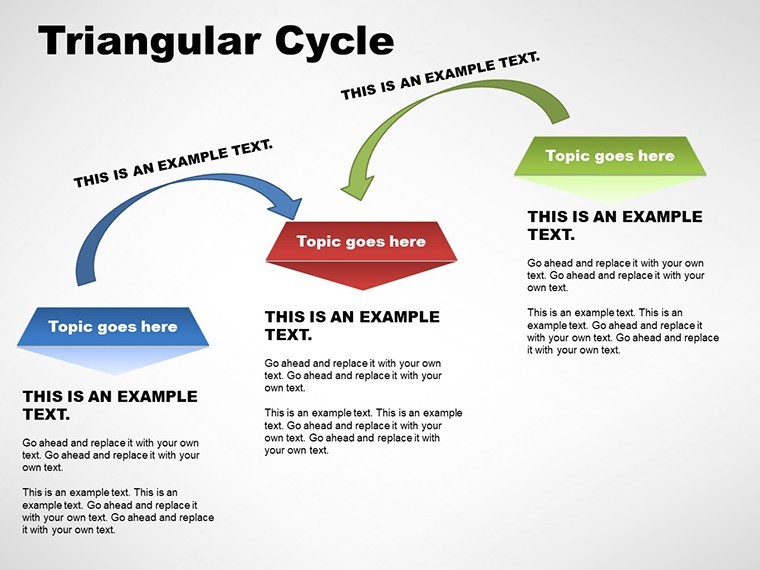
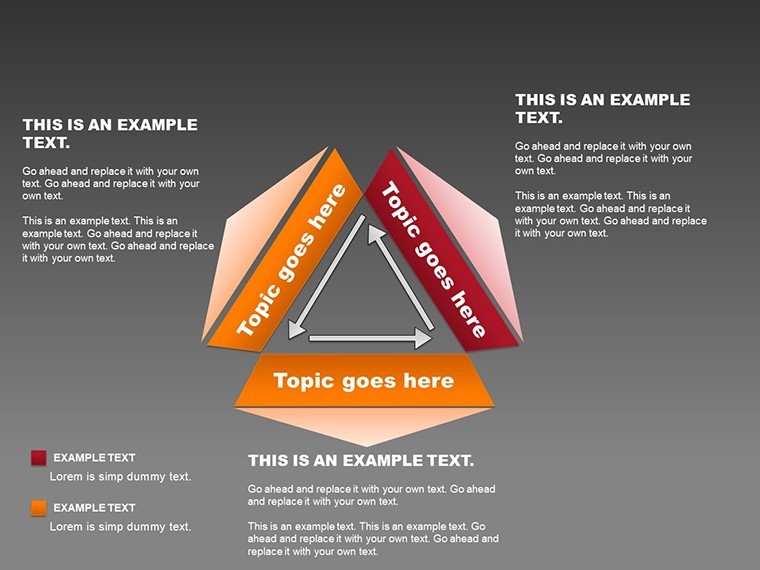
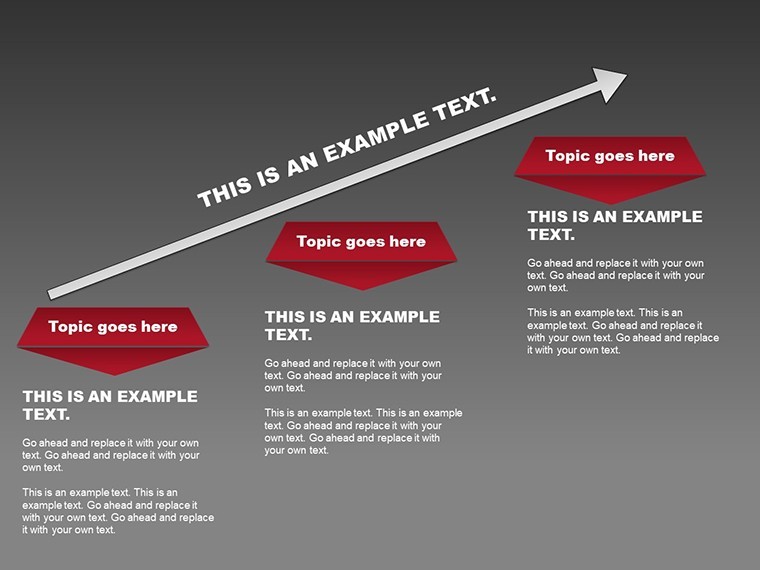
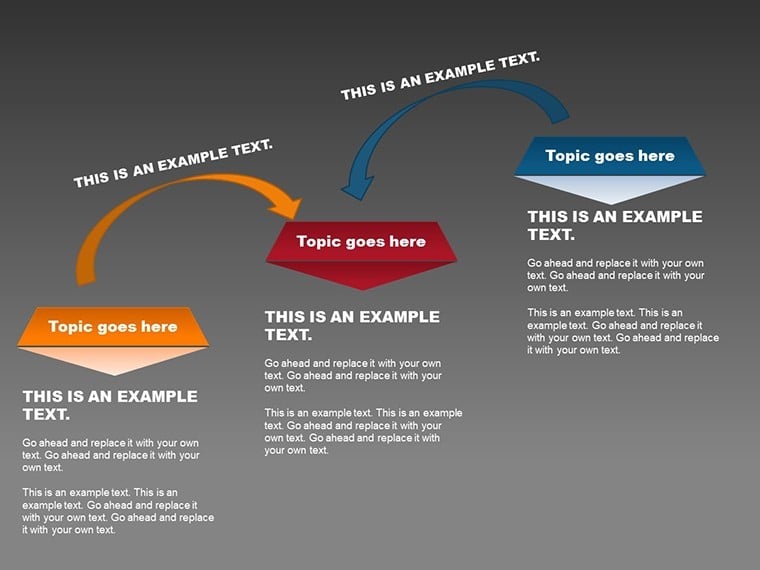
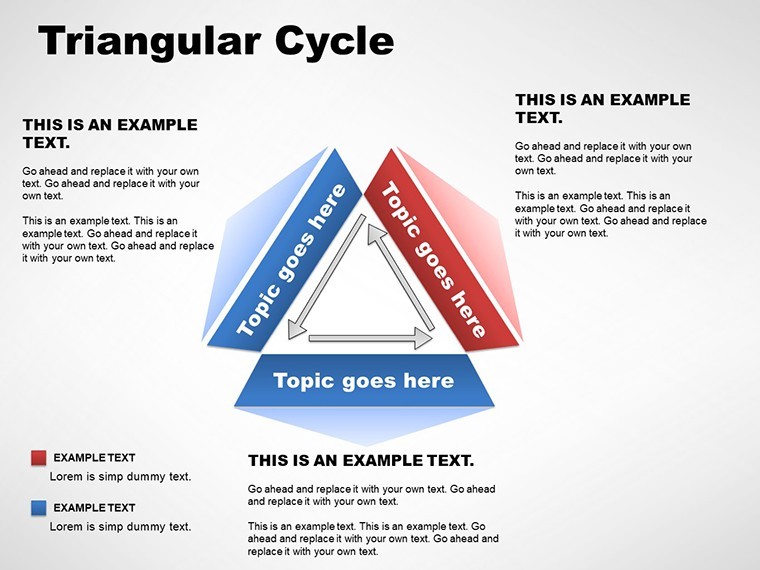
In the fast-paced realm of project management and business reporting, clarity is king. Our Triangular Cycle Keynote Charts template brings that clarity with 9 meticulously crafted, editable slides that go beyond basic three-indicator displays. Designed for professionals who need to illustrate work progress over time, this template lets you expand on core metrics by moving and copying objects effortlessly. Envision a team lead in a software development firm using these charts to map out sprint cycles: the triangular form symbolizes balance among time, resources, and output, with brief descriptions adding context. Educators might adapt it for teaching process flows in biology, like nutrient cycles, while marketers could track campaign phases from ideation to execution. Compatible with Keynote's .key and .kth formats, it ensures smooth integration into your existing workflow. This isn't merely a set of slides - it's a catalyst for better communication, helping you convey complex sequences in a visually intuitive way that resonates with stakeholders.
Delving into Triangular Design Dynamics
The beauty of triangular cycles lies in their inherent stability and directionality, making them perfect for depicting iterative processes. Unlike circular diagrams that can feel endless, triangles provide a sense of progression with defined points. This template leverages that by allowing expansions - start with three key indicators, then duplicate elements to include sub-steps or additional data layers. For instance, in agile methodologies, align vertices with plan, execute, review phases, incorporating metrics like velocity or burndown rates. Drawing from project management frameworks like PMI standards, these charts promote structured thinking without rigidity. The table-like integration adds a layer of organization, enabling side-by-side comparisons of cycles across periods. Users appreciate the drag-and-drop simplicity, which reduces design time and lets you focus on content. Whether presenting quarterly reviews or strategic plans, these visuals foster engagement, turning passive listeners into active participants.
Essential Features for Efficient Charting
- 9 Versatile Slides: Covering basic to advanced triangular configurations for varied complexity levels.
- Object Mobility: Freely move, copy, and resize elements to scale your cycles as needed.
- Integrated Tables: Combine cycles with tabular data for comprehensive overviews.
- Color Customization: Adapt palettes to brand guidelines or emphasize key phases.
- Text and Icon Flexibility: Add descriptions, arrows, or icons to enhance narrative flow.
- Animation Readiness: Built-in support for phased reveals, ideal for step-by-step walkthroughs.
These attributes ensure compliance with accessibility best practices, like sufficient contrast and logical reading order, boosting your presentation's professionalism.
Use Cases That Drive Real Results
Picture a manufacturing executive using this template to visualize supply chain cycles, with triangles highlighting procurement, production, and distribution - leading to optimized operations and cost savings. In education, instructors break down historical events into cause-effect-result triangles, aiding student comprehension. A startup founder might employ it for investor decks, showing growth trajectories from seed to scale. Real-world feedback from a consulting firm indicates these charts helped clarify client strategies, resulting in faster approvals. For nonprofit program evaluations, map impact cycles from funding to outcomes, demonstrating efficiency to donors. The template's adaptability shines in remote settings, where clear visuals bridge communication gaps. By solving common issues like vague progress reports, it empowers you to deliver insights that inspire action and alignment.
Step-by-Step Guide to Mastering Your Cycles
- Launch Keynote and import the template file.
- Choose a slide and input your primary indicators at the triangle vertices.
- Duplicate objects to add more details, adjusting positions for balance.
- Customize visuals using the format panel - alter lines, fills, and fonts.
- Test animations and transitions to ensure smooth delivery.
This process integrates seamlessly with data tools, allowing imports from project software like Asana for real-time accuracy.
The Edge of Choosing Triangular Cycles
Versus generic cycle diagrams, this template's triangular focus adds a unique angle - literally - for memorable presentations. It's backed by user trust, with high ratings reflecting its reliability. Ideal for collaborative environments, it supports version control and sharing. Elevate your strategy by adopting this tool, positioning your work as forward-thinking and precise.
Frequently Asked Questions
What makes triangular cycles better than circular ones?
Triangles offer a directed flow with clear start and end points, ideal for processes with distinct phases.
Can I expand beyond three indicators?
Yes, easily copy and modify objects to include more elements without losing structure.
Is animation support included?
Pre-configured for Keynote animations, enhancing dynamic storytelling.
Compatible with iPad Keynote?
Fully functional on iOS versions, for on-the-go editing.
How to import external data?
Paste from spreadsheets or link for updates, maintaining data integrity.
Good for
- Project roadmaps and sprint plans
- Product launch timelines
- Quarterly or annual review decks
- Company history and milestone summaries
Licence
reviews
Used these charts for a sales dashboard presentation.
The dark chart backgrounds looked nice on projector.
A few labels were too small.
Quick to edit in Keynote.
FAQ
Will it work in Google Slides?
Are fonts embedded?
Can I use this for client work?
What's the refund policy?
Do you update the template after purchase?
Similar templates
See all Keynote Charts →
All 9 slides