 Click to zoom
11-Period Cycle Keynote Charts: Master Architectural Trends and Data
| Format | .pptx |
| Slides | 27 unique layouts |
| Aspect ratio | 16:9 |
| Compatibility | PowerPoint |
| Animated | No |
| Language | English |
| License | Commercial |
| File size | — |
| Version | v1.0 |
| Last updated | February 2023 |
What's inside
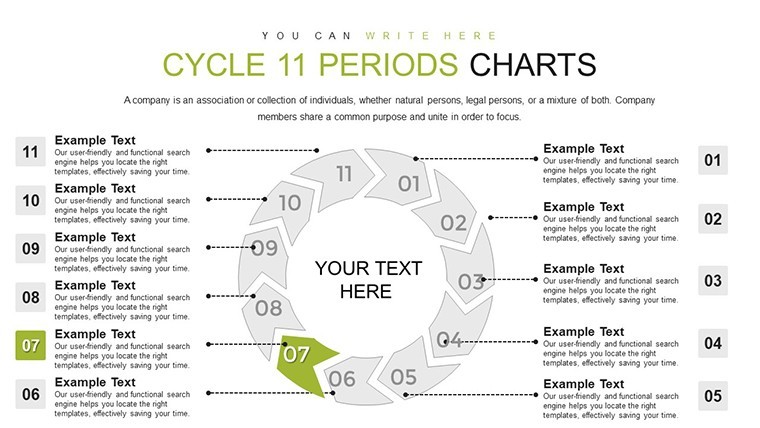
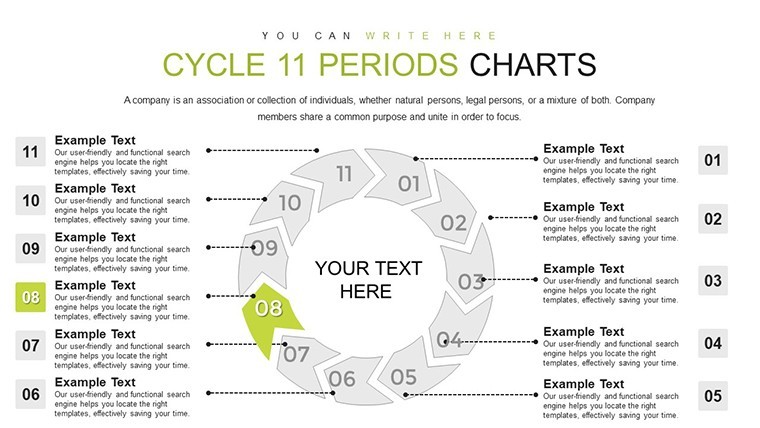
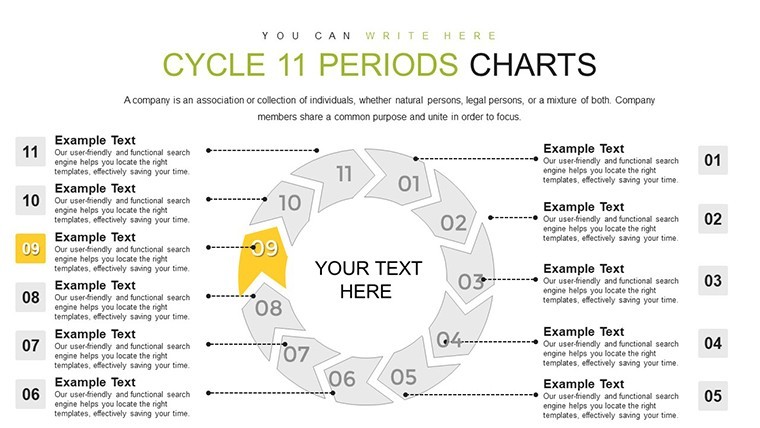
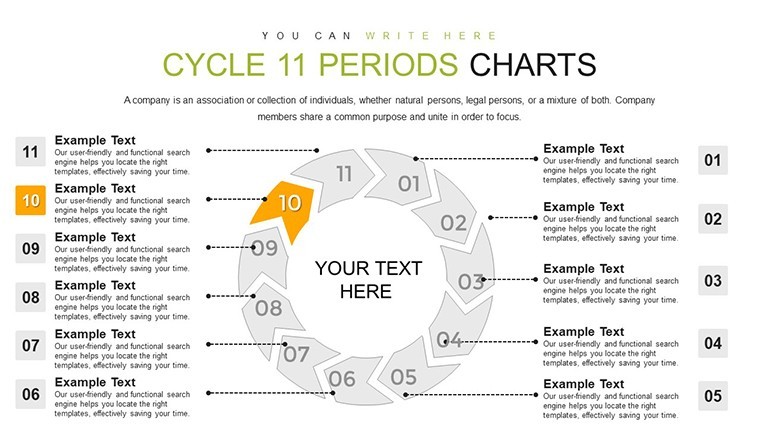
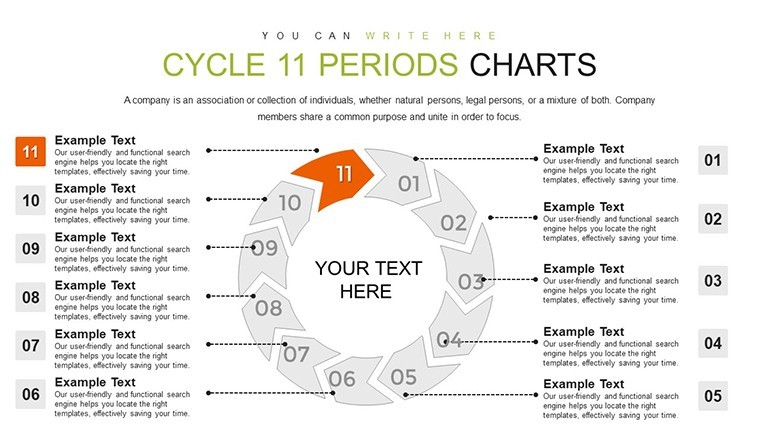
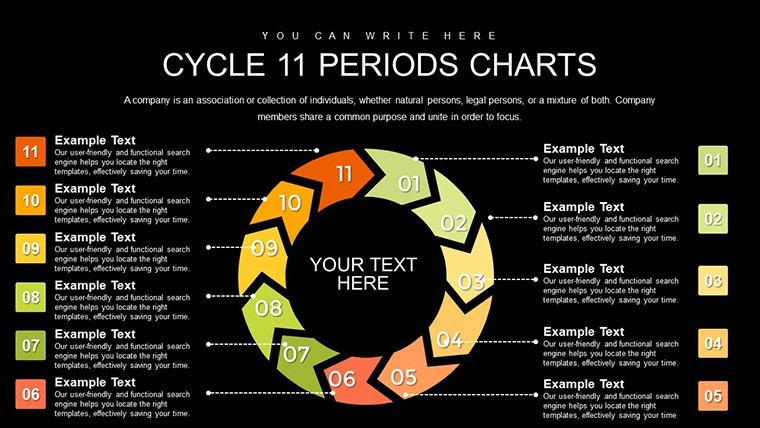
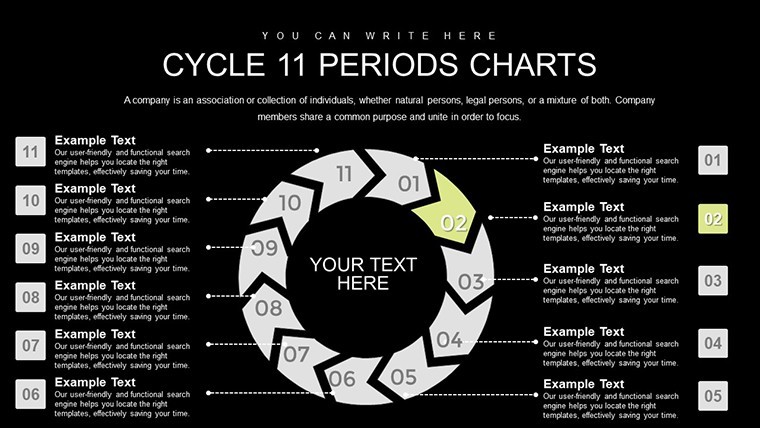
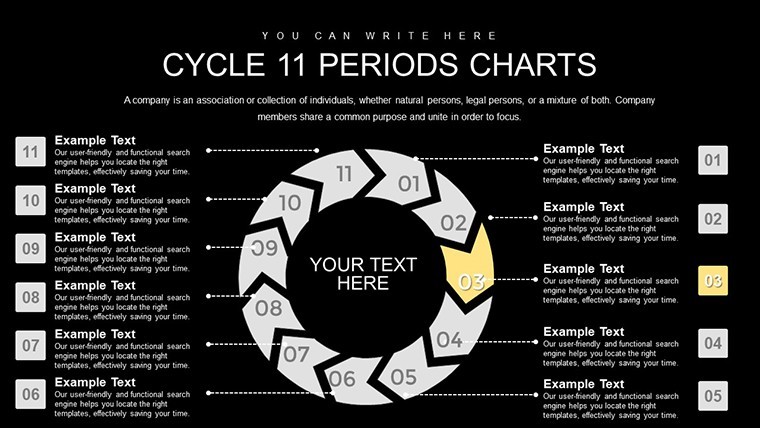
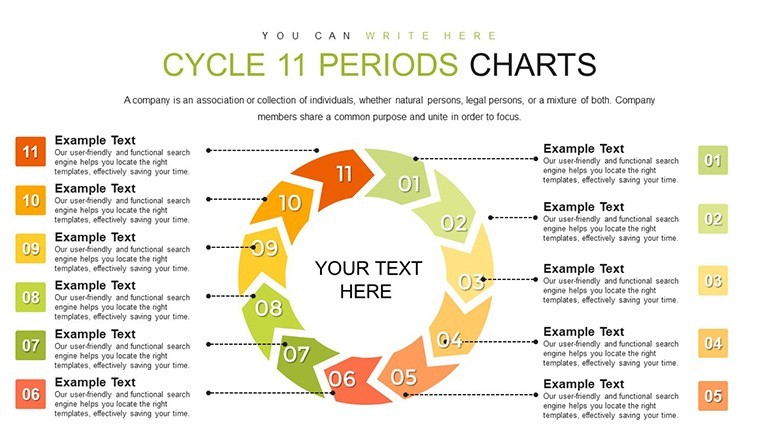
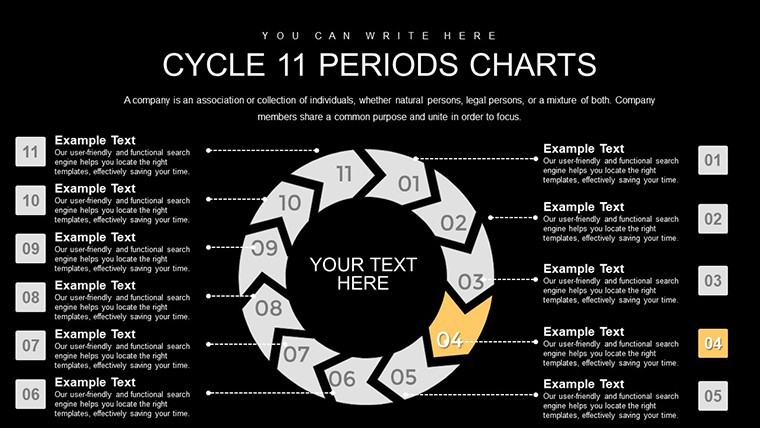
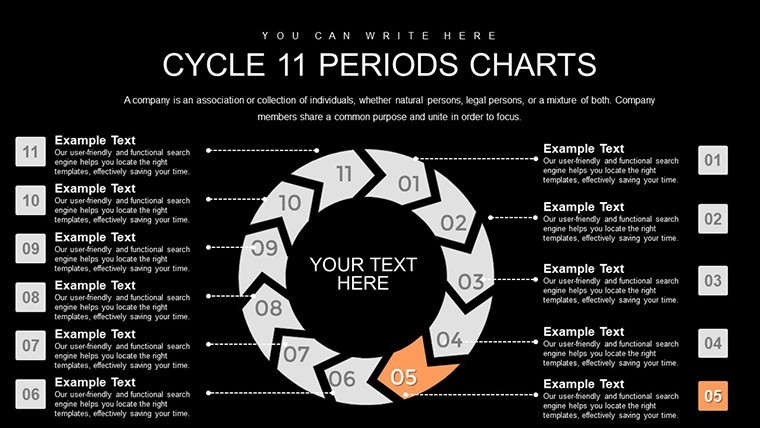
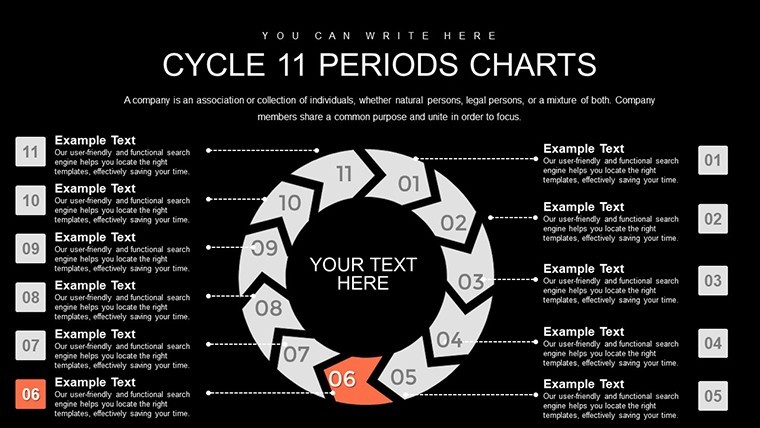
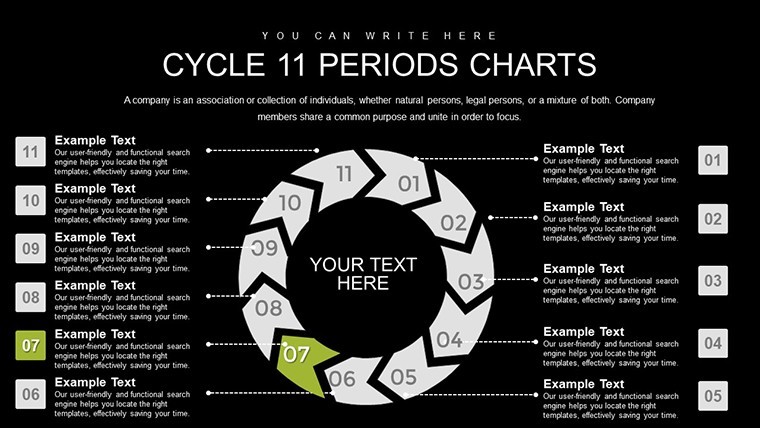
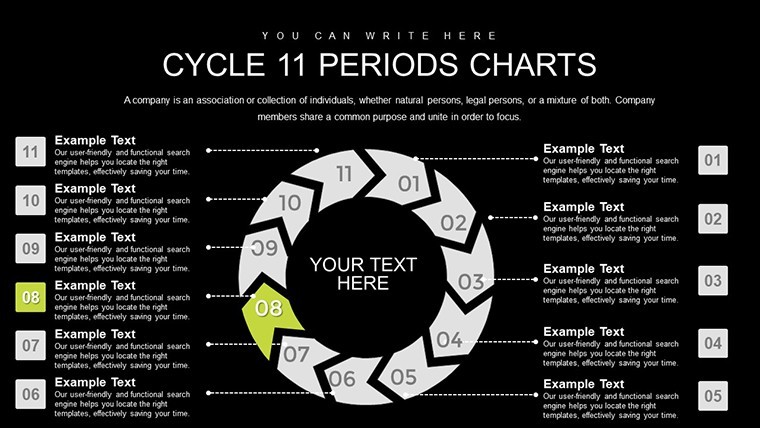
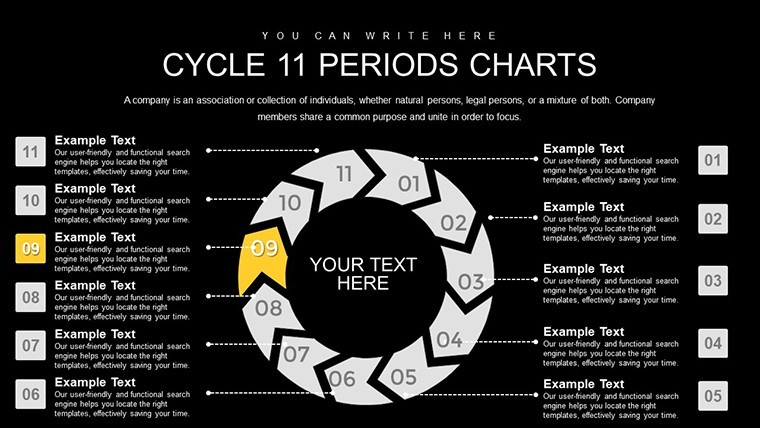
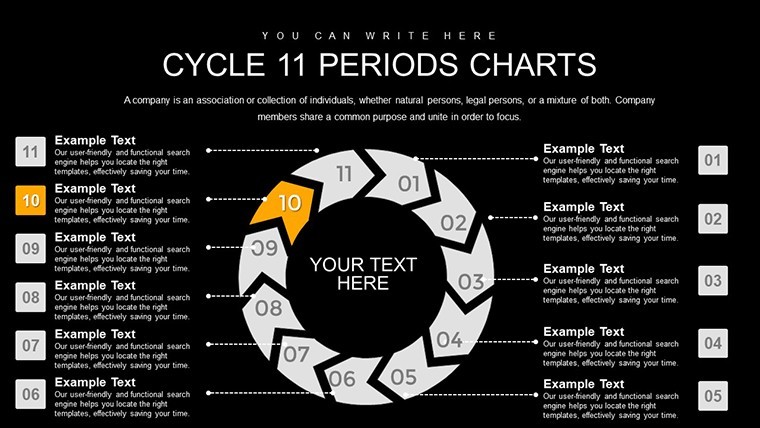
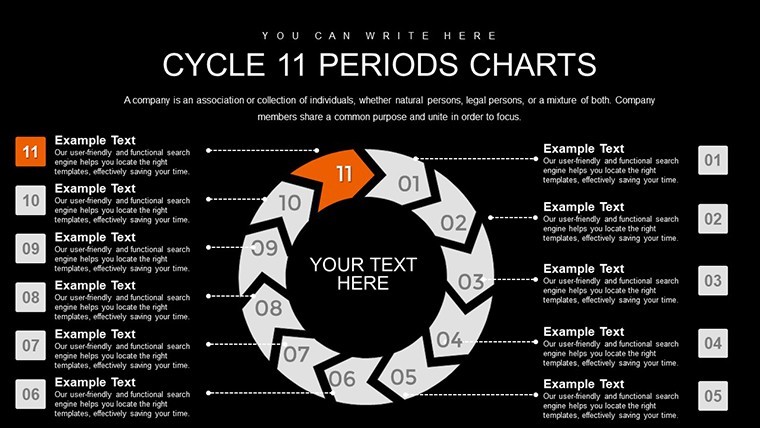
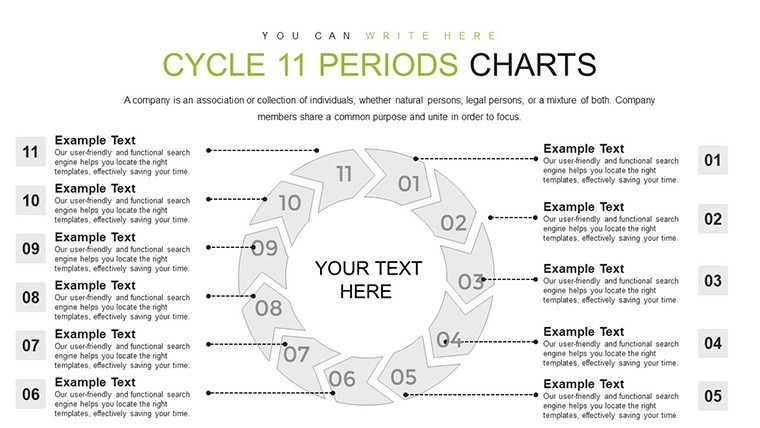
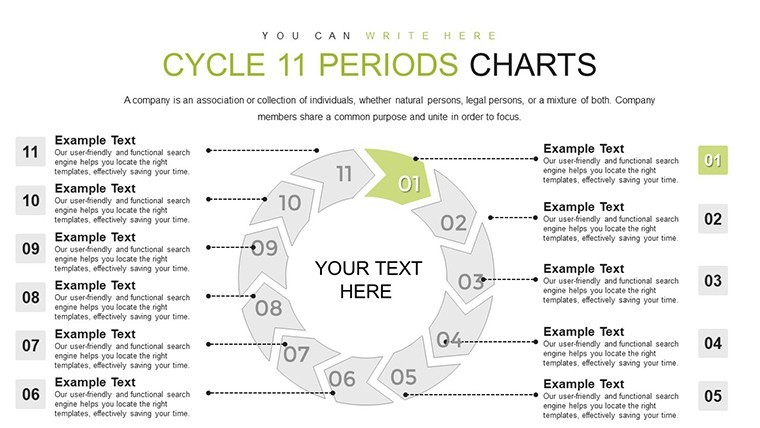
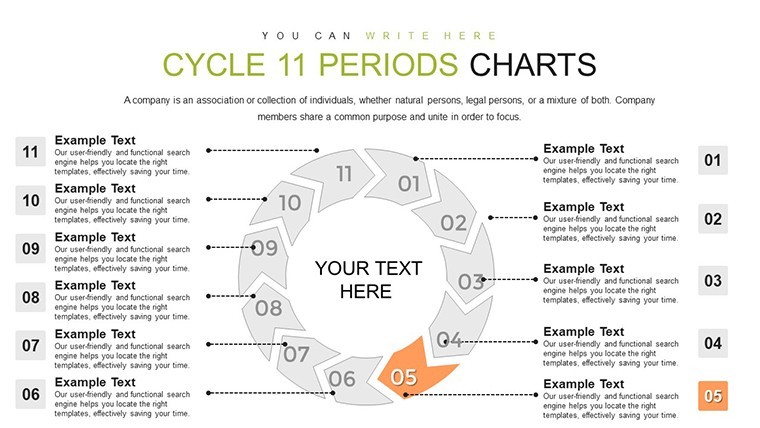
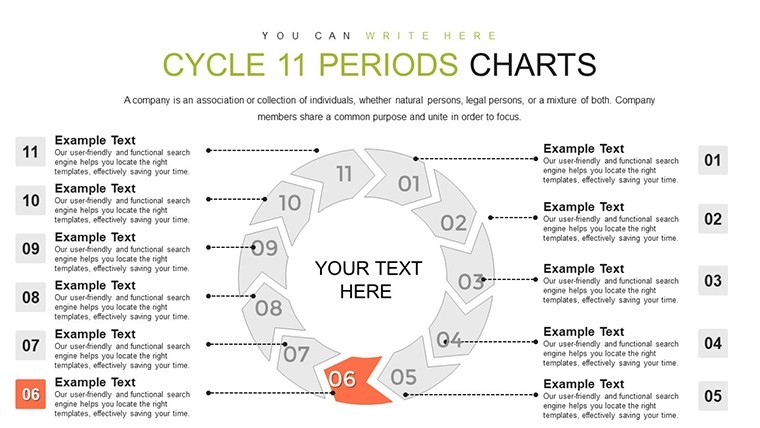
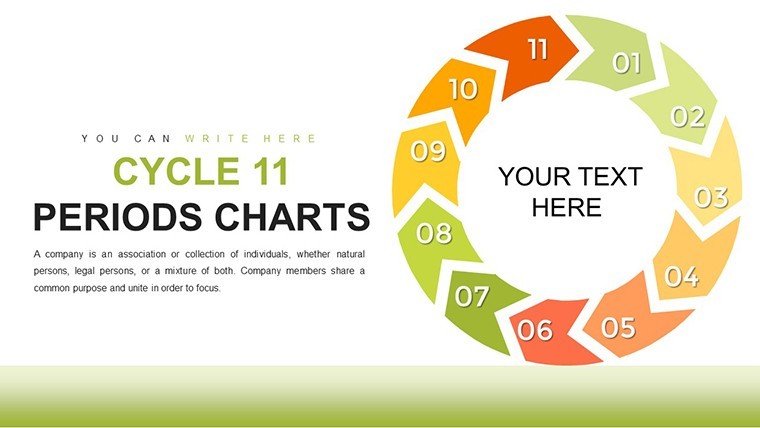
In architecture, trends shape the future - from evolving materials to shifting urban densities. Our 11-Period Cycle Keynote Charts template, with 27 editable slides including 20 pre-designed graphs, equips you to analyze and present these dynamics effortlessly. Suited for analysts and designers, it facilitates clear communication of sales trends, revenue patterns, or market shifts over 11 periods, like quarterly evolutions in green tech adoption.
Visualize a smart city proposal: Cycle through 11 stages of implementation, embedding data from sources like the World Green Building Council to underscore viability and innovation.
Core Features for Analytical Precision
Fully customizable charts ensure alignment with your vision, supporting real-time updates for agile responses.
- Pre-Designed Graph Variety: 20 options for displaying metrics like occupancy rates or material costs in 11-period loops.
- Branding Flexibility: Edit to reflect firm identity, incorporating elements from standards like those in the International Building Code.
- Clear Data Rendering: Simplified visuals accessible to all audiences, reducing complexity in stakeholder briefings.
- Dynamic Modifications: Update on-the-fly as new trends emerge, such as post-pandemic workspace redesigns.
Leveraging expertise from industry reports like Deloitte's architecture forecasts, these tools enhance authoritativeness in your deliverables.
Targeted Use Cases for Industry Leaders
Employ this in market trend analyses for hospitality architecture, cycling through 11 periods of demand fluctuations. Real examples include firms like SOM using similar charts in skyscraper feasibility studies, tracking economic indicators.
For marketers, it's invaluable in client reports on adaptive reuse trends, while analysts benefit from visualizing revenue cycles in firm performance reviews, aligning with PwC insights on sector growth.
Implementation Roadmap
- Launch the template in Keynote.
- Input your 11 periods with relevant data, e.g., "Market Research" to "Trend Forecasting."
- Customize graphs with architecture-themed colors and fonts.
- Incorporate updates and test for clarity.
- Present with confidence, backed by editable dynamism.
Superior to basic Keynote graphs, this offers depth for trend-heavy narratives, elevating beyond static displays.
Proven Benefits for Strategic Advantage
Gain clarity in conveying patterns, essential for investment pitches where 11-period cycles reveal long-term viability, per Harvard Business Review on data storytelling.
Integrate concepts like trend mapping, periodic analyses, or cyclical graphing organically for comprehensive coverage.
Elevate your insights - acquire these 11-period charts today and lead with data-driven design.
Frequently Asked Questions
How flexible are the graph modifications?
Highly, with real-time edits for evolving architectural trends.
Ideal for which audiences?
Stakeholders, investors, and teams needing clear trend visualizations.
Supports business metrics?
Yes, perfect for sales, revenue, and market data in design contexts.
Number of pre-designed charts?
20, within 27 total editable slides.
Compatible with updates?
Absolutely, for dynamic, adaptive presentations.
Export capabilities?
Includes options for sharing in multiple formats.
Good for
- Project roadmaps and sprint plans
- Product launch timelines
- Quarterly or annual review decks
- Company history and milestone summaries
Licence
reviews
Needed a quick data presentation for class and this worked right away.
The charts were readable even on a projector which helped a lot.
I did not use most of the fancy graphics but the basic slides were solid.
A few layouts looked too similar to each other honestly.
The blue color scheme looked calm and not too loud.
FAQ
Will it work in Google Slides?
Are fonts embedded?
Can I use this for client work?
What's the refund policy?
Do you update the template after purchase?
Similar templates
See all Keynote Charts →
All 27 slides