 Click to zoom
Speedometer PowerPoint Charts - Instant Download
| Format | .pptx |
| Slides | 12 unique layouts |
| Aspect ratio | 16:9 |
| Compatibility | PowerPoint |
| Animated | No |
| Language | English |
| License | Commercial |
| File size | — |
| Version | v1.0 |
| Last updated | March 2026 |
What's inside
Files and Formats Included
12 fully editable diagrams come in the download.
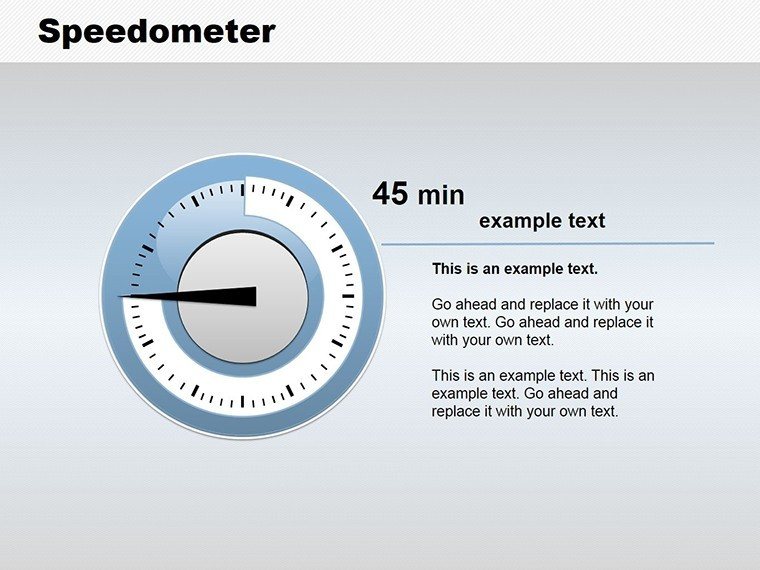
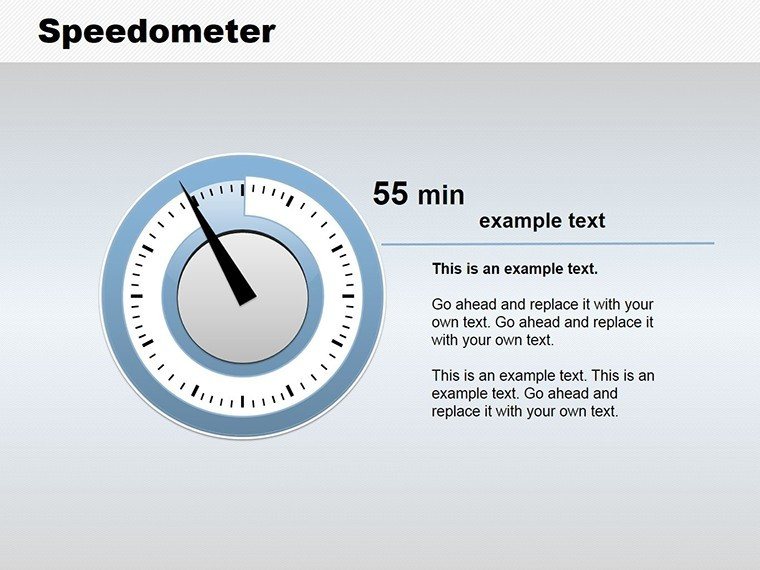
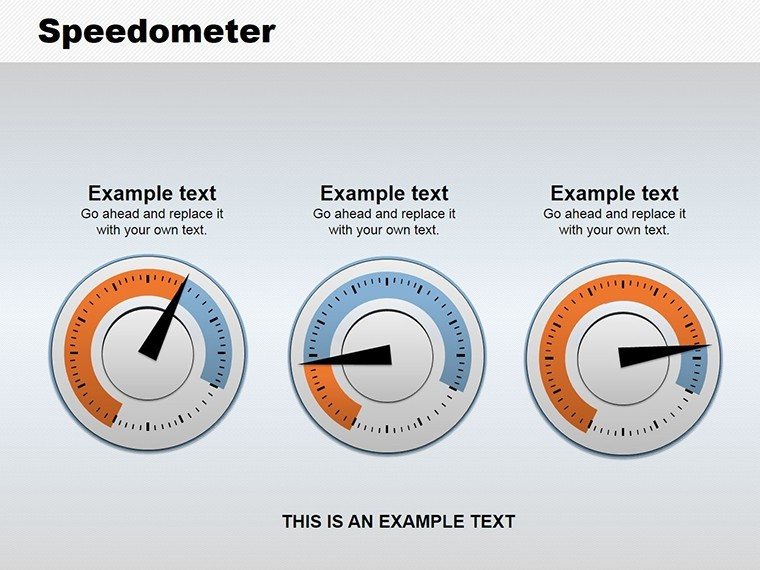
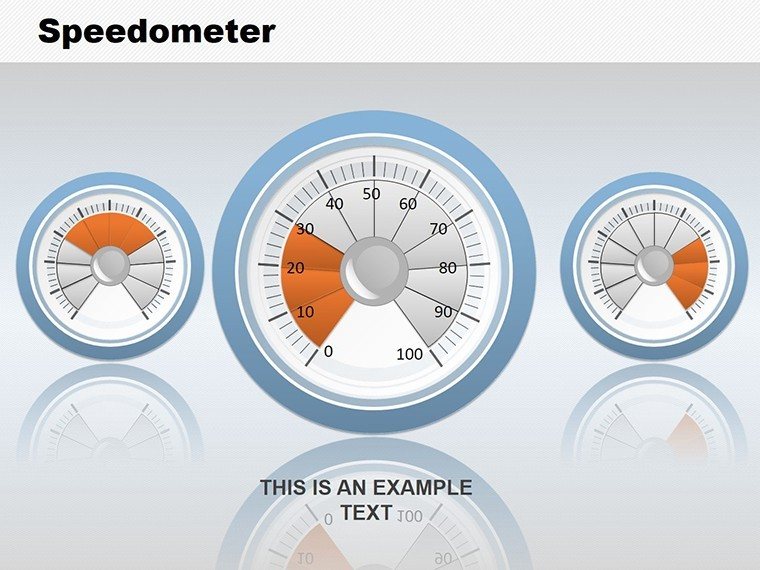
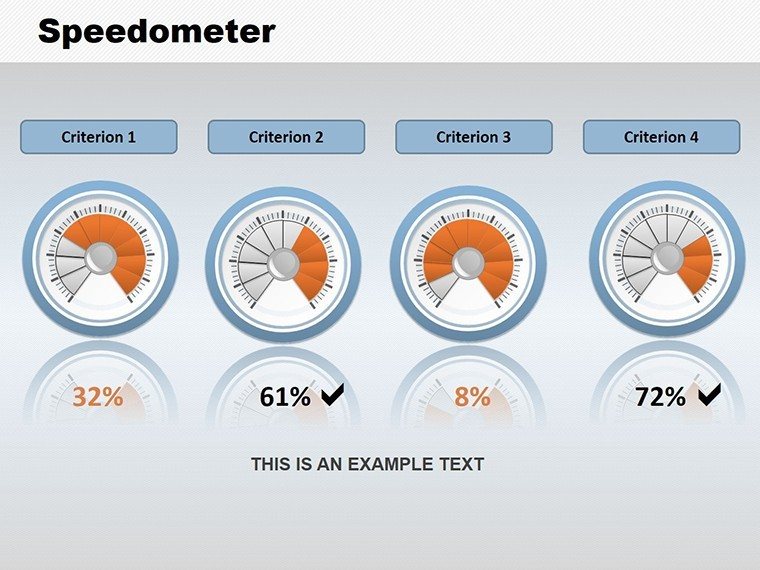
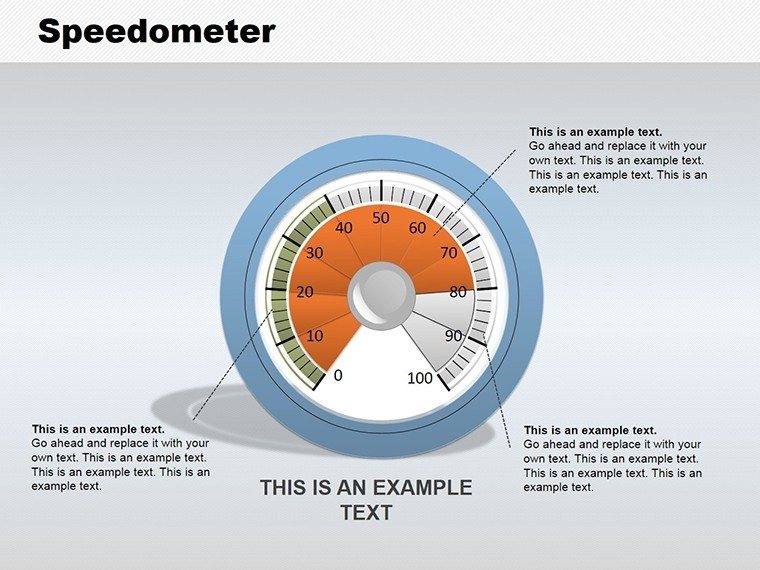
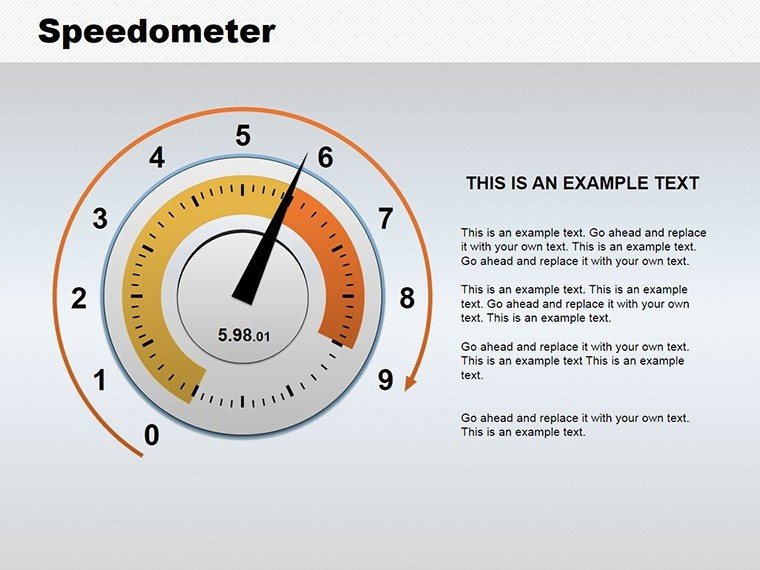
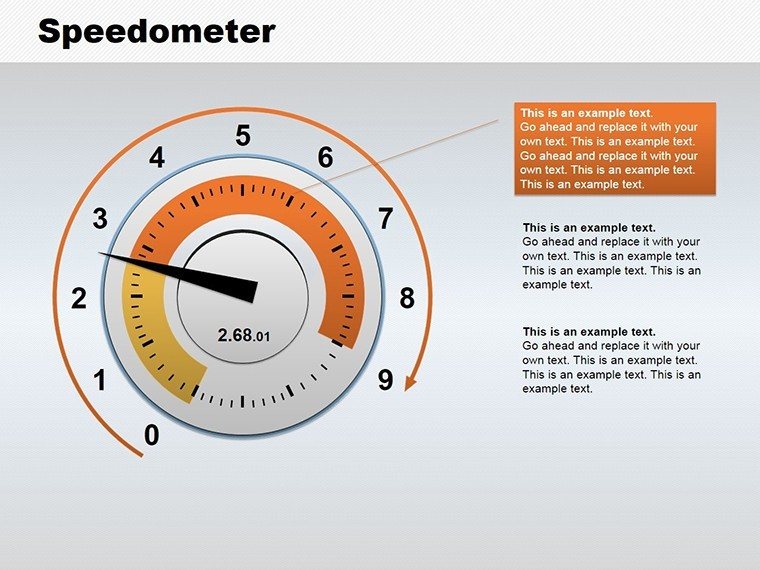
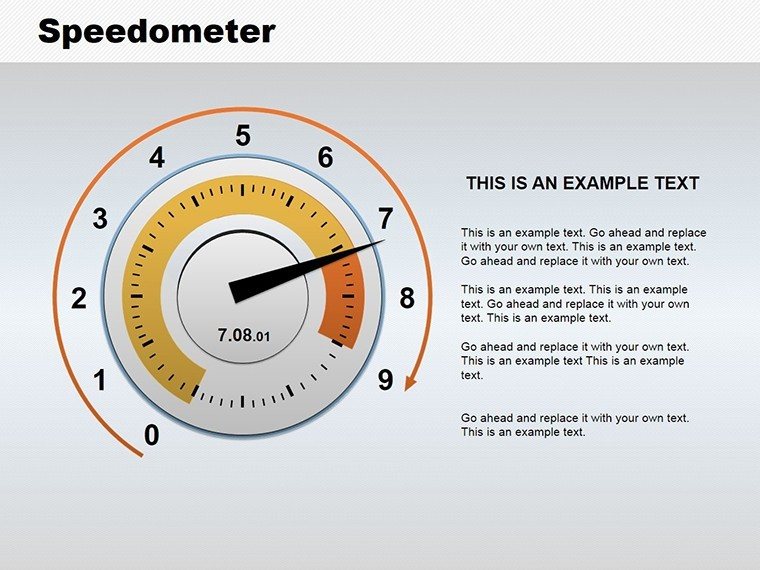
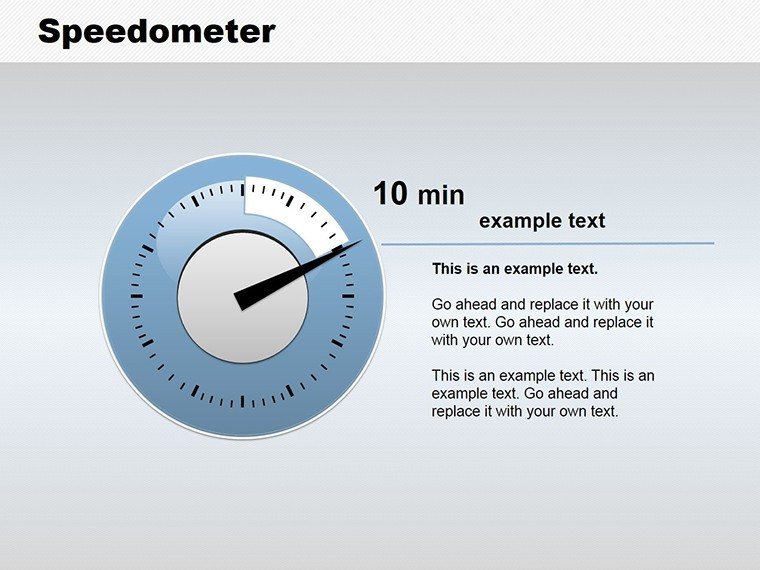
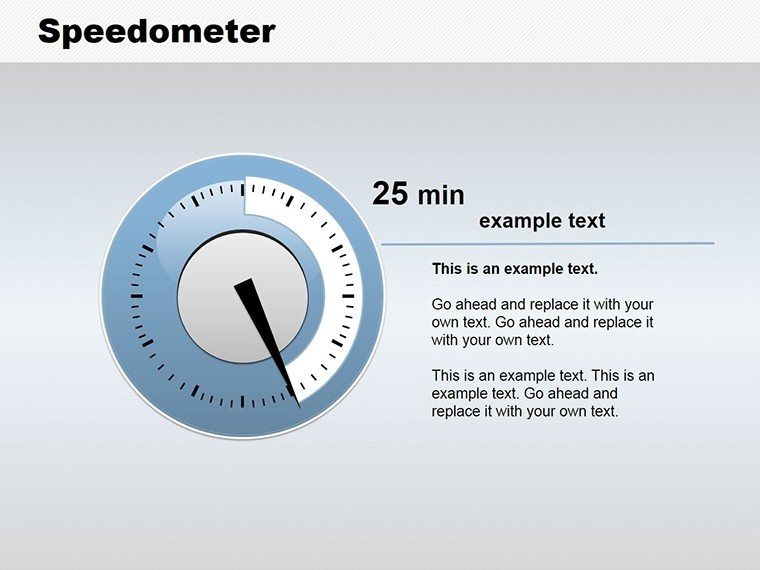
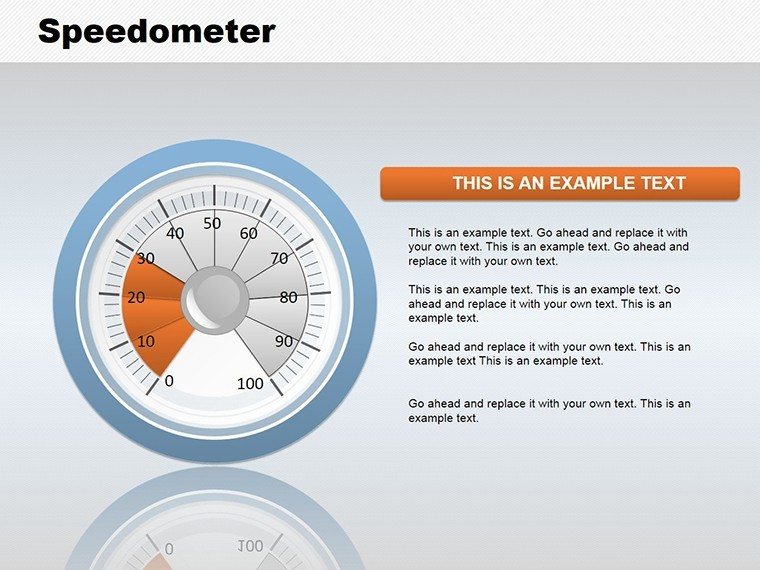
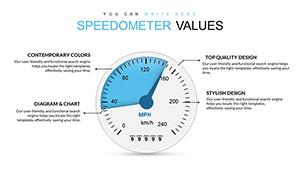
Each speedometer gauge displays performance metrics at a glance.
These support KPI tracking in one view during quarterly reviews.
The gauge approach sets it apart from static diagrams by providing immediate visual feedback on targets. This enables clear communication in board meetings where performance matters most.
Zone segmentation uses color contrast for flow direction.
Technical Specs
FeatureDetailsEditable shapesneedle and zones resize and recolor independentlyText placeholderslabels update across all twelve slides instantlyColor theme adjustmentsslide master palette applies to all gaugesDiagram connectorspointer lines adjust in directionIcon layersicons replaceable in gauge areasExport options.pptx for editing or PDF for distributionFrom Download to Final Deck
The workflow takes under 12 minutes for moderate skill users.
- Open the .pptx file in PowerPoint (1 minute)
- Replace placeholder text with your content (3 minutes)
- Adjust brand colors via the slide master (2 minutes)
- Edit diagram labels and connectors (4 minutes)
- Export as PPTX or PDF (1 minute)
Editing difficulty: Moderate.
Three Situations Where This Pays Off
Executive in Sales
An executive at a sales company tracked attainment in a board meeting. The speedometers clarified progress at a glance. Deck preparation dropped from 3 hours to 45 minutes.
Operations Manager in Manufacturing
An operations manager reused the gauges across three reports. The file supported operational targets with color swaps only.
Consultants often pair these diagrams with a petal visualization slide when structuring multi-tier strategy decks. Teams in sales presentations combine it with a sphere segmentation diagram for investor decks.
Explore additional options in the pie powerpoint chart templates category.
Download the Engaging Speedometer PowerPoint Charts Template
What You'd Need to Replicate This Yourself
Building equivalent speedometer gauges from scratch takes over 90 minutes per slide. Manual alignment of zones often leads to misaligned pointers on projection screens. This template provides ready structures so users focus on data only.
Needle sits in zoned areas with color contrast. That placement maintains readability during live meetings without adding editing complexity.
The cost of not using a template includes lost time and inconsistent visual hierarchy in business presentations.
Download Now and Present with Confidence
Which PowerPoint versions are compatible?The PPTX file opens in PowerPoint 2016, 2019 and Microsoft 365 on Windows and Mac systems. Slide master access works fully in all listed versions. Users on older versions may need to update for full color theme adjustments. The file format compatibility ensures no conversion issues during editing.
How do I change the color scheme?Open the slide master view in PowerPoint. Select the color palette and update the theme colors. The changes apply automatically to all twelve speedometer diagrams. Save the file and the new scheme appears in every slide.
What license is included?The purchase allows use in client work and internal business presentations. Resale or sublicensing of the template itself is not permitted. The license covers unlimited projects within one organization. Download once and apply across multiple decks.
Is there a free version?No free version is listed on the page. The paid download provides the complete set of 12 speedometer diagrams in PPTX format. All editable elements and connectors are included. This single purchase covers the full package.
What file formats are provided?The download contains a single PPTX file. It opens directly in PowerPoint for editing. PDF export is possible after customization. No additional formats like JPG are included.
Good for
- Project roadmaps and sprint plans
- Product launch timelines
- Quarterly or annual review decks
- Company history and milestone summaries
Licence
reviews
The chart pages helped me finish my sales presentation before the deadline.
Everything was easy to drag around without breaking the layout.
I liked the clean arrows and simple structure.
A couple slides looked almost identical but I still used them.
Good enough for work stuff.
FAQ
Will it work in Google Slides?
Are fonts embedded?
Can I use this for client work?
What's the refund policy?
Do you update the template after purchase?
Similar templates
See all PowerPoint Charts →
All 12 slides