 Click to zoom
Pie Financial Report Charts for Architecture Firm Budgets in PowerPoint
| Format | .pptx |
| Slides | 27 unique layouts |
| Aspect ratio | 16:9 |
| Compatibility | PowerPoint |
| Animated | No |
| Language | English |
| License | Commercial |
| File size | — |
| Version | v1.0 |
| Last updated | August 2023 |
What's inside
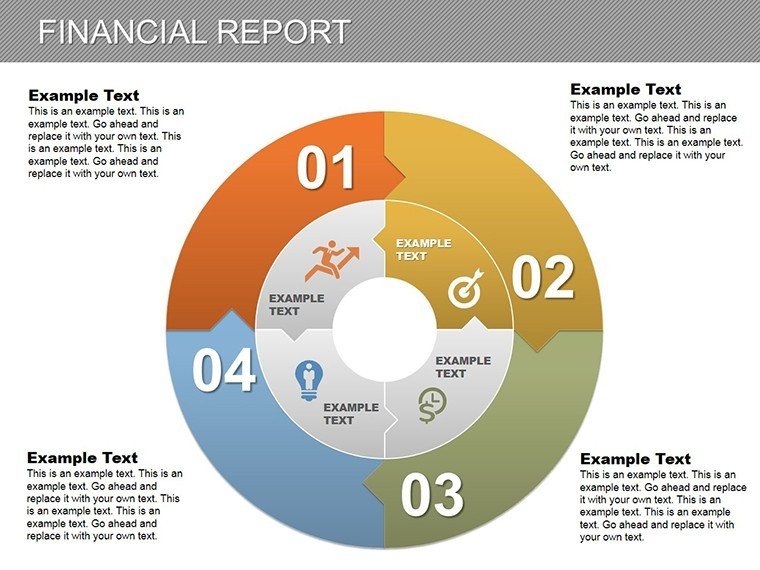
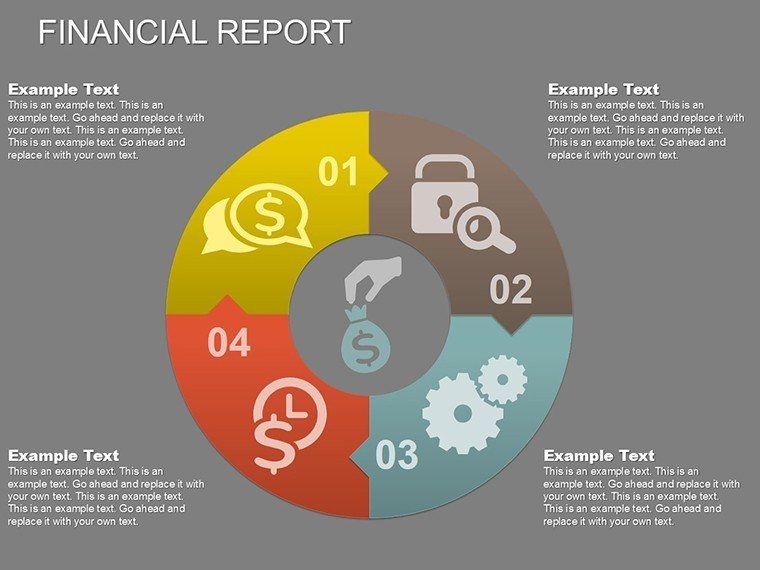
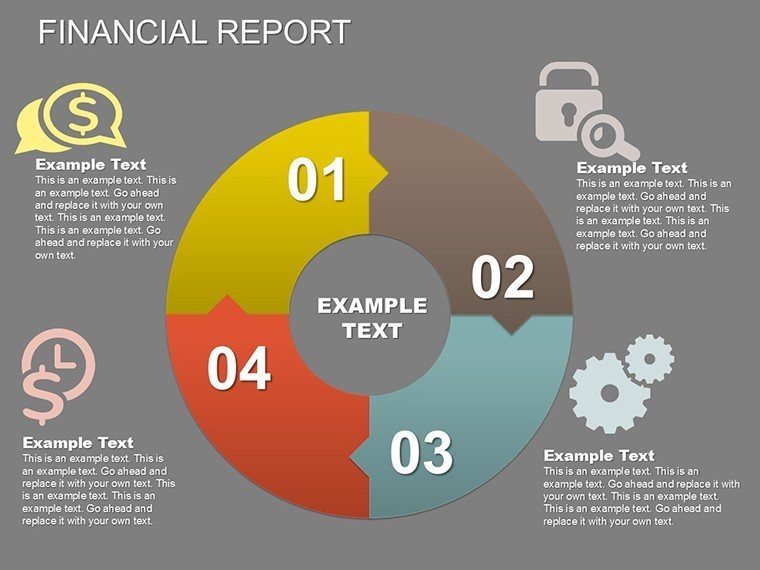
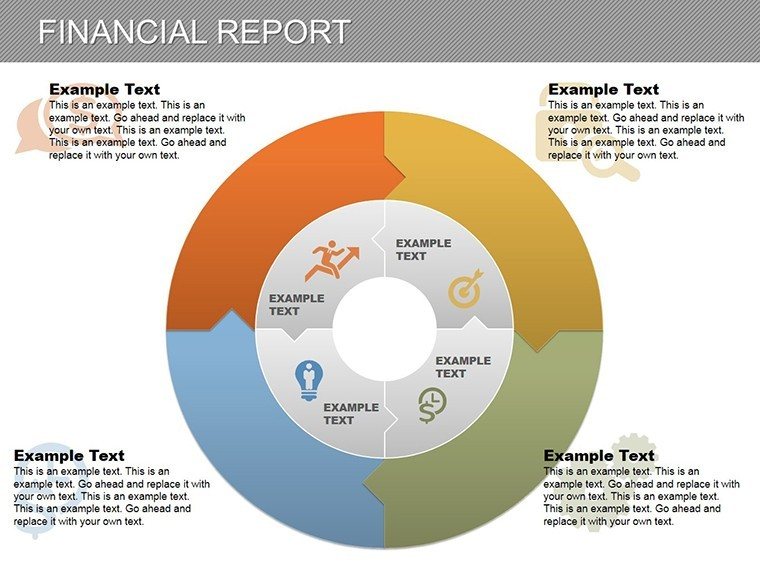
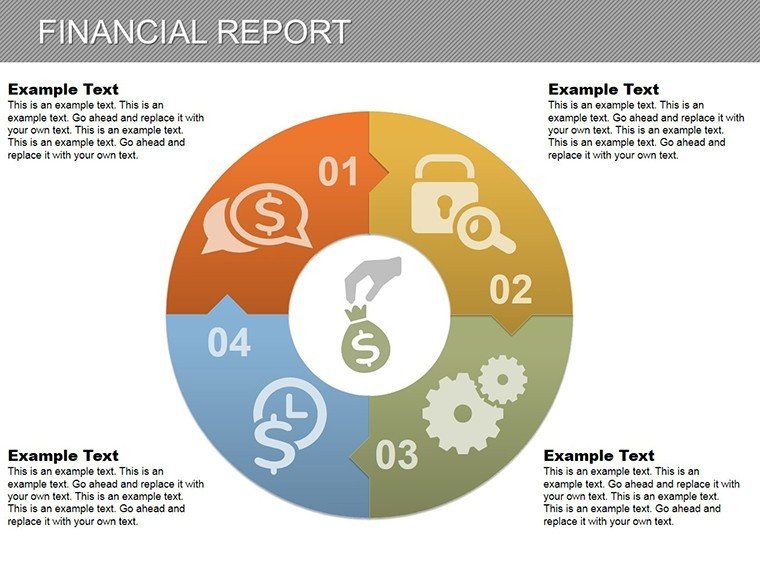
Financial transparency isn't just a checkbox for architecture firms - it's the foundation of trust in every bid, bond, and balance sheet. Our Pie Financial Report PowerPoint Charts template slices through the opacity with 27 editable slides, serving up pie visuals that portion out project economics with surgical precision. Geared toward principals forecasting firm health or associates justifying material markups, it adheres to GAAP principles while dazzling with design-forward aesthetics that echo the poise of a well-proportioned elevation.
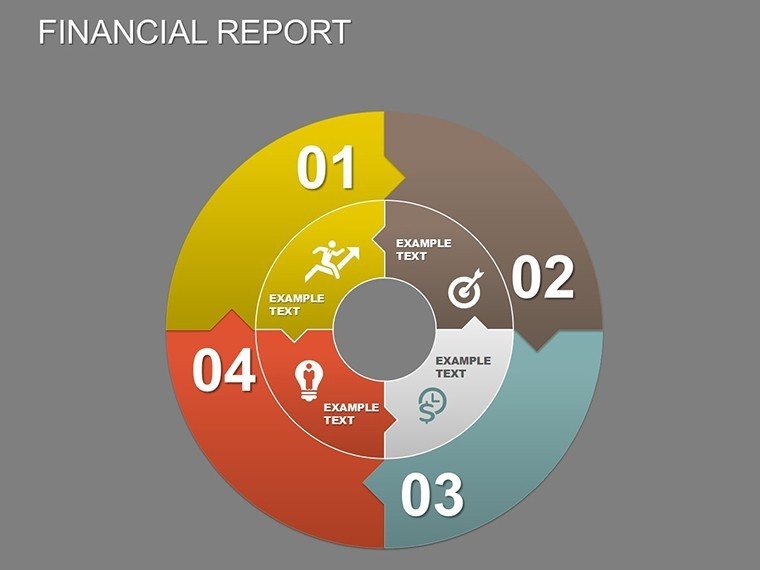
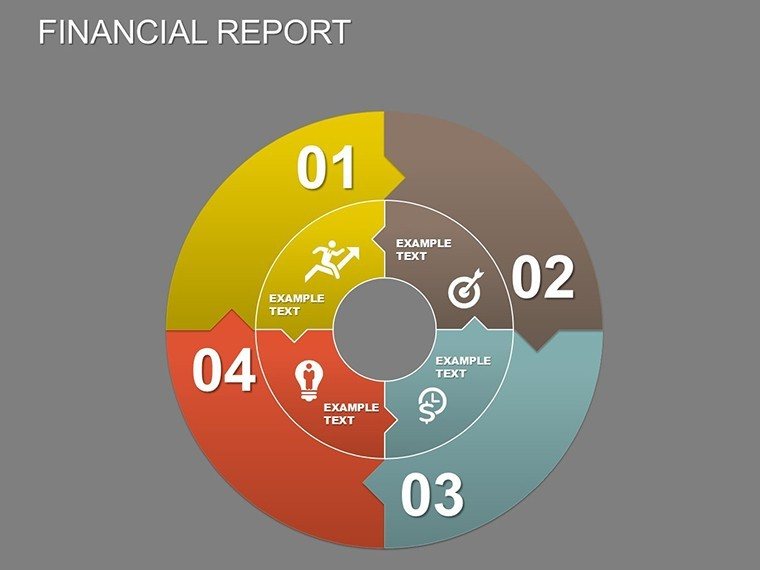
Envision pies that segment overruns like a deconstructed Corbusier module: Core slices for hard costs (45%), soft (30%), contingencies (15%), and profits (10%), each exploding into sub-charts on demand. Rooted in real fiscal feats, like the cost controls behind the Burj Khalifa's ascent, this template turns ledgers into legends. Effortlessly bridging PowerPoint and Google Slides, it facilitates firm-wide reviews, eradicating the dread of "death by spreadsheet" in partner meetings.
Slicing Smart: Core Features of the Pie Financial Template
Precision pie-crafting defines this deck, where every wedge whispers wisdom. The 27 slides span radial reports to exploded views, all infinitely tweakable for your fiscal fingerprint.
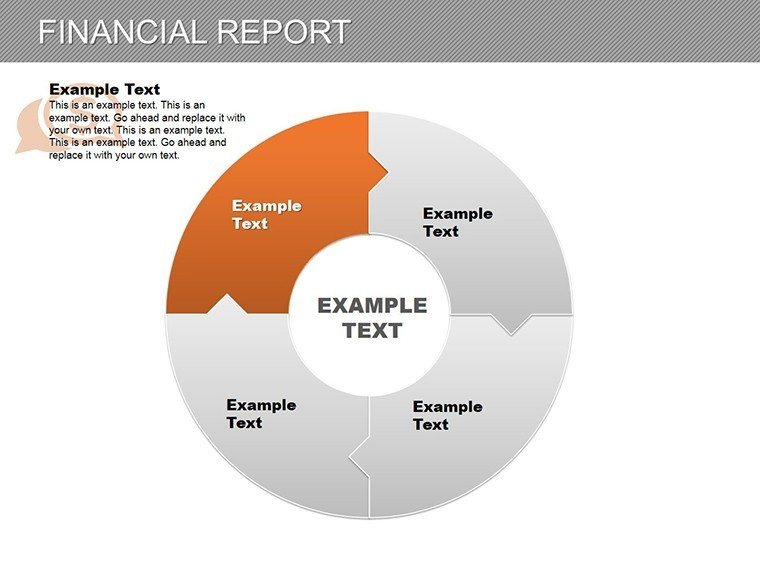
- Explosive Segmentations: Click-to-expand pies unveiling line-item details, e.g., glazing vs. framing within envelope budgets.
- Palette Precision: Custom swatches for fiscal conservatism - cool blues for audits, warm ambers for growth projections.
- Formula-Friendly: Embedded SUMIF links to pasted tables, auto-refreshing as bids evolve.
- Layout Lexicon: Four formats: concentric for nested costs, offset for comparisons, ensuring versatility from solo gigs to mega-masters.
It addresses the audit anxiety plaguing 55% of practices (AICPA stats), arming you with visuals that validate variances and valorize your stewardship.
Portfolio of Pies: Architectural Finance Scenarios Unveiled
Boardroom battle for a cultural center commission? Harness slide 20's comparative pies, pitting your lean bid against competitors, with wedges widening on revenue streams - mirroring the fiscal finesse of the Sydney Opera House's turnaround. For forensic accounting in disputes, donut pies hollow out disputes, filling with arbitration evidence.
In pro forma prep, layered pies dissect equity infusions, a tactic akin to Gehry's parametric budgeting. Insider hack: Slide 7's shadow effects add depth to deficit discussions, softening blows with subtle sophistication.
- Annual Firm Audits: Pie progress toward billable targets, slicing by sector - healthcare (40%), education (35%).
- Investor Roadshows: Radial reports radiating ROI potentials, captivating VCs with visual velocity.
- Grant Applications: Google Slides pies for collaborative grant narratives in nonprofit builds.
- Tax Season Teasers: Mini-pies previewing deductions, easing the end-of-year exhale.
Eclipsing generic Excel exports, which pie poorly, this template portions professionalism.
Whipping Up Wedges: Customization and Fiscal Flow Tips
Like kneading dough for a perfect crust, refine your pies: Dial legends via Format Shape for legibility in low-light lounges, or gradient-fill for trend gradients over quarters. Inject wit with labels like "The Cherry on Top: Incentives," thawing frozen finances. Fuse with QuickBooks via ODBC for live pulls, making your deck a dashboard darling.
Bolster credibility with FASB footnotes in tooltips, framing you as the fiscal foreman. Deliverables? Animated GIFs for email blasts or accessible WCAG-compliant exports.
The Pie That Paid Off: A Firm's Fiscal Fairy Tale
Echoing through Vertex Architects in Boston, CFO Lila Chen pied her way to a $20M equity round, segmenting scalability with surgical slices. Verdict? Expansion unlocked, featured in ENR. A testament to templated triumphs.
Carve your fiscal future - Acquire the Pie Financial Report PowerPoint Charts template at once and portion out prosperity, one perfect pie at a time.
Frequently Asked Questions (FAQs)
Are pie charts rescalable for varying budget magnitudes?
Yes, logarithmic options auto-adjust, handling from $10K renovations to $100M towers.
Can I incorporate architectural cost codes like CSI divisions?
Seamlessly - map wedges to MasterFormat, with drill-downs for spec-level granularity.
How to export pies for non-PowerPoint financial software?
Vector PDFs or EMFs preserve fidelity for Procore or Sage imports.
Is it suitable for international architecture firms with multi-currency?
Indeed; toggle currencies and exchange rates via linked cells for global gloss.
What's the accessibility for color-blind reviewers?
Pattern fills and high-contrast modes ensure inclusivity per ADA standards.
How does it handle sensitivity for confidential financial data?
Password-protect slides or use view-only shares, safeguarding secrets.
Good for
- Project roadmaps and sprint plans
- Product launch timelines
- Quarterly or annual review decks
- Company history and milestone summaries
Licence
reviews
The chart placeholders made editing really fast.
I needed something basic for an internal office report and this was enough.
A few icons looked random but nothing serious.
The colors printed surprisingly well.
I appreciated the simple layout because my old presentations always look messy.
FAQ
Will it work in Google Slides?
Are fonts embedded?
Can I use this for client work?
What's the refund policy?
Do you update the template after purchase?
Similar templates
See all PowerPoint Charts →
All 27 slides