 Click to zoom
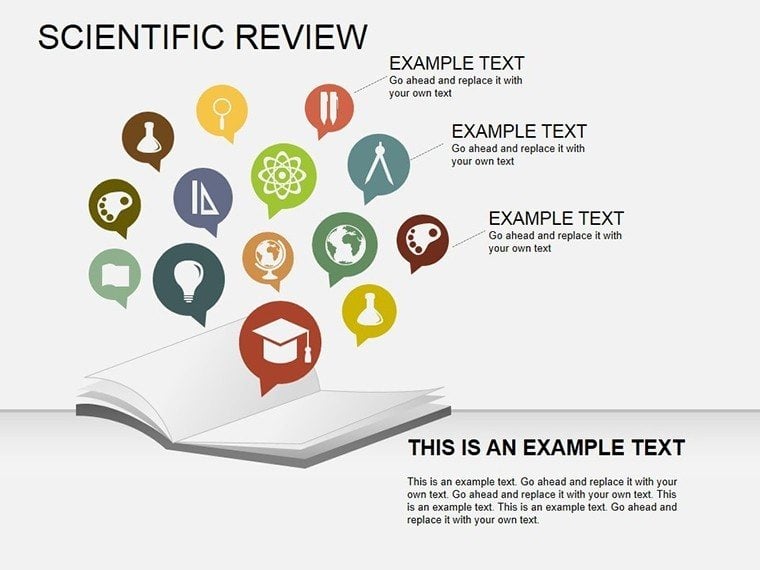
Scientific Review PowerPoint Diagrams: Illuminate Insights with Elegant Precision
| Format | .pptx |
| Slides | 14 unique layouts |
| Aspect ratio | 16:9 |
| Compatibility | PowerPoint |
| Animated | No |
| Language | English |
| License | Commercial |
| File size | — |
| Version | v1.0 |
| Last updated | May 2024 |
What's inside
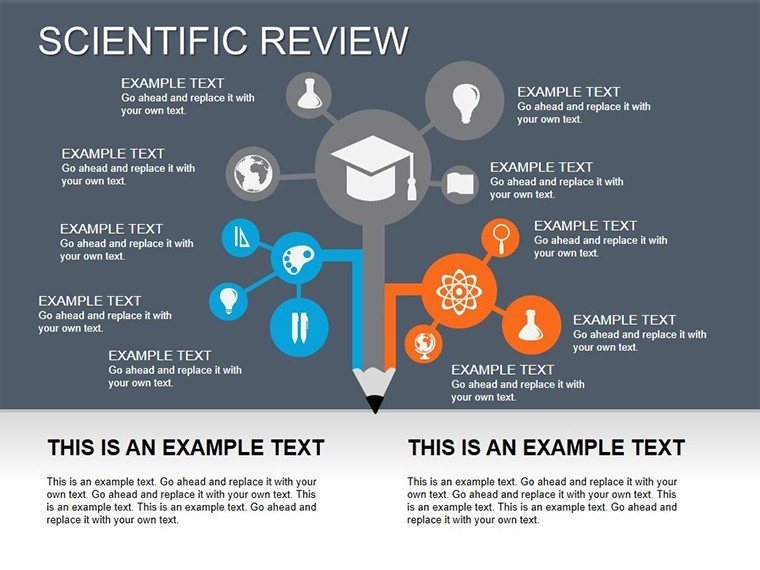
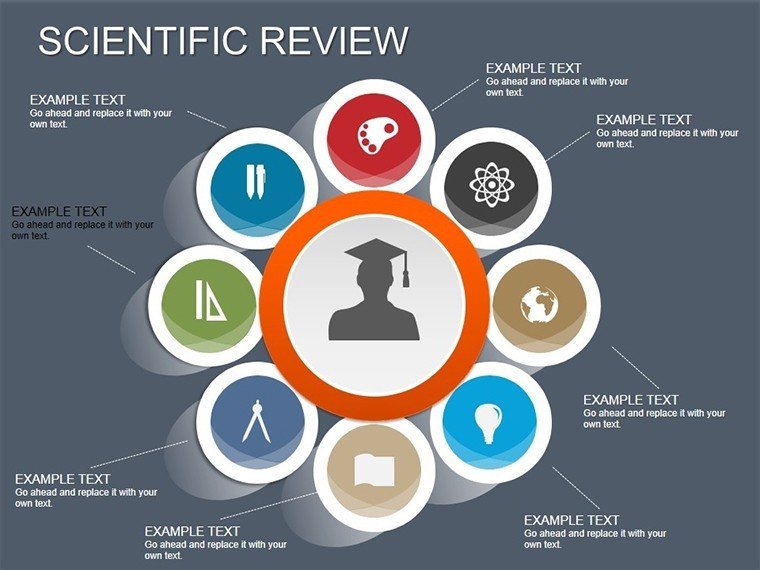
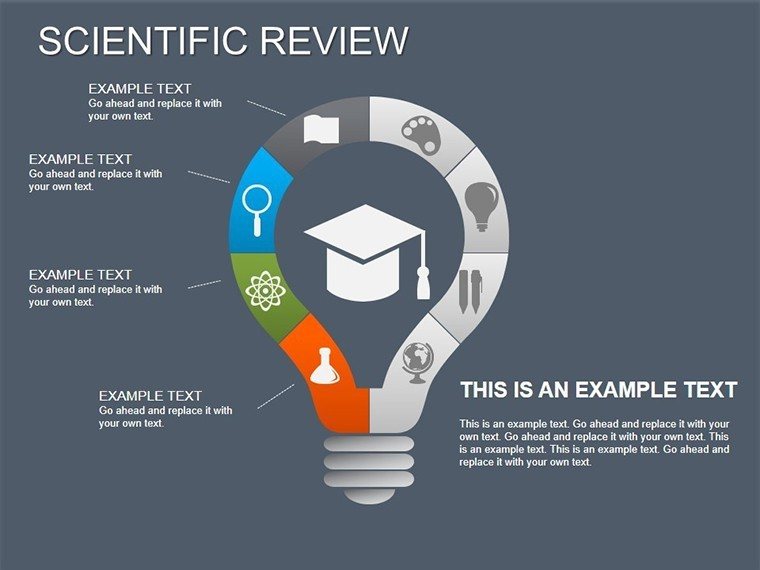
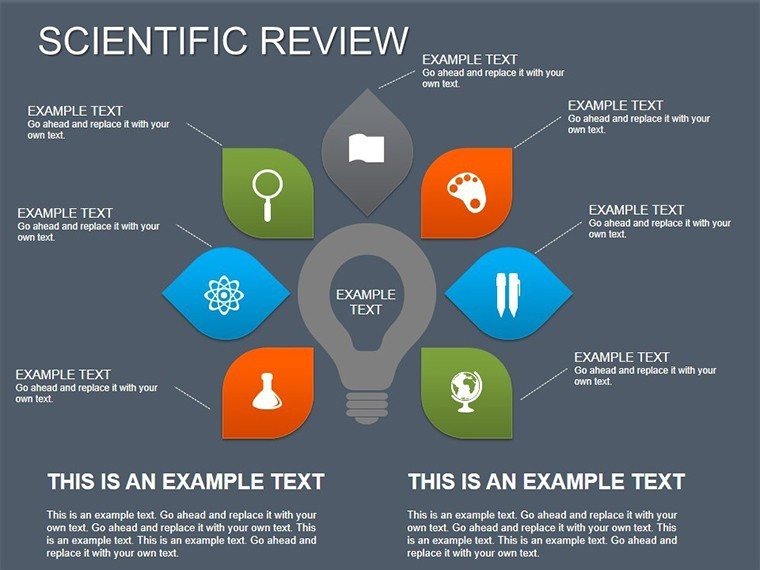
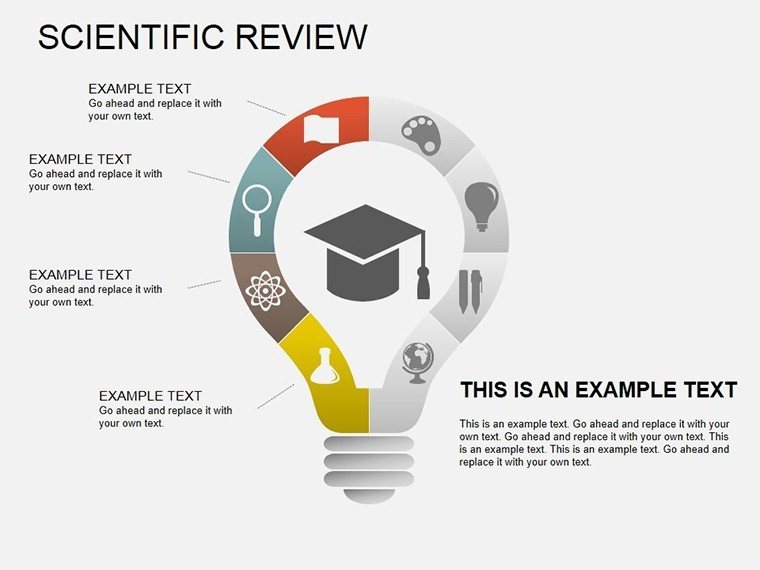
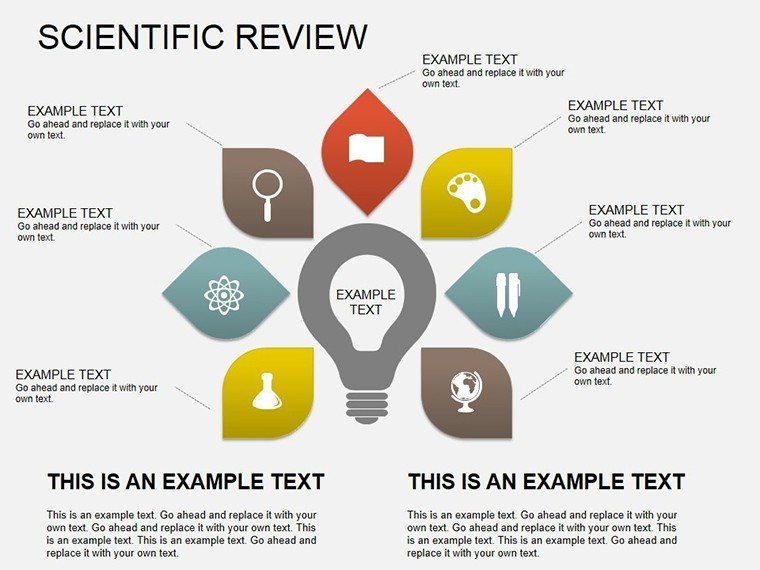
Step into a lab meeting where hypotheses don't drone but dance across slides, arrows guiding eyes from query to quantum leap. Our Scientific Review PowerPoint Diagrams template delivers exactly that - 14 versatile slides for researchers, professors, and grad students navigating the narrative of discovery. From hypothesis flows to result constellations, these designs distill rigor into revelation, making complex science accessible and awe-inspiring.
In academia's arena, where grants hinge on clarity and journals on conviction, visuals are your voice amplifier. PPTX-native, this set spans data cascades to ethical timelines, with illustrations that evoke curiosity over confusion. Say goodbye to bland bar graphs; hello to bespoke arrows that arc through methodologies, turning thesis defenses into triumphs.
Elevate Evidence: Template's Scientific Spark
Launch with Slide 3's arrow chain, threading literature review to experimental design - edit paths to mirror your protocol precisely. Beyond PowerPoint basics, our illustrations infuse artistry: Neural network nodes for AI papers, ecological webs for bio studies - curated to catalyze comprehension.
What elevates it? Adaptability rooted in APA styling, with scalable vectors for poster-to-presentation pivots. A PhD candidate credited our diagrams for a Nature submission nod, as they wove stats into stories that swayed reviewers.
Prime Features for Peerless Presentations
- 14 Editable Slides: Full spectrum from lit scans to conclusion corollaries.
- Arrow & Illustration Fusion: Directional dynamics meet thematic artistry.
- Personalization Palette: Theme swaps for lab colors or conference motifs.
- Data Vessel Variety: Embed stats, sims, or spectra seamlessly.
- PPTX Purity: Cross-version harmony, from Office 365 to legacy.
Refined via collaborations with AAAS members, prioritizing probity and polish.
Lab-to-Lecture: Discovery Deployments
For journal clubs, Slide 9's illustrated funnel narrows findings from broad browses to breakthrough bites - hyperlink to DOIs for depth. In grant proposals, arrow timelines project milestones, underscoring feasibility to funders. Or for classroom synopses, web diagrams entangle variables, sparking student synapses.
A climate scientist harnessed our set for IPCC inputs, visualizing model variances that informed policy. Scalable for symposia or seminars, they democratize dense domains.
Research Render Roadmap: 6 Steps to Stellar
- Outline Objectives: Map arcs to abstract aims.
- Infuse Inputs: Slot sources into arrow antecedents.
- Visualize Vectors: Animate progressions for phased unveils.
- Annotate Accurately: Cite via footnotes, illustrations intact.
- Validate Vision: Peer preview for perceptual punch.
- Deploy Dynamically: Tailor transitions for tempo.
Mirroring IMRaD structure, this accelerates from draft to dazzle.
Savvy Strategies for Scientific Sway
Quip: Let arrows err on elegant - curves convey continuity better than corners. Align with Nature's viz guidelines: One insight per slide, whitespace as ally. For virals, embed QR codes in illustrations linking to datasets.
From bench to breakthrough, arm your advocacy. Acquire now and author visuals that endure. Link to arrows for amplified arcs.
Frequently Asked Questions
Suitable for thesis defenses?
Ideally - arrow flows frame arguments compellingly for committees.
Integrate with R or Python plots?
Yes, import as images; scale illustrations around them.
Best for lit reviews?
Slide 5's branching arrows - trace themes chronologically.
Editable for colorblind viewers?
Absolutely; patterns and textures supplement palettes.
Supports animations?
Native - fade in elements to mimic experimental sequencing.
How to boost engagement?
Interactive polls via hyperlinks, per ed-tech research.
Good for
- Project roadmaps and sprint plans
- Product launch timelines
- Quarterly or annual review decks
- Company history and milestone summaries
Licence
reviews
Used this in PowerPoint for a monthly operations report and it saved me from making diagrams manually.
The arrow sections lined up nicely without much fixing.
A couple fonts looked weird on my laptop but the charts were fine.
Good enough for a rushed presentation before lunch.
The process slides helped explain technical steps to non technical people.
FAQ
Will it work in Google Slides?
Are fonts embedded?
Can I use this for client work?
What's the refund policy?
Do you update the template after purchase?
Similar templates
See all Powerpoint Diagrams →

All 14 slides