 Click to zoom
Flights PowerPoint Diagrams: Chart Your Path to Engaging Aviation Narratives
| Format | .pptx |
| Slides | 13 unique layouts |
| Aspect ratio | 16:9 |
| Compatibility | PowerPoint |
| Animated | No |
| Language | English |
| License | Commercial |
| File size | — |
| Version | v1.0 |
| Last updated | May 2024 |
What's inside
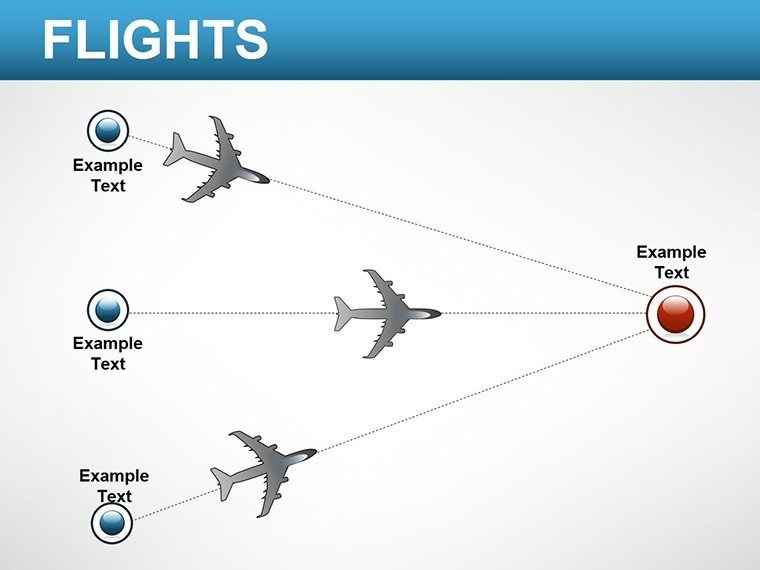
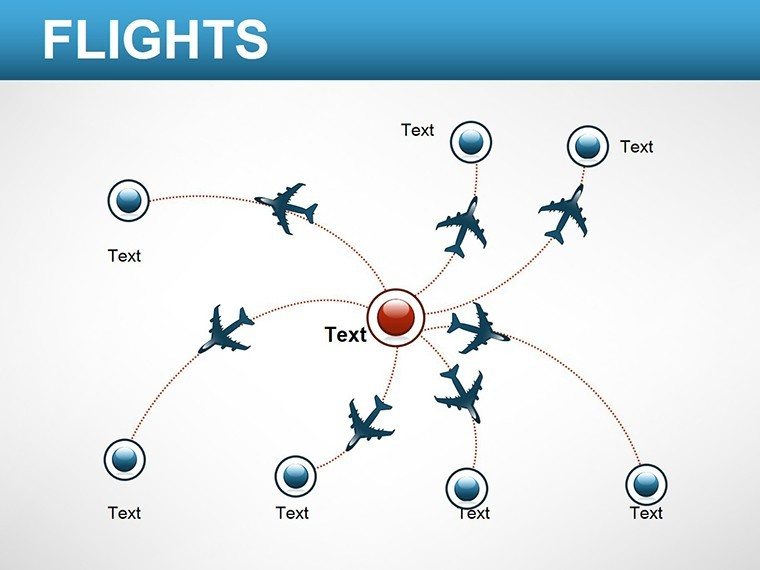
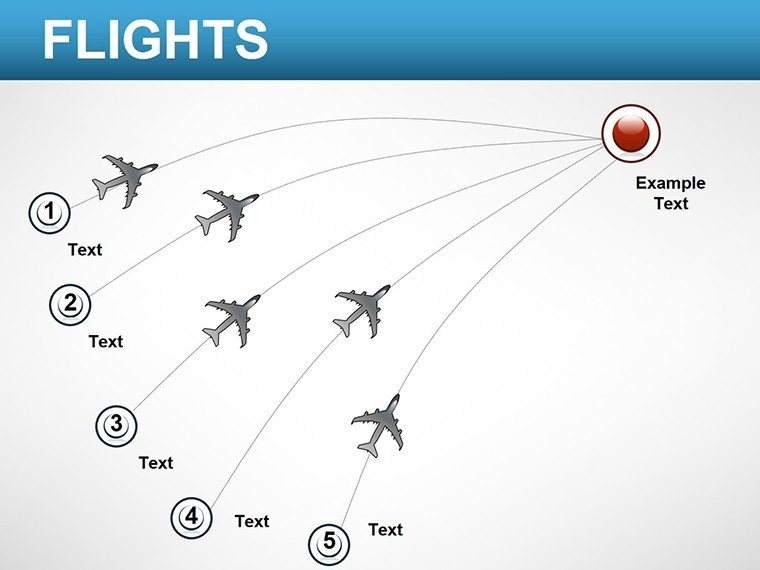
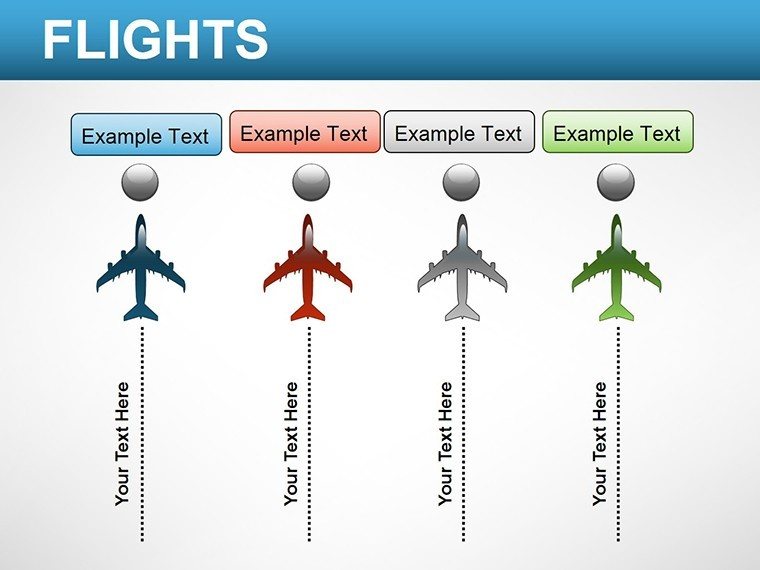
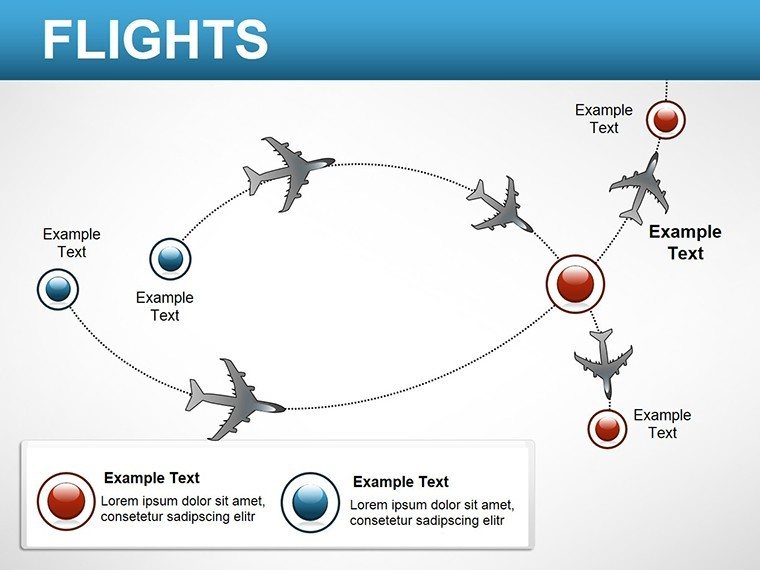
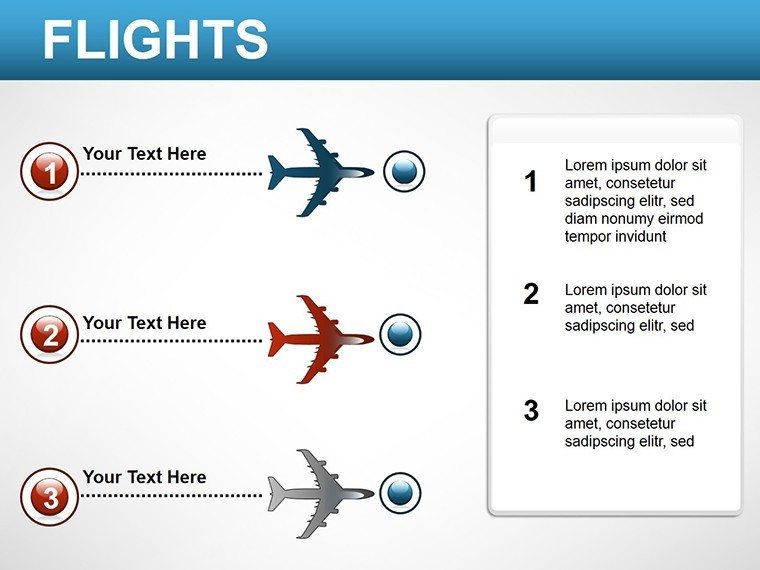
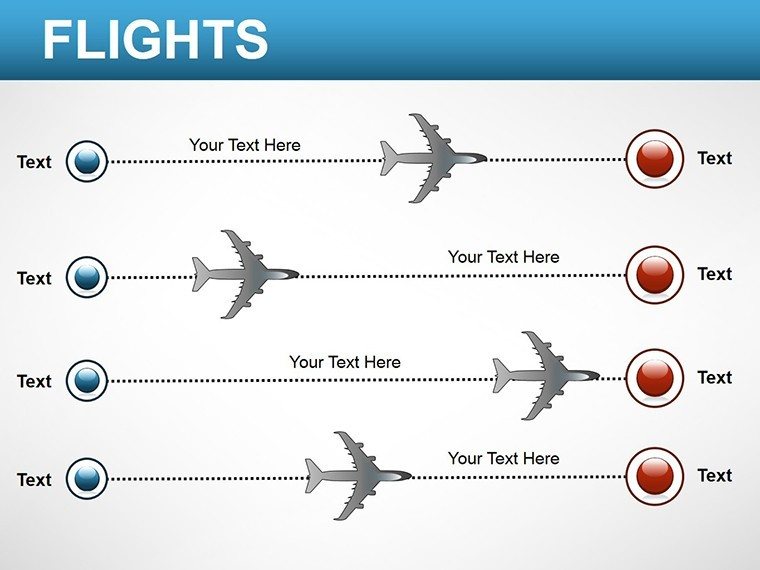
Ever watched an airport's flight board flicker with connections, wishing your slides could capture that same sense of global linkage? The Flights PowerPoint Diagrams template does just that, delivering 13 editable slides that map the skies of aviation data with precision and panache. Geared toward business executives mapping route expansions, educators tracing migration patterns, or marketers analyzing travel booms, this tool turns sprawling sector stats into streamlined stories that take off.
What sets it apart is its focus on the aviation industry's pulse - routes that snake across maps, demographics that paint passenger portraits, operations that hum like runways. Built for PowerPoint 2016 and beyond, it slips into your existing decks like a well-timed layover, with vector icons of planes, hubs, and trends ready to customize. Shift hues from sky blues to runway grays, resize paths for emphasis, and suddenly, your quarterly review isn't a drone - it's a directed flight plan sparking strategic discussions.
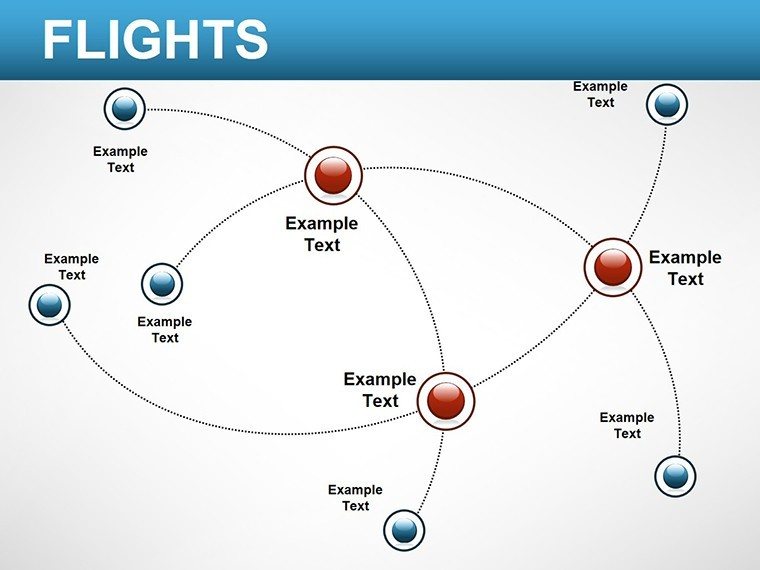
For consultants pitching airline partnerships, overlay connection webs to reveal untapped synergies; the clean lines and node labels make efficiencies jump out. Teachers might use demographic slices to explore tourism impacts, layering age groups over destinations for nuanced views. It's about making the vast feel approachable, ensuring every slide lands your point with impact.
Standout Features for Sky-High Presentations
This aviation diagram PowerPoint template is engineered for the sector's specifics, blending utility with visual lift.
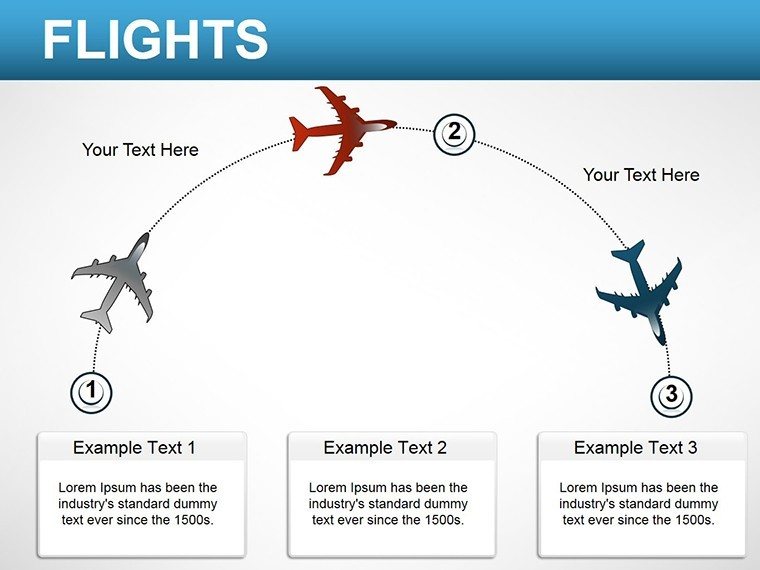
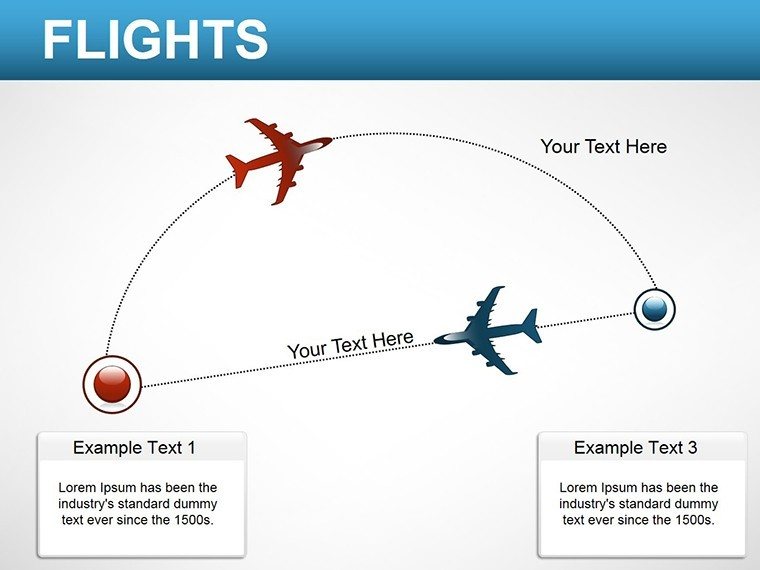
- Route Mapping Mastery: Curved paths and hub icons for network overviews, scalable from regional hops to international webs.
- Demographic Depth: Pie and bar integrations within flight contexts, highlighting shifts like business versus leisure travelers.
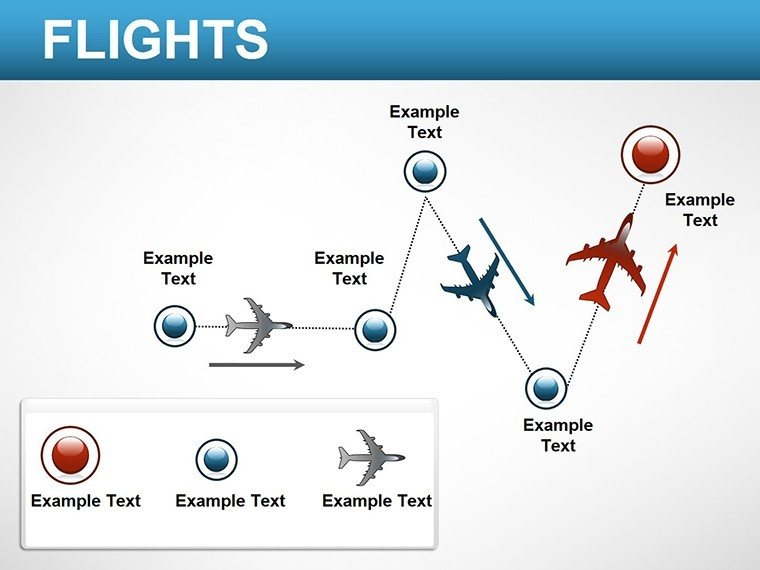
- Trend Timeline Tools: Horizontal flows for evolution tracking, from post-pandemic recoveries to sustainability pushes.
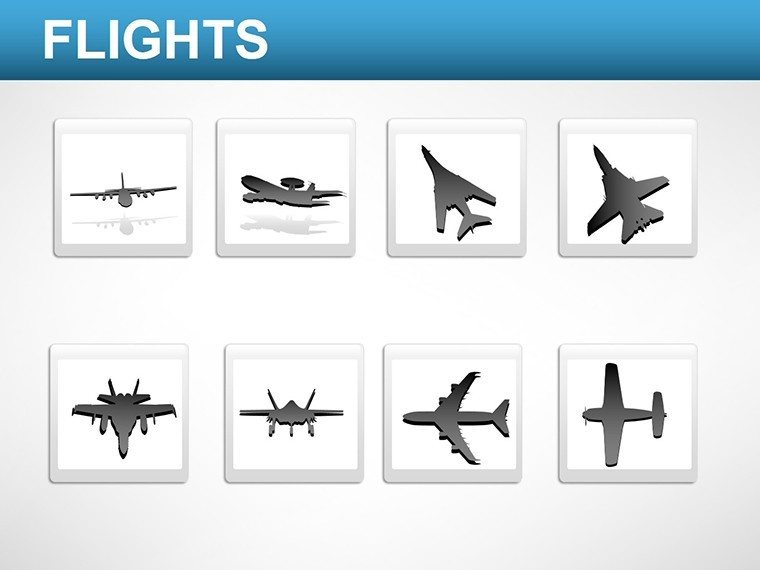
- Icon Arsenal: 50+ aviation-themed graphics - luggage tags to radar scopes - for contextual punch.
Together, they create decks that navigate data turbulence, keeping viewers on course.
Slide Spotlight: From Takeoff to Touchdown
Slide 1 launches with a global route overview, pins dropping destinations via simple drag mechanics. Progress to Slide 3's connection matrix, where lines thicken by frequency - input your load factors to auto-adjust.
Midway, Slides 5-8 tackle operations: Flowcharts for gate turnarounds or radial charts for delay distributions, with editable segments for seasonal variances. Demographics dominate Slides 9-11, blending funnels for embarkation stats with geo-bubbles for origin clusters. Conclude on Slide 13 with a dashboard amalgam, pulling metrics into interactive gauges.
Editing? Select an element, hit the layout tab, and nudge alignments - pair with alt text like "International flight routes diagram" for accessibility. Insider nudge: Animate paths sequentially to mimic flight progressions, drawing eyes along your logic.
Targeted Applications: Lifting Your Aviation Talks
In boardrooms, this template fuels proposals by visualizing market shares - arcs between competitors' hubs expose collaboration opportunities, much like how industry reports dissect alliance benefits. For marketing campaigns, trend slides forecast leisure surges, arming teams with visuals that convert data to dollars.
Educational uses abound: Geography classes trace migration flights, overlapping routes with climate data for migration insights. Researchers layer passenger profiles over economic indicators, uncovering patterns in travel behaviors. It's versatile enough for sustainability pitches, charting carbon footprints along flight paths to advocate greener skies.
A travel agency lead once wove demographic overlaps into a client pitch, spotlighting niche markets like eco-tourists - the result? Bookings that climbed with the visuals' clarity.
Streamlined Implementation Steps
- Assess Scope: Pick slides aligning with your focus - routes for logistics, demos for audiences.
- Infuse Data: Paste stats into placeholders; charts update responsively.
- Tailor Themes: Recolor icons to brand specs, ensuring cohesion across your full presentation.
- Enhance Interactivity: Add hyperlinks to nodes for drill-downs in live sessions.
- Review Altitude: Preview in presentation mode, adjusting scales for screen ratios.
This approach ensures smooth ascents, from draft to delivery.
Superior to Stock Options: Why This Template Wins
PowerPoint's clipart planes look dated next to these refined vectors, and manual mapping eats time. Here, pre-linked elements and sector-savvy layouts mean pro results faster, integrating like a seamless transfer.
For those echoing aviation strategy playbooks, it provides the graphical rigor to back bold visions.
Ready for liftoff? Secure this Flights PowerPoint Diagrams template for $15 and navigate your next presentation to new heights.
Frequently Asked Questions
How customizable are the route maps?
Fully - drag nodes, curve lines, and scale icons to reflect exact geographies and frequencies.
Does it include data for real airlines?
No sample data, but placeholders accept imports from CSV for authentic integrations.
Ideal for non-aviation travel topics?
Yes, adapt for rail or shipping by swapping icons, keeping the network logic intact.
Animation options for flight paths?
Built-in paths follow curves; time them to simulate journeys for dynamic reveals.
Compatible with Mac PowerPoint?
Seamlessly, with all edits and exports mirroring Windows functionality.
Good for
- Project roadmaps and sprint plans
- Product launch timelines
- Quarterly or annual review decks
- Company history and milestone summaries
Licence
reviews
The org chart with photos adds a personal touch.
The photo frames are circular which looks modern.
Used this for a team introduction slide.
The hierarchy lines are clear.
Better than a boring list of names.
FAQ
Will it work in Google Slides?
Are fonts embedded?
Can I use this for client work?
What's the refund policy?
Do you update the template after purchase?
Similar templates
See all Powerpoint Diagrams →


All 13 slides