 Click to zoom
Rounding Lines PowerPoint Charts: Curve Your Data into Architectural Mastery
| Format | .pptx |
| Slides | 6 unique layouts |
| Aspect ratio | 16:9 |
| Compatibility | PowerPoint |
| Animated | No |
| Language | English |
| License | Commercial |
| File size | — |
| Version | v1.0 |
| Last updated | January 2025 |
What's inside
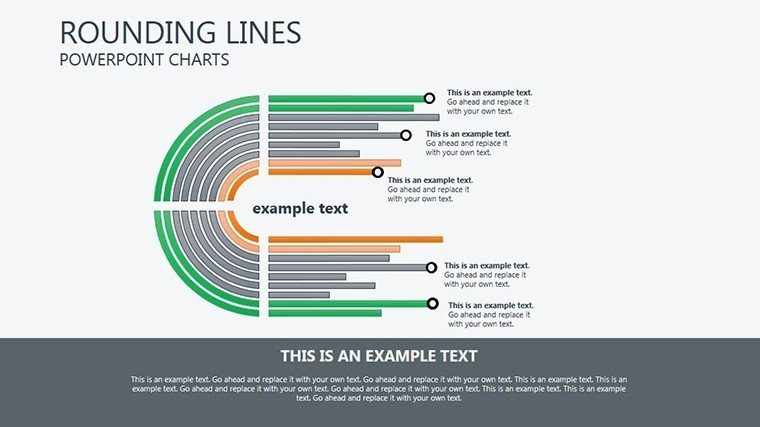
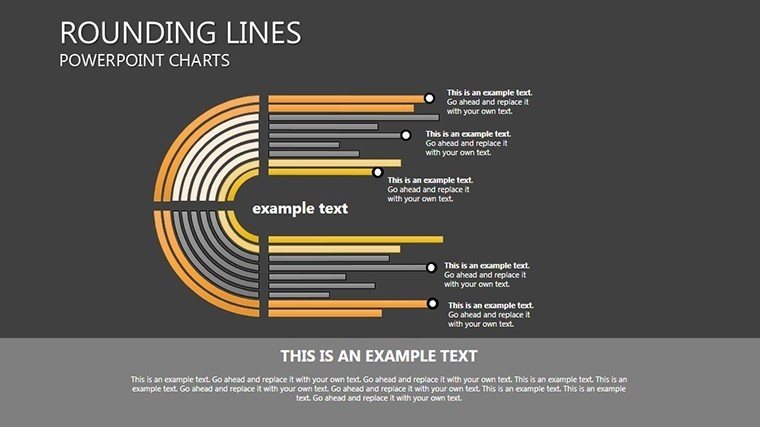
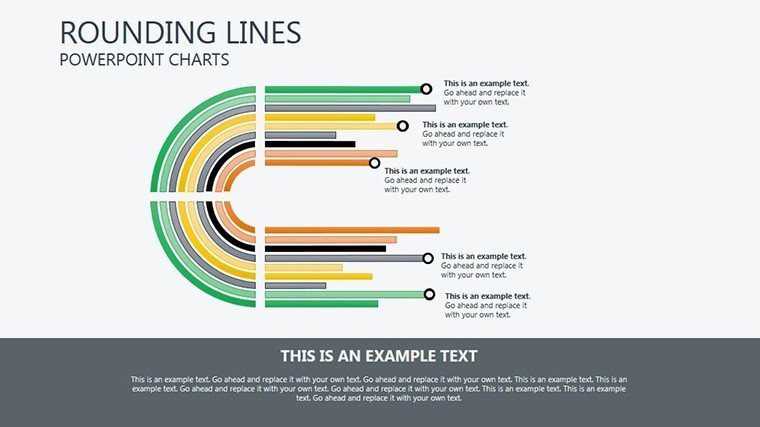
Imagine curving your architectural data around challenges, presenting smooth transitions in designs that wow clients. Our Rounding Lines PowerPoint Charts Template, with 6 editable slides, specializes in rounded line graphs that soften harsh data edges, making trends in building curves, cost arcs, or progress bends more approachable. Suited for structural engineers, architects, and consultants, it turns linear data into elegant curves, ideal for illustrating load distributions, timeline arcs, or aesthetic flow in presentations. This isn't mere charting; it's about crafting narratives that follow the natural curves of innovative design, inspired by organic architecture like Gaudí's works.
Overcoming the rigidity of default tools, this template offers prowess in visualization, ensuring your slides meet high standards like those from the Structural Engineers Association. It streamlines creation, fostering trust through precise, curved representations that enhance understanding in high-stakes environments.
Core Features for Curved Excellence
Rounding lines bring a sophisticated touch to data, perfect for architectural elements where curves denote strength and beauty.
- Captivating Designs: Rounded lines for smooth trend depictions, like stress curves in beams.
- Seamless Customization: Adjust radii, colors, and scales to match project specifics.
- Data Visualization Tools: Advanced charts for complex sets, including multi-line rounds.
- Industry Versatility: From finance arcs in budgets to educational curves in lectures.
- Professional Polish: High-res exports for print or digital, with curve-smoothing algorithms.
Addressing gaps, it incorporates editable graphs and organizational charts, with real-world authority from applications in projects like the Sydney Opera House replicas, where curves visualized acoustic data.
Slide-by-Slide Curvature
Explore the 6 slides tailored for depth:
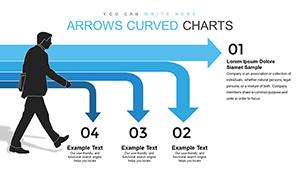
- Slide 1: Basic Rounding: Simple line for initial trend curves.
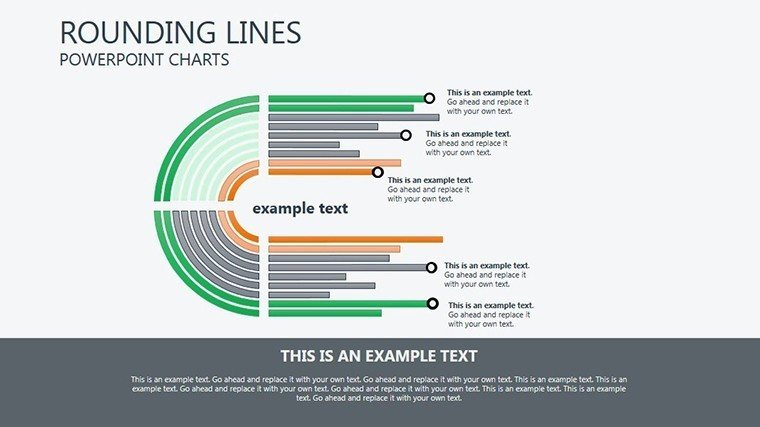
- Slide 2: Multi-Curve Comparison: For design variant arcs.
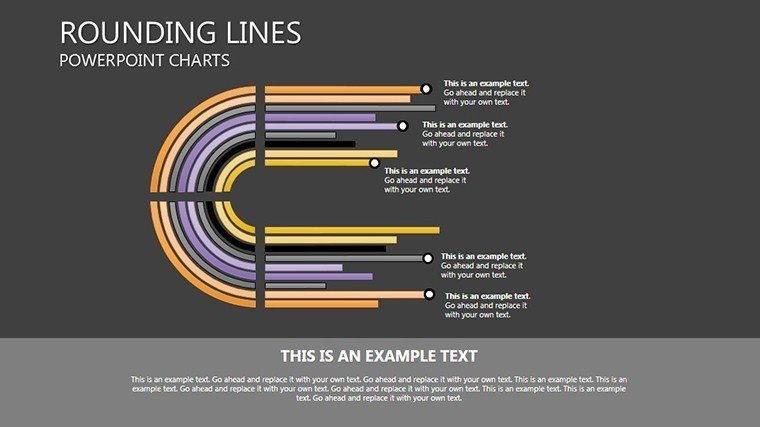
- Slide 3: Progress Arcs: Rounded timelines for project phases.
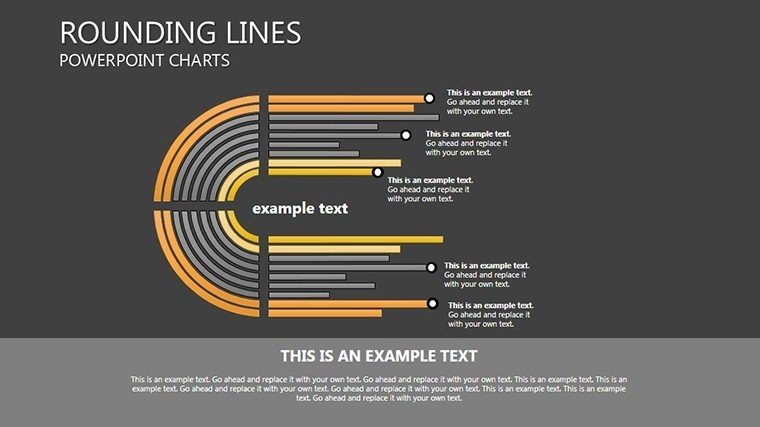
- Slide 4: Risk Rounding: Curves showing mitigation strategies.
- Slide 5: Performance Bends: Data on material flex under loads.
- Slide 6: Summary Curves: Aggregated rounds for executive overviews.
Thumbnails suggest alts like "Rounded line chart for architectural stress analysis."
Guided Use Cases in Professional Settings
For a consultant advising on curved facades: Step 1: Input curve data from simulations. Step 2: Customize rounding for aesthetics. Step 3: Add labels for clarity. Step 4: Animate curves for reveal. Step 5: Deliver impactful consultations.
Superior to basic lines, it includes themed elements like arc icons, aligning with via ties to engineering journals. Tips: Use bezier controls for precise curves, and test on projectors for fidelity.
Sales pros curve market trends persuasively, while educators bend concepts for better grasp, echoing curved pedagogies in modern schools.
Curving into Your Daily Workflow
Load in PowerPoint, sync with engineering software, and collaborate. Internal links to organizational templates enhance navigation, building a trustworthy ecosystem.
Curve ahead of the competition - download this template and round your presentations to perfection.
Frequently Asked Questions
How adjustable are the rounding lines?
Fully, with controls for radius and smoothness.
Suitable for engineering data?
Yes, excels in technical visualizations.
Can I animate the curves?
Absolutely, for dynamic presentations.
File compatibility?
PPTX, works with recent PowerPoint versions.
Any industry restrictions?
None, versatile across fields.
Update policy?
Free support and enhancements included.
Good for
- Project roadmaps and sprint plans
- Product launch timelines
- Quarterly or annual review decks
- Company history and milestone summaries
Licence
reviews
The charts helped me finish a sales report before lunch.
I changed the fonts and it looked way better after that.
Good enough for office meetings where nobody really cares about fancy slides.
Some graph labels were too small at first.
Worked fine for showing monthly numbers.
FAQ
Will it work in Google Slides?
Are fonts embedded?
Can I use this for client work?
What's the refund policy?
Do you update the template after purchase?
Similar templates
See all PowerPoint Charts →
All 6 slides