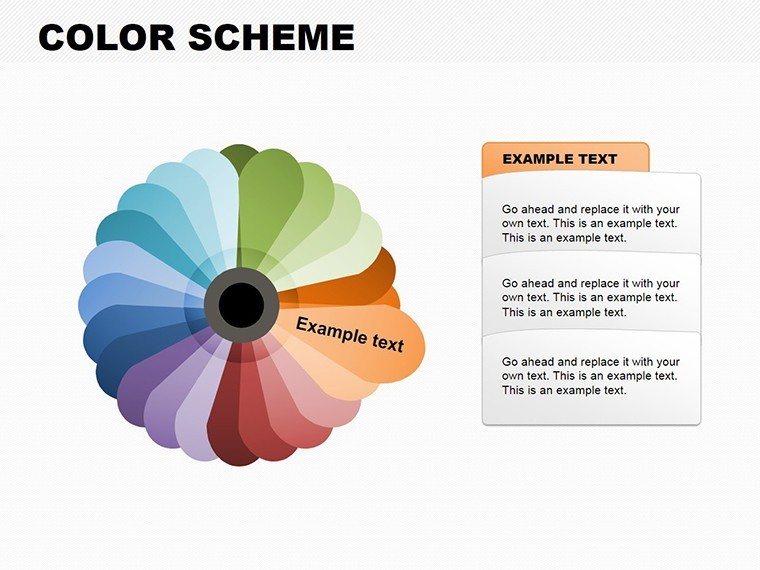
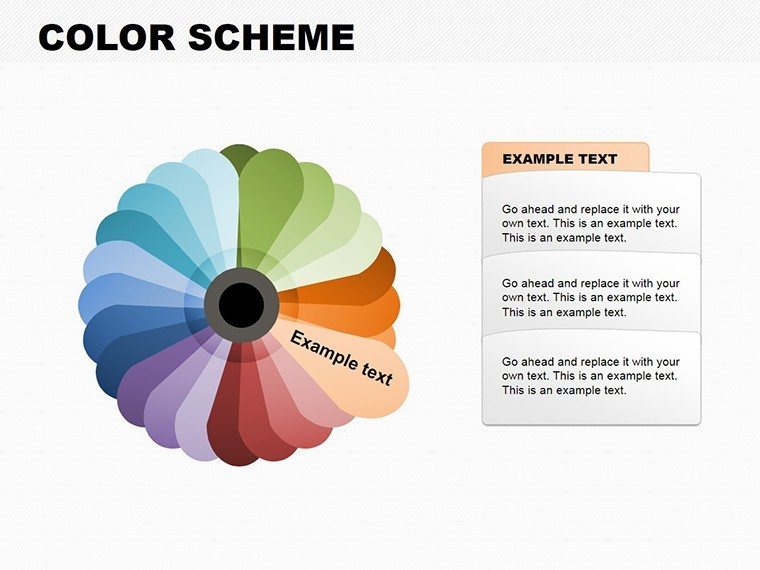
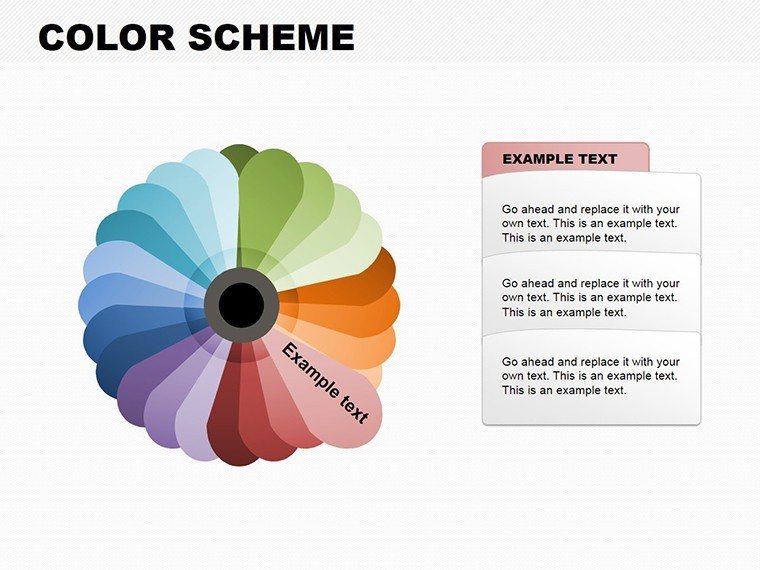
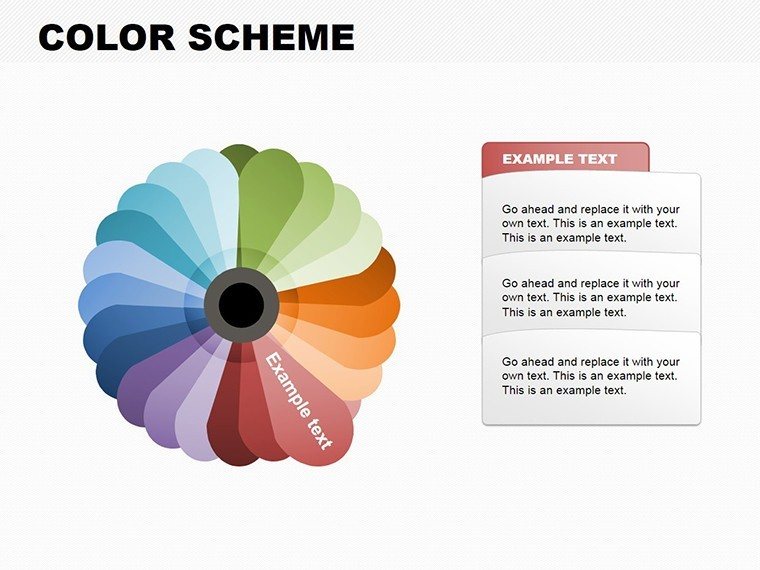
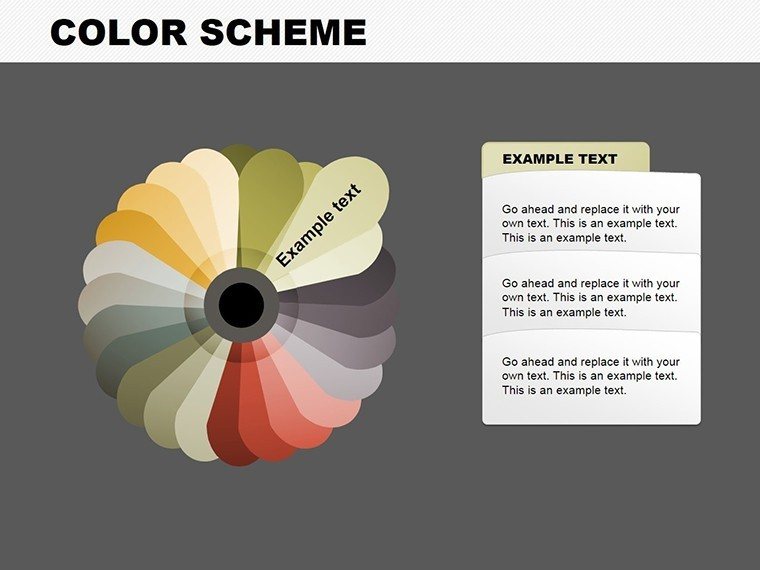
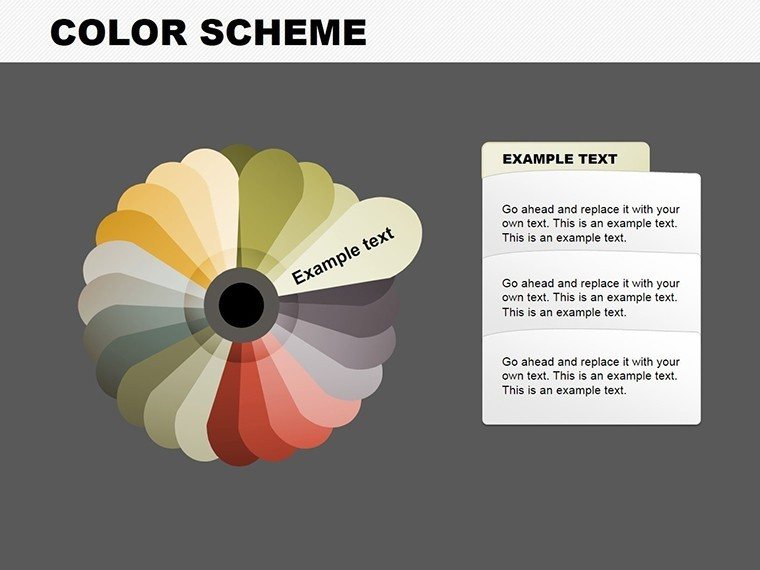
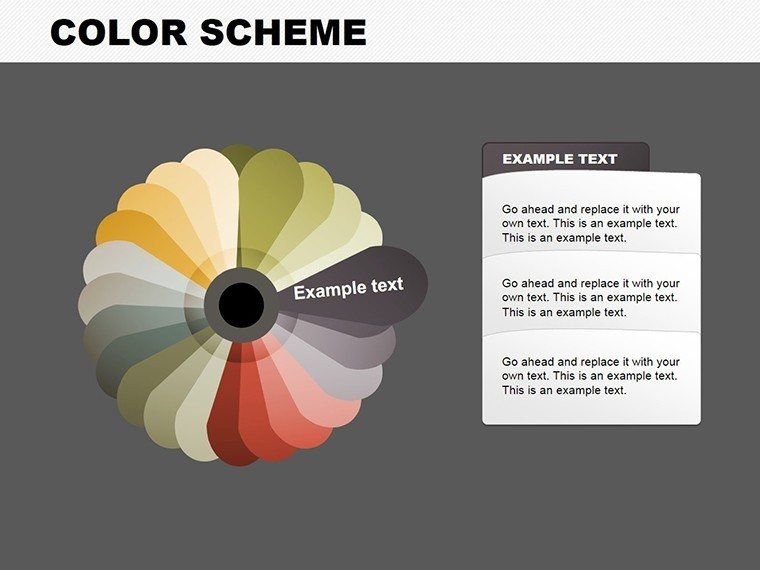
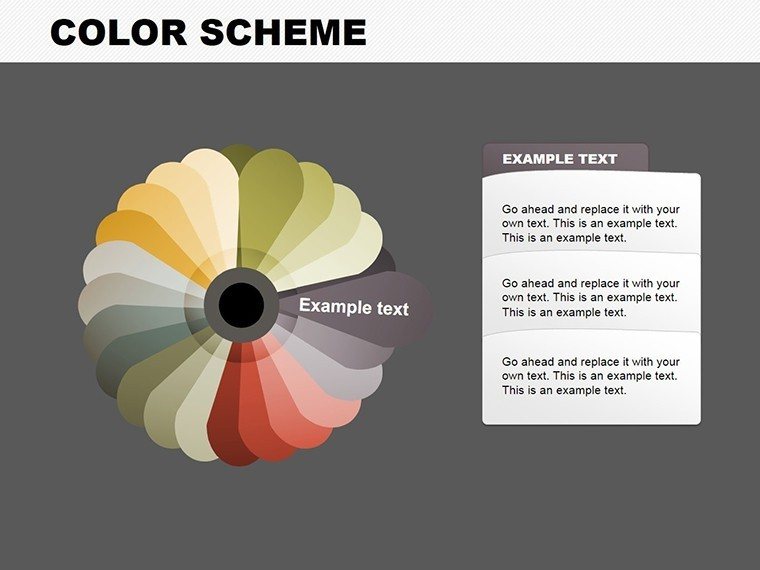
 Click to zoom
Pie Charts PowerPoint Template - Fully Editable | Instant Download
| Format | .pptx |
| Slides | 35 unique layouts |
| Aspect ratio | 16:9 |
| Compatibility | PowerPoint |
| Animated | No |
| Language | English |
| License | Commercial |
| File size | — |
| Version | v1.0 |
| Last updated | March 2026 |
What's inside
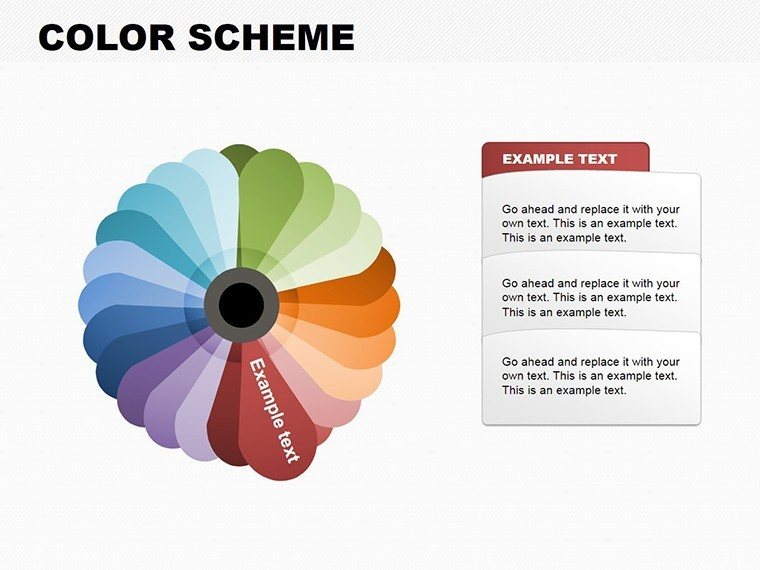
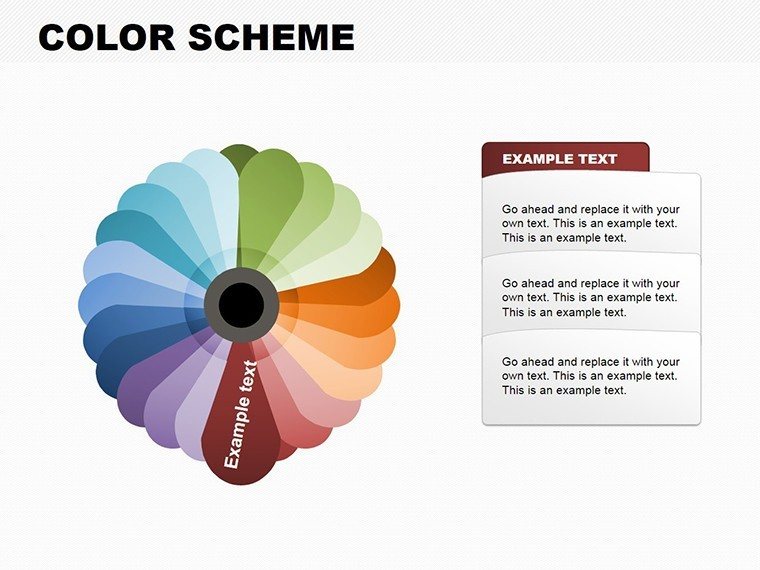
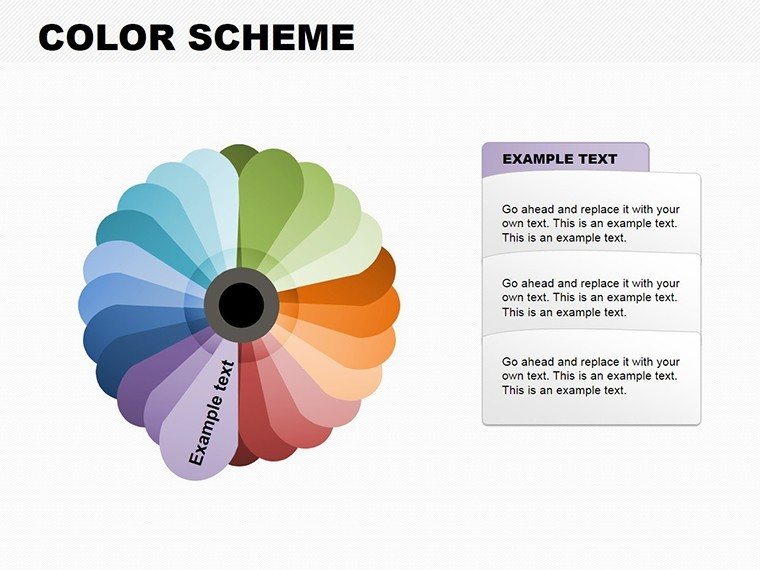
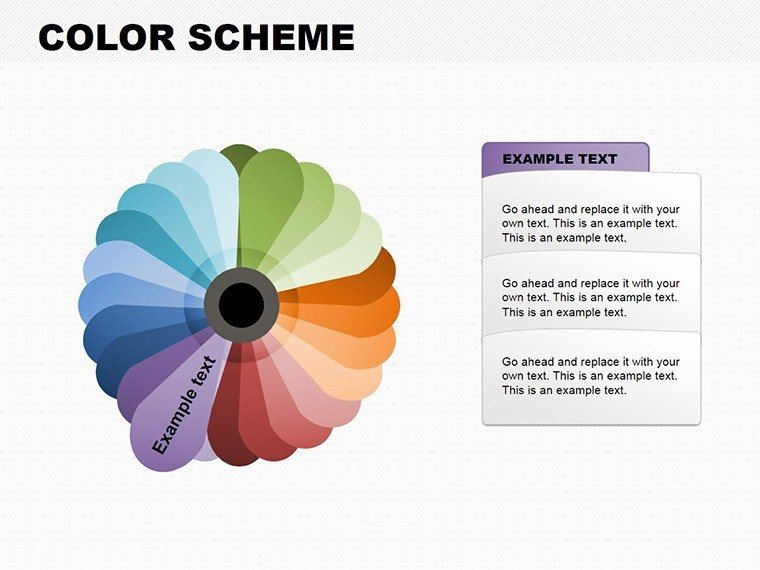
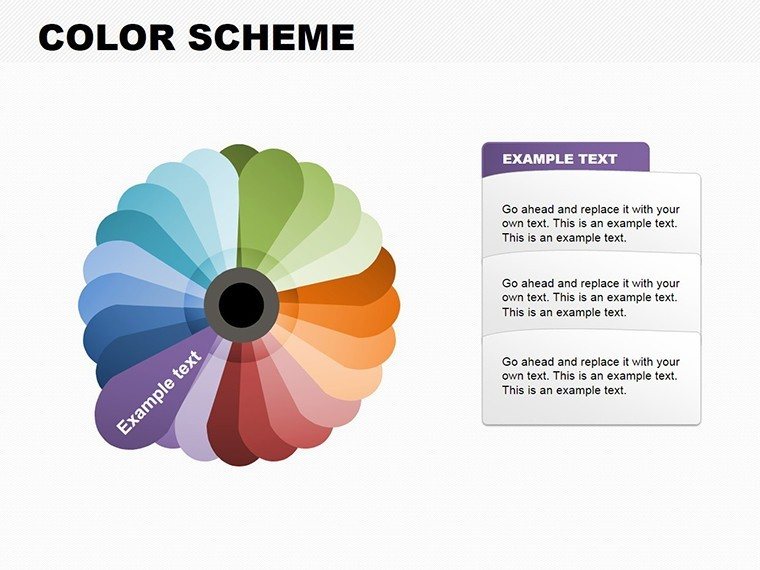
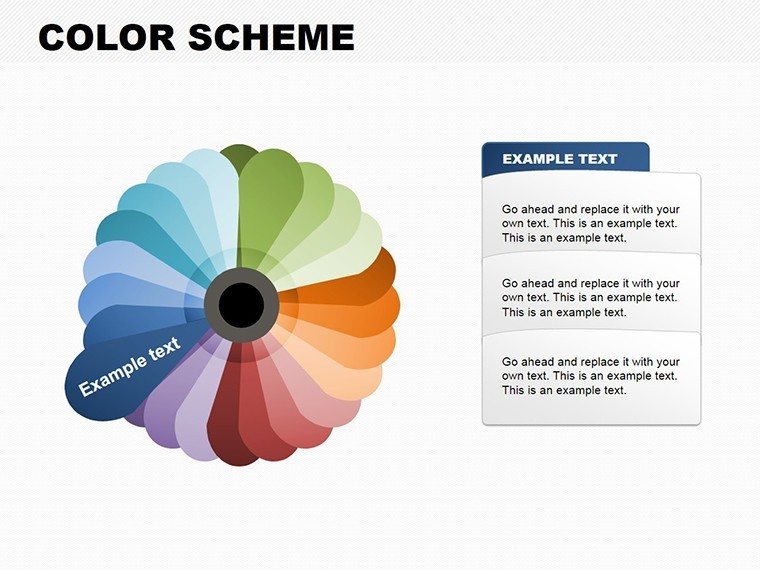
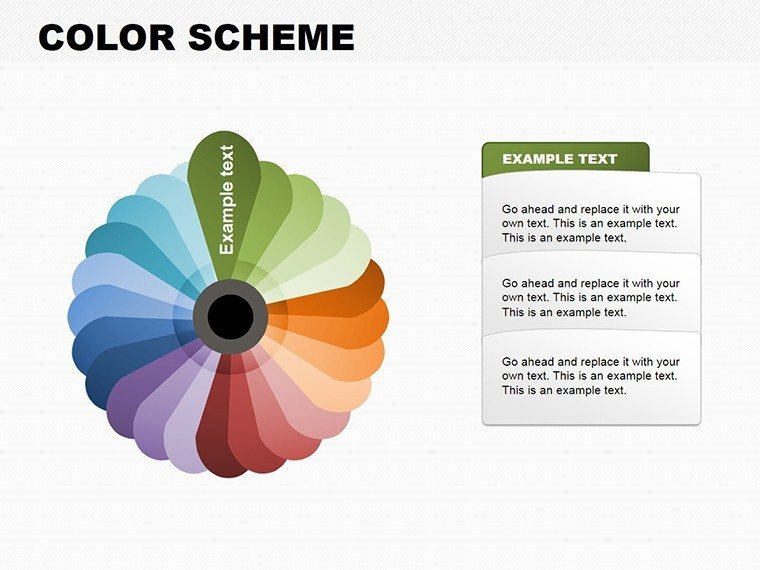
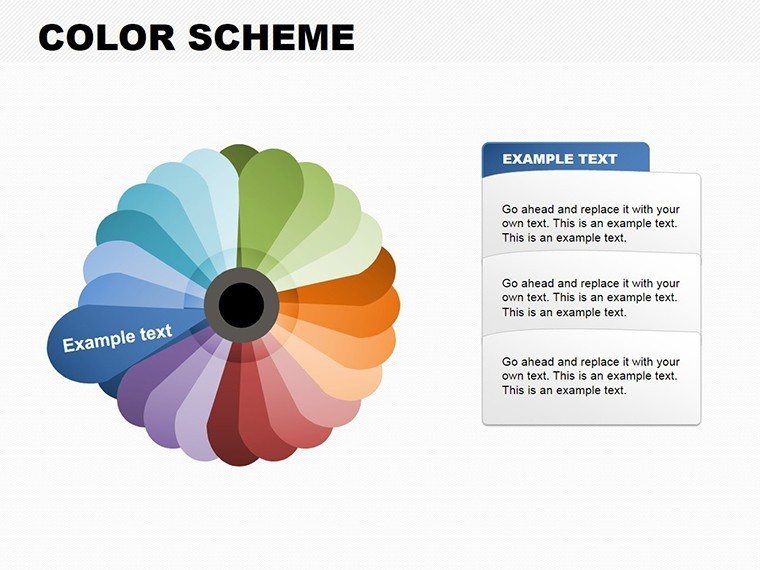
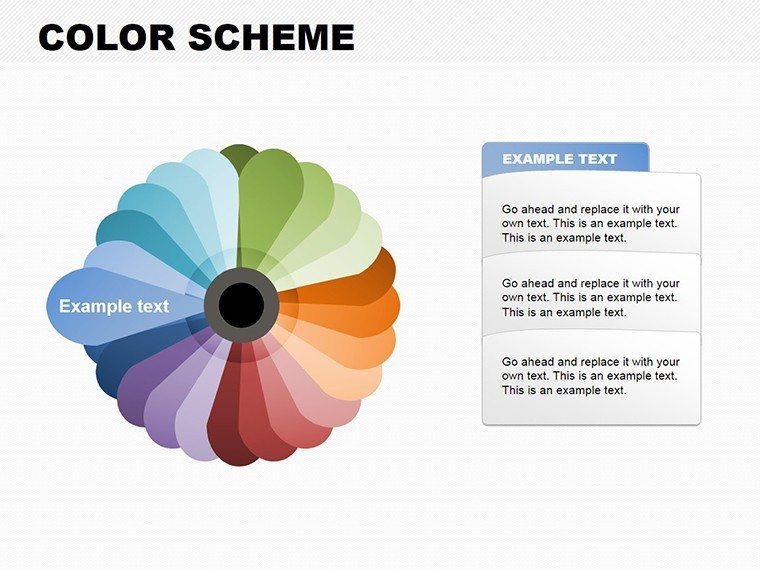
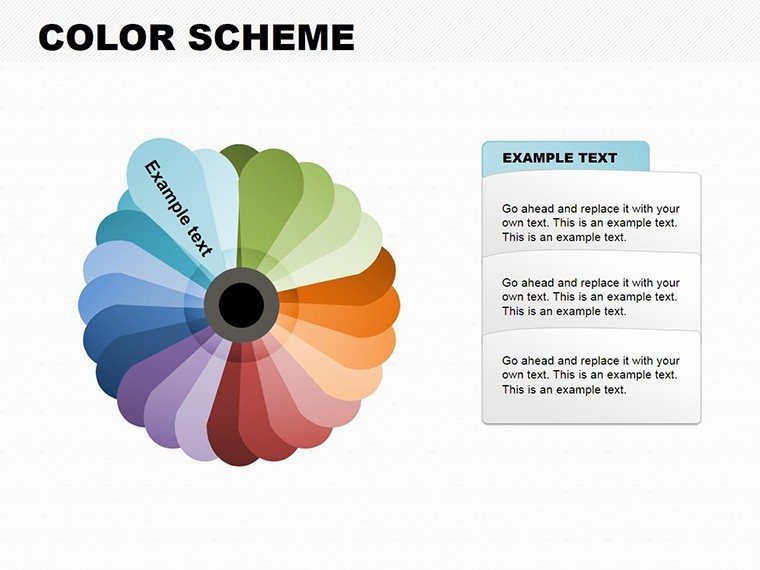
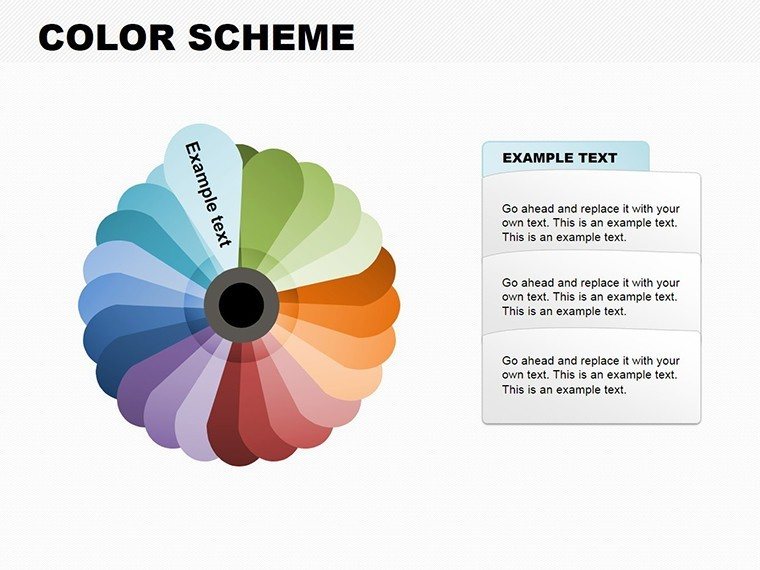
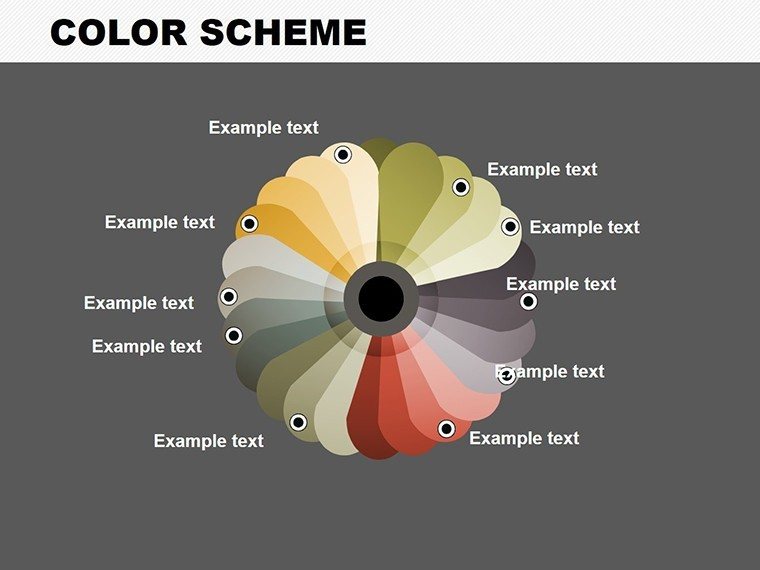
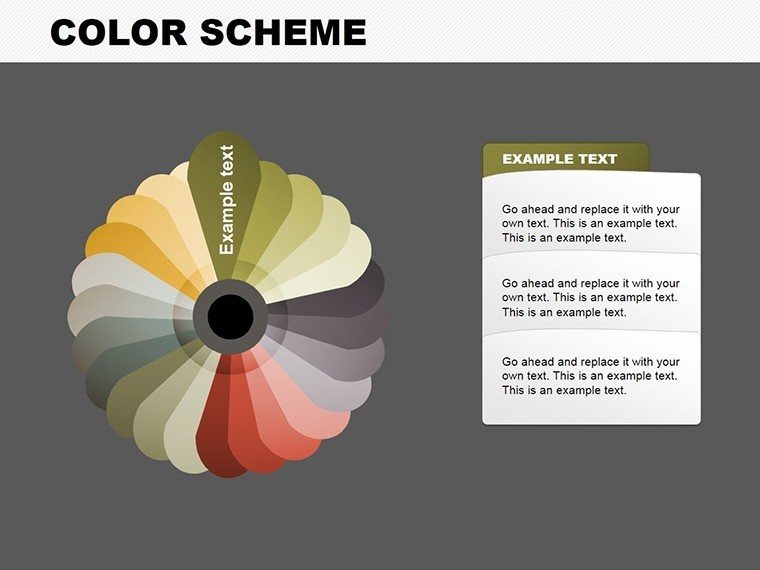
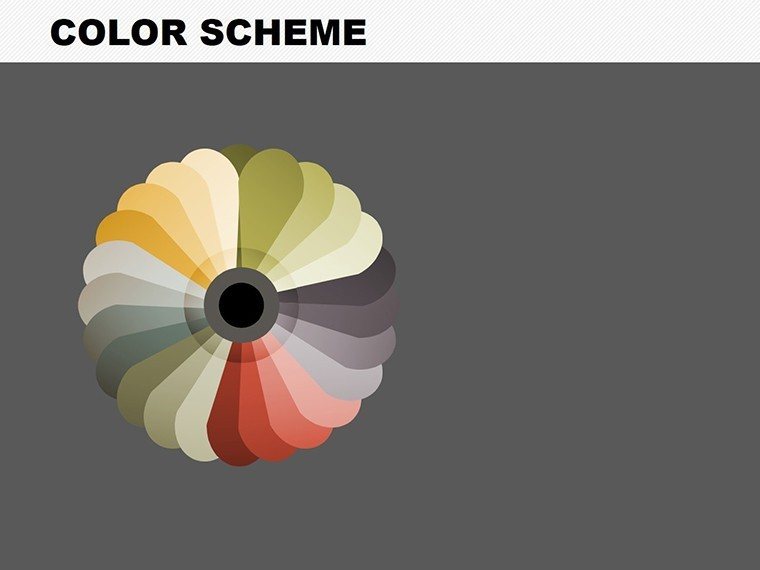
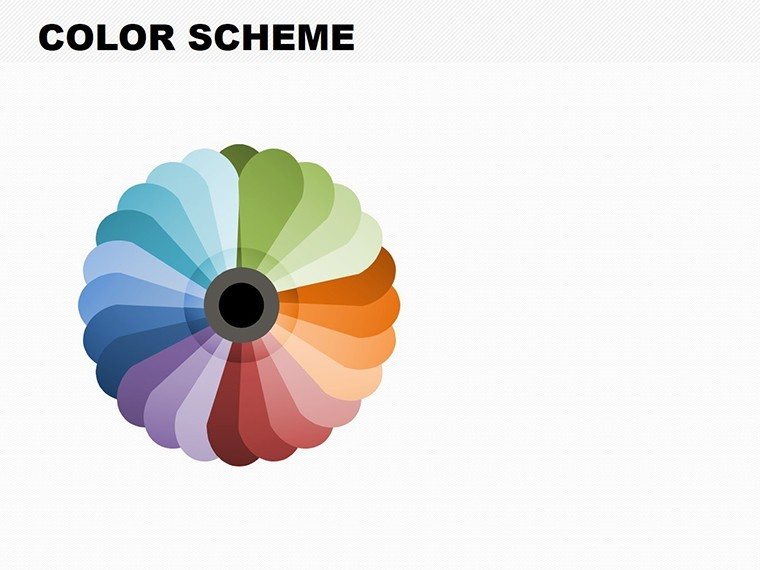
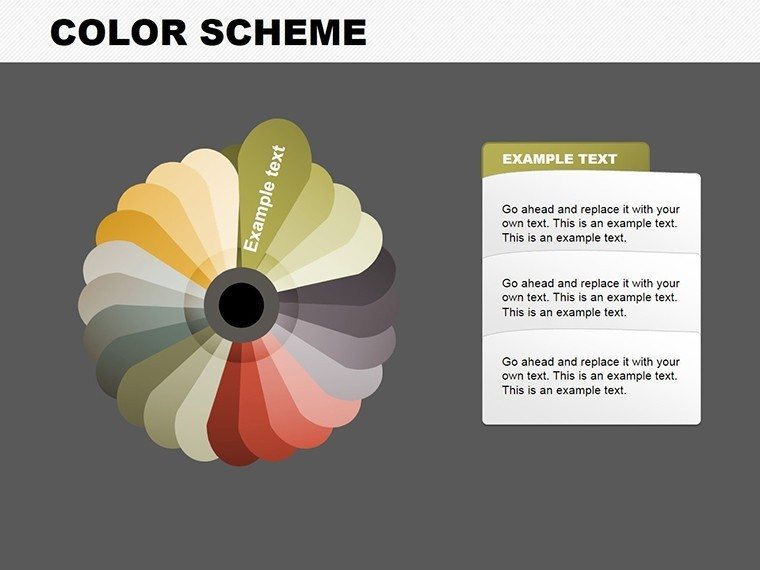
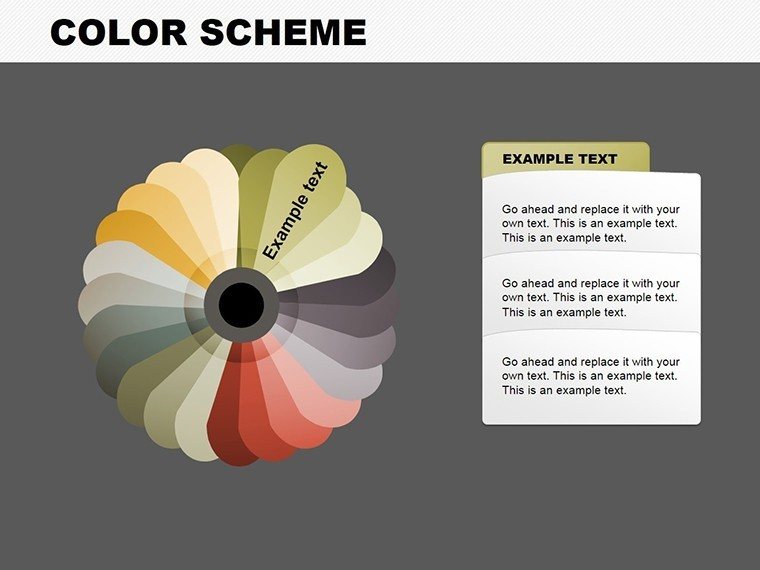
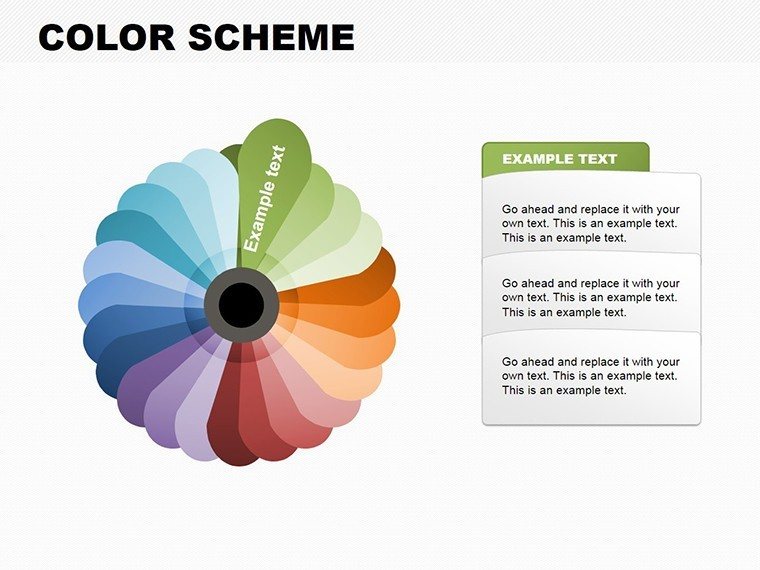
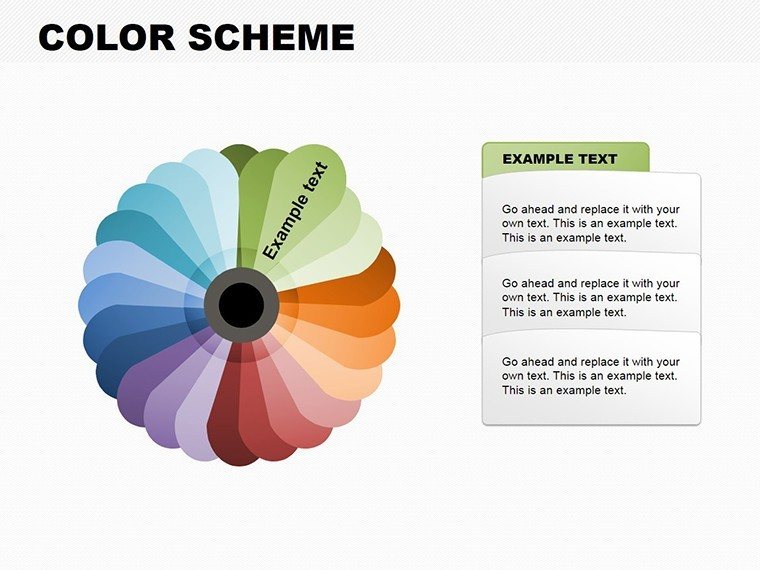
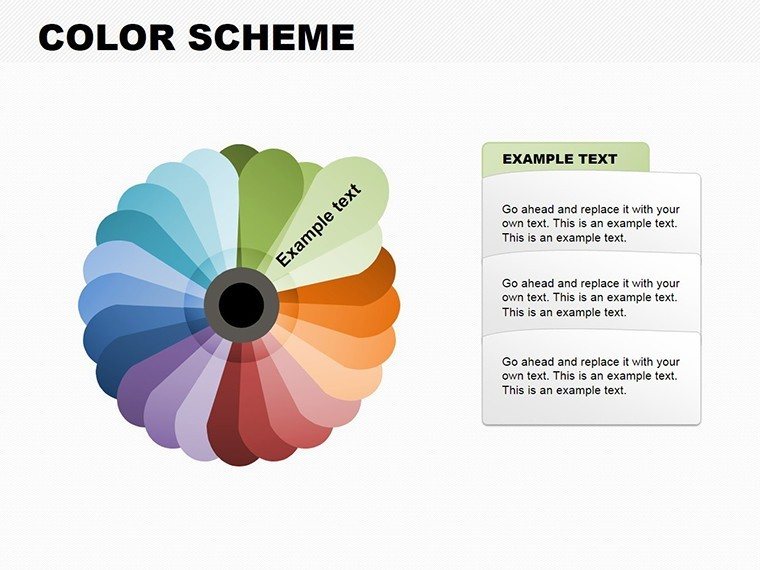
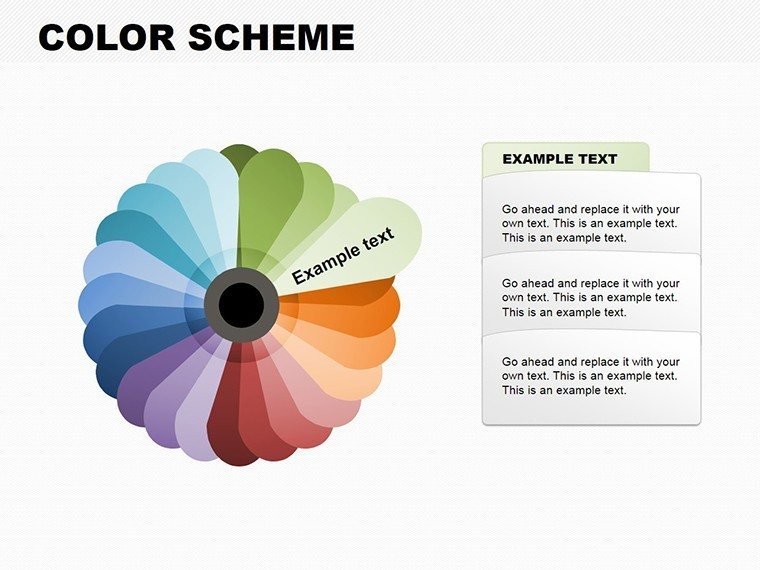
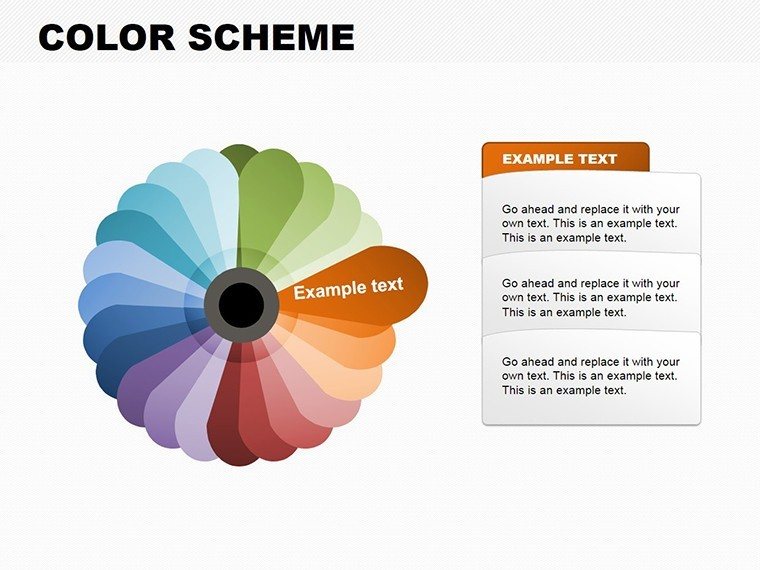
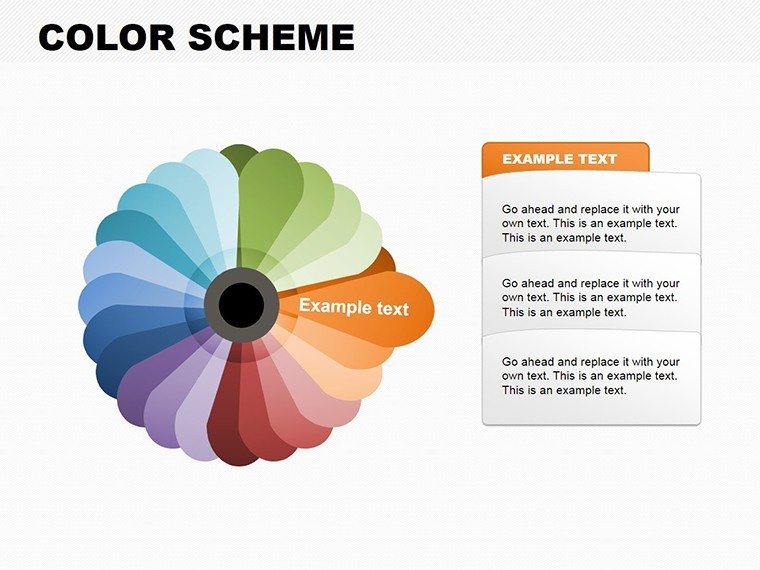
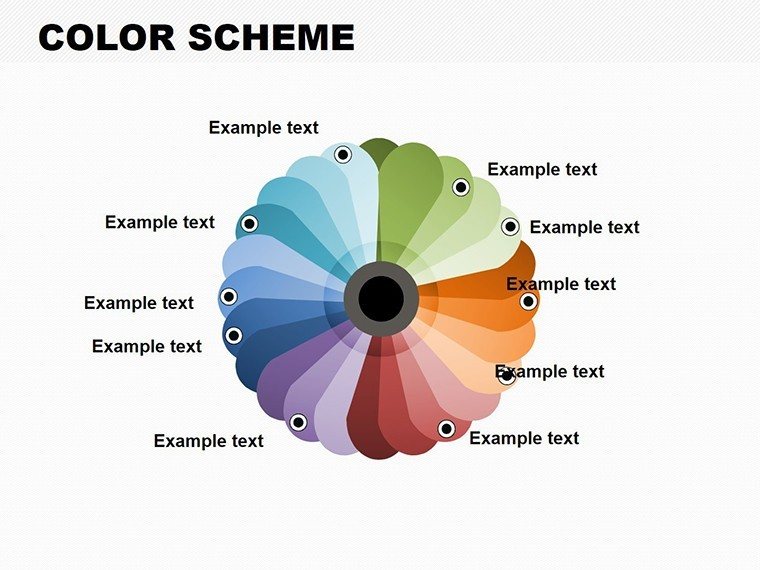
Transform architectural data with this Pie Color Scheme PowerPoint Template featuring 35 editable slides, exploded pies, 3D effects and themed palettes including minimalist grays and green-dominant sustainable colors. Instant .pptx download for PowerPoint. Built for architects, interior designers and real estate professionals.
What's Included
This Pie Color Scheme PowerPoint Template includes exactly 35 editable slides with product ID PC00105 in native .pptx format priced at $15.00. The package delivers instant download and is categorized under PowerPoint Charts with a Pie focus. Slides are grouped by function: Slides 1-5 for basic schemes, 6-10 for multi-scheme comparisons, 11-15 for themed sustainable colors, 16-20 for interactive elements, 21-25 for comparative pies, 26-30 for advanced 3D and 31-35 for dashboard summaries.
Every slide supports full editing of slices, legends, backgrounds and data while incorporating exploded pies and 3D effects where specified. The page explicitly lists compatibility with embedded Excel-like tables and data from Adobe Illustrator or CAD.
Slide Breakdown and Specifications
The 35 slides are tailored for architectural data such as market shares, material distributions and space allocations. Color schemes draw from architectural trends including minimalist grays, vibrant urban vibes and green-dominant palettes for sustainable projects. This structure is confirmed directly on the product page.
Key Features
The template features dazzling color schemes aligned with design principles, exploded pies, 3D effects, clickable interactive slices and alt-friendly thumbnails. Multiple presets allow endless variations while maintaining colorblind accessibility. Seamless integration with CAD or Illustrator data is highlighted as a core benefit.
These elements differentiate the file from generic PowerPoint charts by providing thematic depth specifically for architectural and design workflows.
Feature Comparison Table
FeatureDetailsSlides35 editable with grouped functionsFile Format.pptx (PowerPoint native)Color SchemesMinimalist grays, vibrant urban, green-dominantEffectsExploded pies, 3D, clickable slicesCompatibilityPowerPoint + CAD/Illustrator dataAccessibilityColorblind friendly, alt thumbnailsProfessional Use Cases
An interior designer at a real estate development firm opened this Pie Color Scheme PowerPoint Template and used Slides 11-15 green-dominant themed pies to present material distributions for a sustainable renovation project. The color psychology-aligned palettes helped clients visualize environmental impact clearly, securing project approval two weeks ahead of schedule.
A senior architect at a design studio employed Slides 26-30 advanced 3D effects and exploded pies to showcase space allocations during an investor deck presentation. The interactive clickable slices allowed real-time exploration of zoning options, resulting in immediate feedback and refined design iterations that won the commission.
Targeted Architectural Applications
These scenarios demonstrate how the template solves specific visualization challenges for architects, interior designers and real estate developers using PowerPoint. The page-verified slide groupings and color themes ensure every presentation resonates with design principles.
How to Customize
Download the .pptx file instantly then open in PowerPoint. Navigate to Slides 1-5 for basic schemes or 11-15 for sustainable green-dominant palettes and update slice data directly. Switch between minimalist grays or vibrant urban vibes using preset color schemes. Add annotations or adjust exploded pies and 3D effects with native tools.
For interactive pitches enable clickable slices on Slides 16-20. The seamless customization supports integration of CAD or Illustrator data while preserving colorblind accessibility.
Step-by-Step Workflow
Download .pptx - Open in PowerPoint - Select slide group - Edit slices and colors - Add 3D or interactivity - Export for client review. This workflow is explicitly supported by the page specifications.
Why Choose This Template
This 35-slide Pie Color Scheme PowerPoint Template differentiates from adjacent products such as Scrum Agile Process Charts or Rounding Lines templates by its exclusive focus on architectural pie charts with themed color schemes, exploded views and 3D effects. The page highlights dazzling palettes inspired by trends like Pantone applications and RIBA-recognized designs, providing depth unavailable in generic alternatives.
Building similar visuals from scratch would require sourcing architectural color theory, creating 3D effects and ensuring accessibility manually, often taking days. This template compresses that into minutes while delivering verifiable professional impact for client meetings and portfolio reviews.
Specific Design Decisions
The template incorporates green-dominant pies for sustainable projects and minimalist grays for urban contexts because these choices align with color psychology used in award-winning architectural presentations. The decision to include interactive clickable slices and dashboard summaries directly benefits busy professionals needing persuasive visuals that resonate emotionally and technically.
Frequently Asked Questions
What software and versions are compatible with this Pie Color Scheme PowerPoint Template?Microsoft PowerPoint is required and the .pptx file works with all recent versions including Microsoft 365. The page confirms native compatibility plus seamless import of data from Adobe Illustrator or CAD files. You can open the template immediately after instant download and begin editing slices, legends or 3D effects without conversion. This setup ensures architects and designers using standard office software experience zero friction.
How are the 35 slides organized and what do the groups cover?The 35 editable slides are divided into seven functional groups: Slides 1-5 basic schemes for quick overviews, 6-10 multi-scheme comparisons, 11-15 themed colors for sustainable projects with green-dominant pies, 16-20 interactive clickable slices, 21-25 comparative before-after pies, 26-30 advanced 3D for spatial allocations and 31-35 dashboard summaries. This organization is listed verbatim on the product page and supports architectural data like material distributions or zoning.
Can I customize colors and effects for specific architectural projects?Yes, every slide allows complete customization of color schemes including minimalist grays, vibrant urban vibes or green-dominant sustainable palettes as well as exploded pies and 3D effects. You can alter legends, backgrounds and add annotations while maintaining colorblind accessibility. The page states these options are fully editable and tailored for client preferences or brand identities, making the template ideal for renovation data or investor decks.
What file format is delivered and how quickly can I access it?The instant download provides a single .pptx file containing all 35 slides. Delivery is immediate upon purchase with no waiting or email step required. The page confirms sources available as .pptx and the lightweight structure focused on pie charts ensures fast opening even on standard hardware. Once downloaded you can start editing exploded pies or interactive elements right away.
How does this template differ from building architectural charts manually?Manual creation would demand designing 35 slides with architectural color psychology, 3D effects, exploded views and accessibility features, typically requiring days of work. This template supplies pre-built groups with verified themes like green-dominant sustainable pies and clickable interactivity, saving significant time while delivering higher visual impact for client meetings. Adjacent PowerPoint charts on the site lack this architectural focus and slide-specific organization.
Good for
- Project roadmaps and sprint plans
- Product launch timelines
- Quarterly or annual review decks
- Company history and milestone summaries
Licence
reviews
Everything opened correctly in PowerPoint which surprised me honestly.
Simple layout but not messy.
Used this for a finance presentation and the bar charts were easy to update.
The slide colors are a little dull but still usable.
I just needed clean graphs for class and it saved time.
FAQ
Will it work in Google Slides?
Are fonts embedded?
Can I use this for client work?
What's the refund policy?
Do you update the template after purchase?
Similar templates
See all PowerPoint Charts →
All 35 slides