 Click to zoom
OIL PowerPoint Diagram Template
| Format | .pptx |
| Slides | 10 unique layouts |
| Aspect ratio | 16:9 |
| Compatibility | PowerPoint |
| Animated | No |
| Language | English |
| License | Commercial |
| File size | — |
| Version | v1.0 |
| Last updated | January 2025 |
What's inside
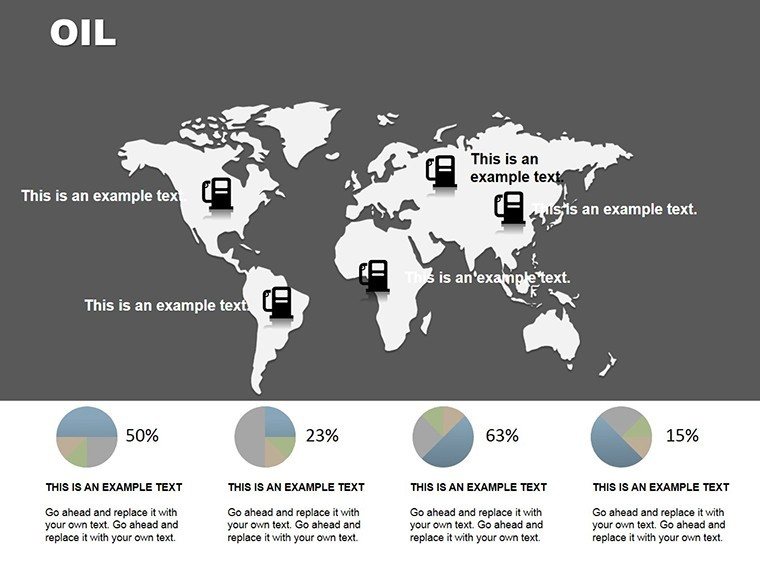
In the high-stakes world of energy, where every process step counts, clarity can make or break a briefing. The OIL PowerPoint diagram template rises to that challenge, offering a graphical lifeline for engineers, executives, and educators explaining extraction to refinement. This 10-slide powerhouse distills complex oil production into intuitive visuals, from drilling depths to distribution networks, helping you convey operations without the fog of fine print.
Rooted in real-world workflows, it uses layered diagrams to provide those "aha" memory hooks - far superior to pasting walls of text into slides. At $19, you unlock .pptx files compatible with PowerPoint 2016 onward, complete with editable paths and icons that adapt to your specifics. It's the unassuming hero for reports that need to inform fast and stick longer.
Key Components Fueling This Template
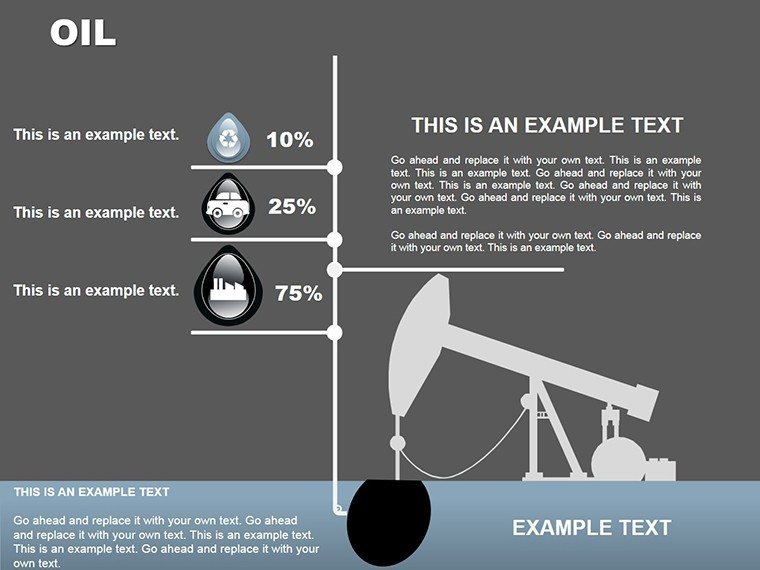
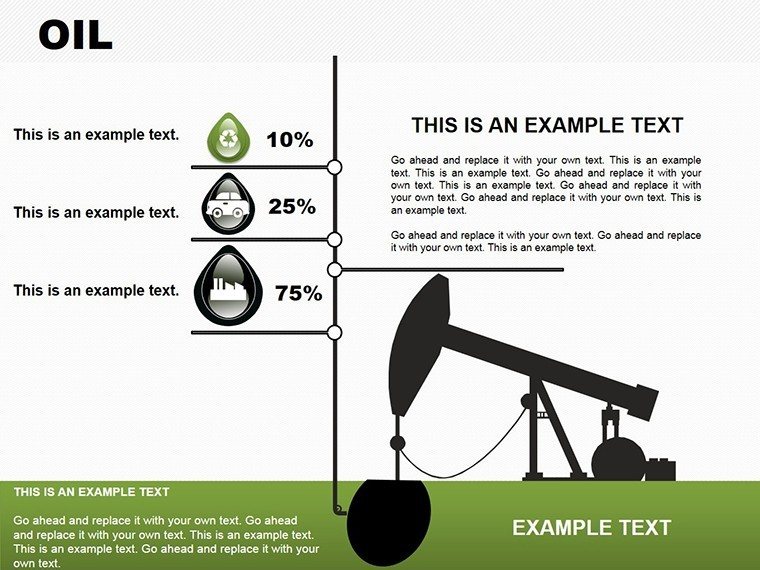
The deck unfolds like a production line itself. Slide 1 lays the foundation with a vertical flow from reservoir to rig, using pipeline icons for seamless progression. By slide 5, horizontal breakdowns detail separation stages, with valves and tanks as customizable markers.
- Process Flows: Linear diagrams on slides 2, 6, and 9 trace extraction sequences, editable for site-specific tweaks.
- Layered Schematics: Cross-sections on slide 3 reveal subsurface actions, scalable for detail levels.
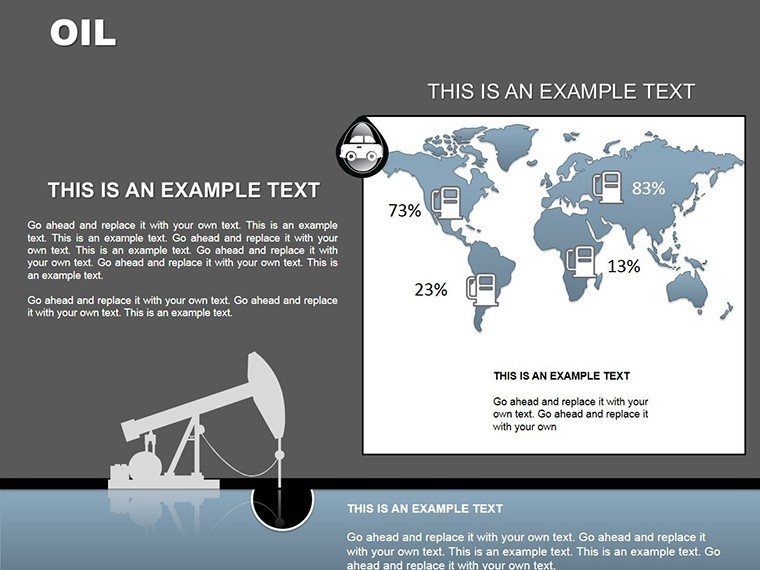
- Distribution Nets: Radial maps on slide 7 connect refineries to markets, with adjustable radii.
- Icon Libraries: Over 20 oil-themed vectors across slides, recolorable for safety or brand accents.
These elements aren't rigid; swap a pump icon for a compressor or elongate paths to match your pipeline lengths, ensuring the visuals mirror your reality without rework.
Practical Scenarios: Drilling Down to Details
Picture an operations manager at an upstream firm, echoing tactics from SPE journal overviews. He deploys slide 4's rig schematic to walk investors through drilling phases, arrows illuminating pressure builds that text alone might muddle. The graphical punch fosters trust, turning skeptics into supporters.
In training modules, slide 8's refinement cascade educates new hires on quality controls - valves as checkpoints, flows as efficiencies. It's a visual shorthand that accelerates onboarding, much like proven simulations in industry handbooks.
Streamlined Setup: From Concept to Crude
- Access the File: Launch .pptx and scan slides for your entry point - start with overview flows.
- Input Phases: Label diagram segments with your process names, auto-fitting text curves.
- Enhance Layers: Add depth via shadow effects on tanks, highlighting critical junctures.
- Validate Flow: Trace paths in edit mode to ensure logical continuity.
- Finalize Output: Animate segment reveals for paced delivery, exporting to video if needed.
This methodical approach condenses weeks of diagramming into an afternoon, freeing you for strategic talks over slide surgery.
The Edge in Energy Visuals
Standard PowerPoint shapes falter under technical weight; this template thrives, with purpose-built diagrams that honor the industry's intricacies. Ten slides strike the balance - concise yet comprehensive - avoiding the bloat of mega-decks. It's trusted by pros who know a single misaligned flow can confuse, while aligned ones clarify.
Boost it with hyperlinks on valve icons to appendices, or integrate data links for live updates during volatile market pitches. Ultimately, it transforms rote recitals into riveting rundowns, positioning you as the go-to for grounded insights.
Power up your next energy narrative - secure the OIL template today and flow through presentations with unflappable finesse.
Frequently Asked Questions
What makes these diagrams suitable for oil production?
The 10 slides focus on extraction, refinement, and distribution flows, with industry-relevant icons and paths.
Can I modify the process sequences?
Yes, rearrange elements and edit labels to reflect your unique operations.
Which PowerPoint versions are supported?
Fully compatible with 2016 and later; basic shapes work in older editions.
Are there icons for safety elements?
Editable icons include valves and barriers, adaptable for hazard highlights.
How do I add quantitative data?
Insert metrics into text boxes along flows; pair with simple gauges for volumes.
Good for
- Project roadmaps and sprint plans
- Product launch timelines
- Quarterly or annual review decks
- Company history and milestone summaries
Licence
reviews
I Liked the clean diagram lines but some shapes felt too small for longer text.
Used it for a school presentation and the circle layout made my topic easier to explain.
Not bad overall, just wish there were more icon options inside the slides.
Downloaded this last night for a process diagram and it worked better than drawing everything myself.
The Flowchart style made my office report less boring to look at.
FAQ
Will it work in Google Slides?
Are fonts embedded?
Can I use this for client work?
What's the refund policy?
Do you update the template after purchase?
Similar templates
See all Powerpoint Diagrams →

All 10 slides