 Click to zoom
Namibia Keynote Maps: 37 Editable Slides for Stunning Presentations
| Format | .pptx |
| Slides | 37 unique layouts |
| Aspect ratio | 16:9 |
| Compatibility | PowerPoint |
| Animated | No |
| Language | English |
| License | Commercial |
| File size | — |
| Version | v1.0 |
| Last updated | April 2025 |
What's inside
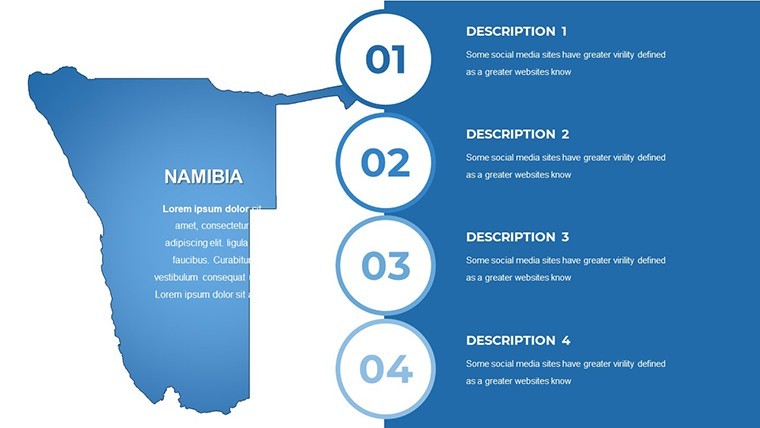
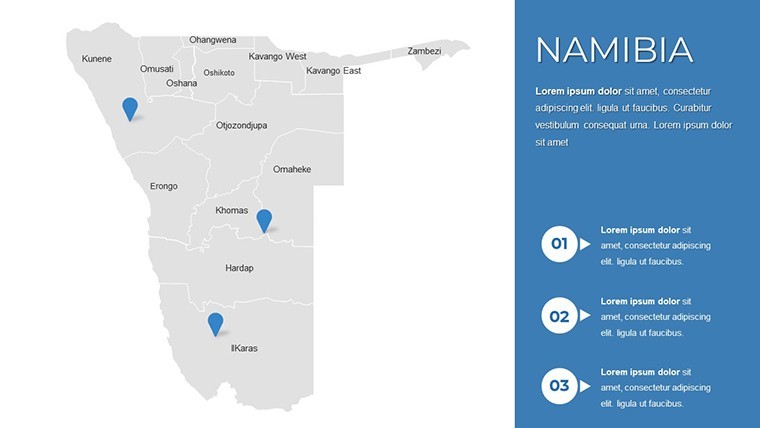
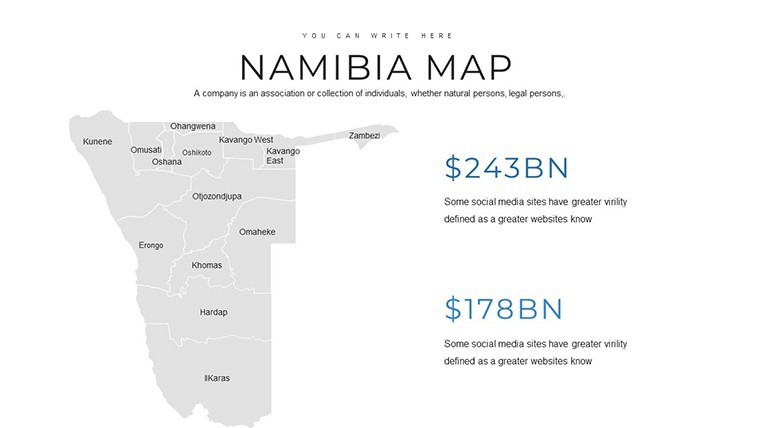
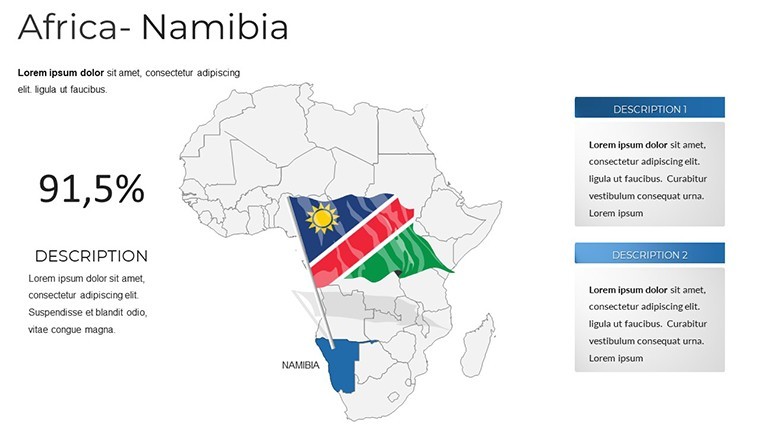
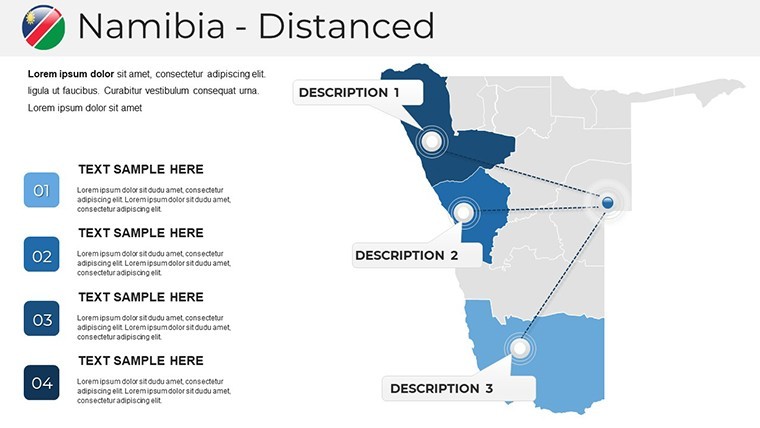
In the world of professional presentations, where clarity meets creativity, the Namibia Keynote Maps template stands out as a versatile tool designed to transform how you communicate geographical insights. Whether you're an architect mapping out sustainable urban developments in Windhoek or a business strategist outlining market expansions across Namibia's diverse regions, this template offers 37 fully editable slides that blend precision with aesthetic appeal. Imagine turning complex data on regional topography, city layouts, and border delineations into compelling narratives that captivate stakeholders. Crafted with Keynote's seamless compatibility in mind, these maps aren't just visuals - they're gateways to better decision-making, helping you highlight everything from environmental impact assessments to tourism infrastructure plans. With customizable colors, texts, and layouts, you can align every element to your brand's voice, ensuring your audience walks away inspired and informed.
Unlocking the Power of Geographical Visualization in Your Work
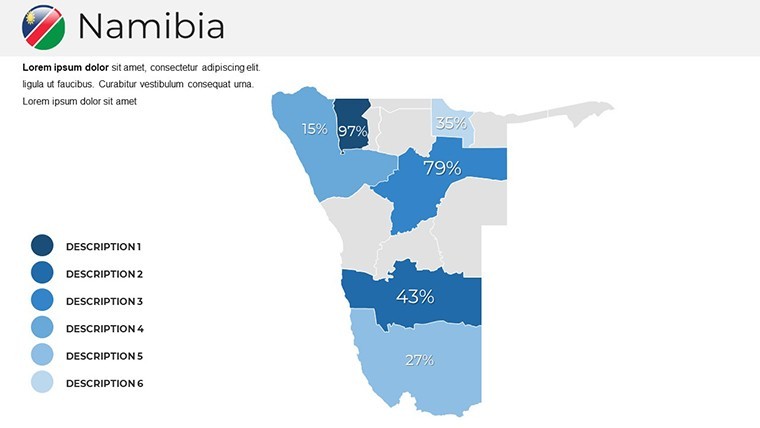
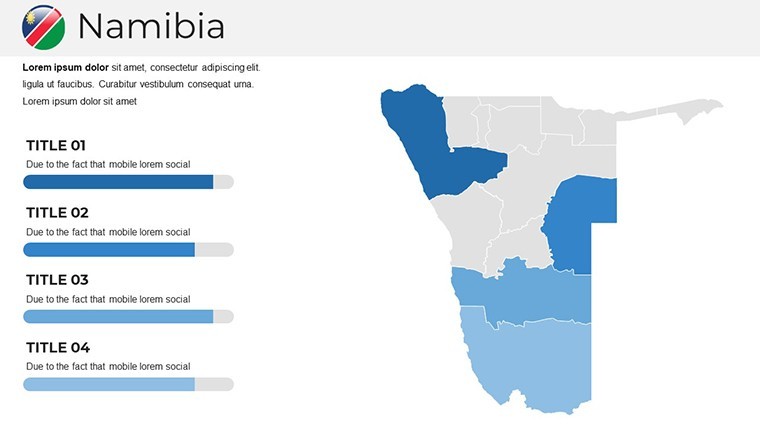
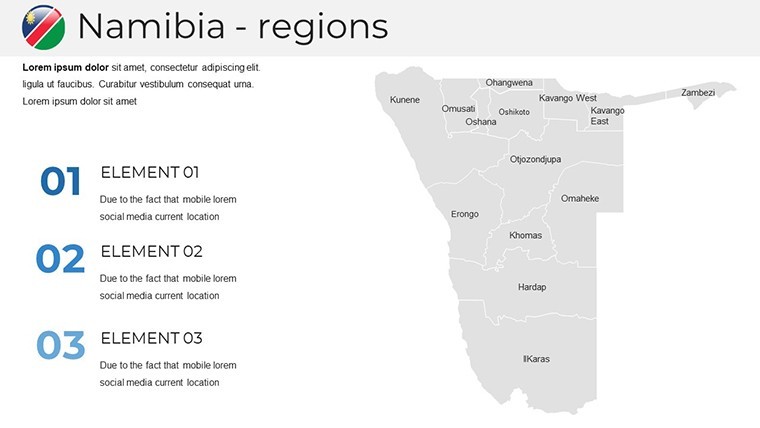
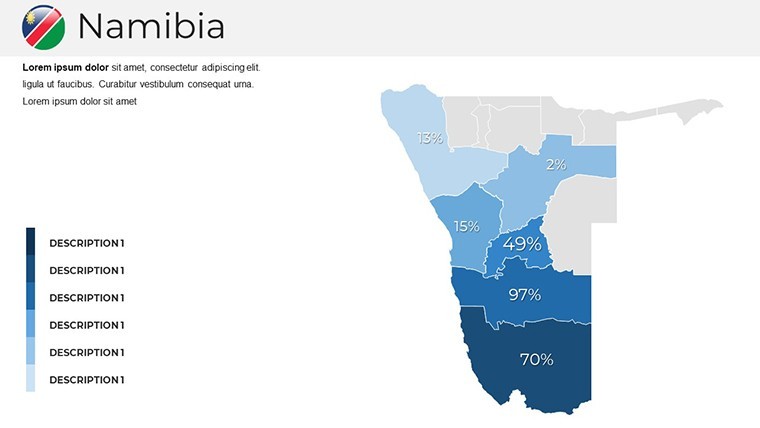
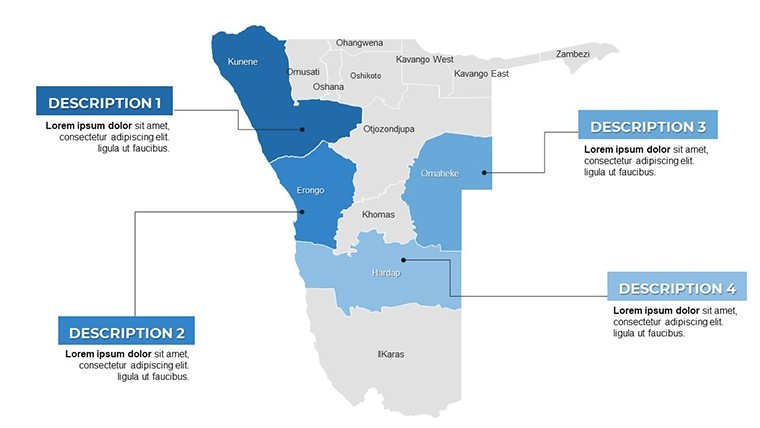
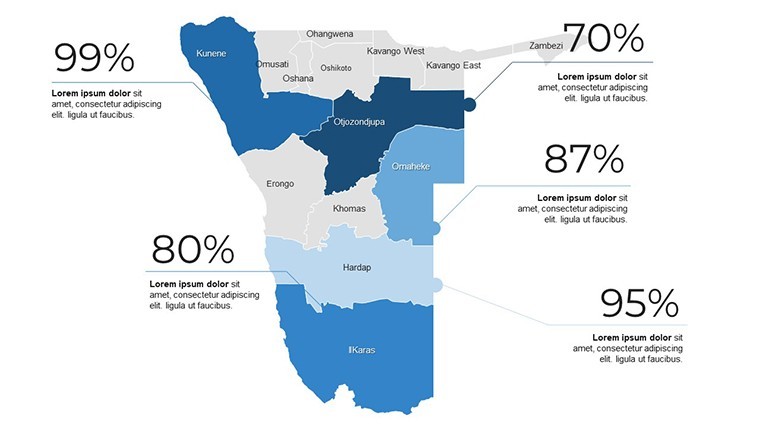
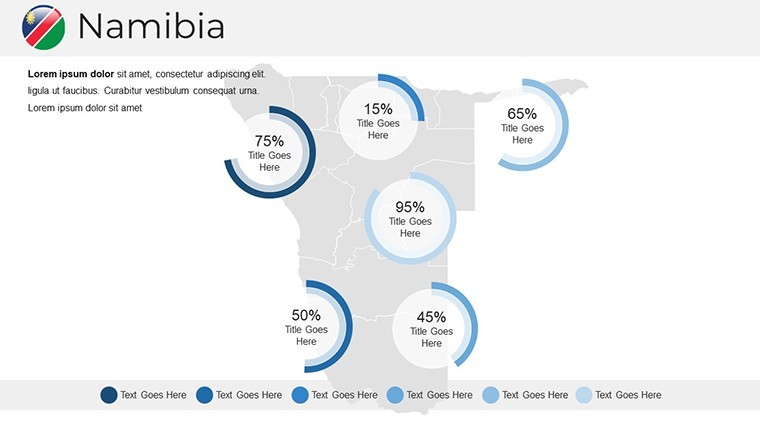
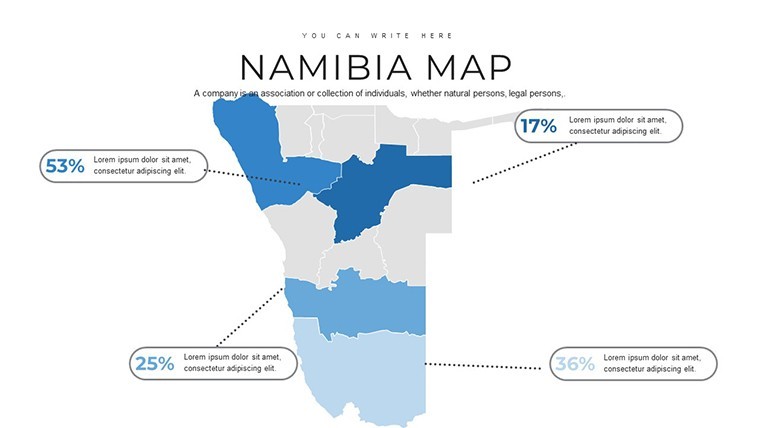
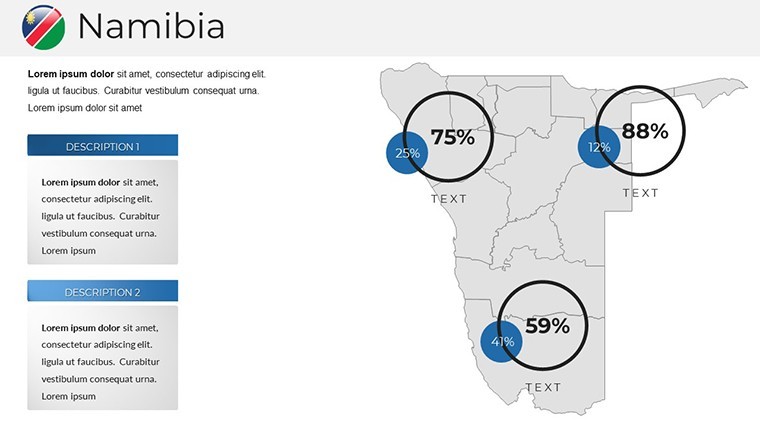
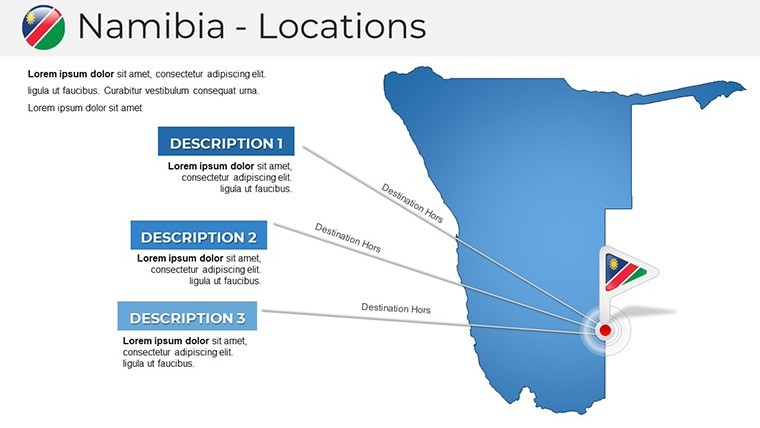
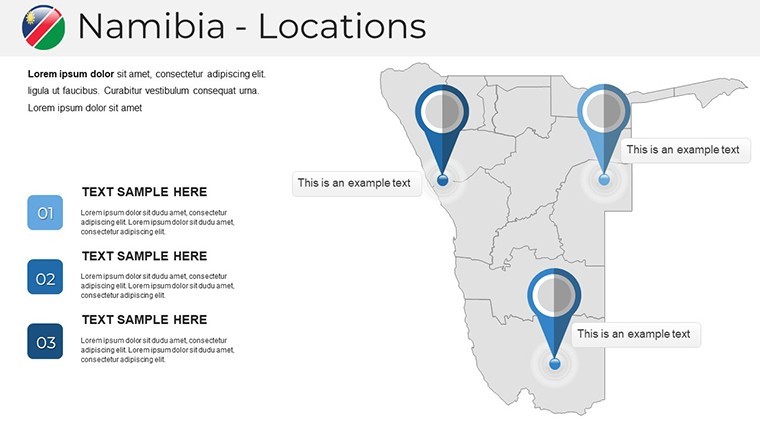
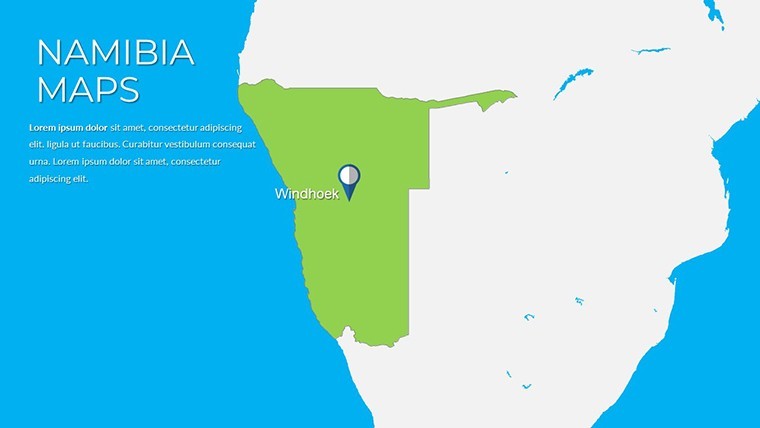
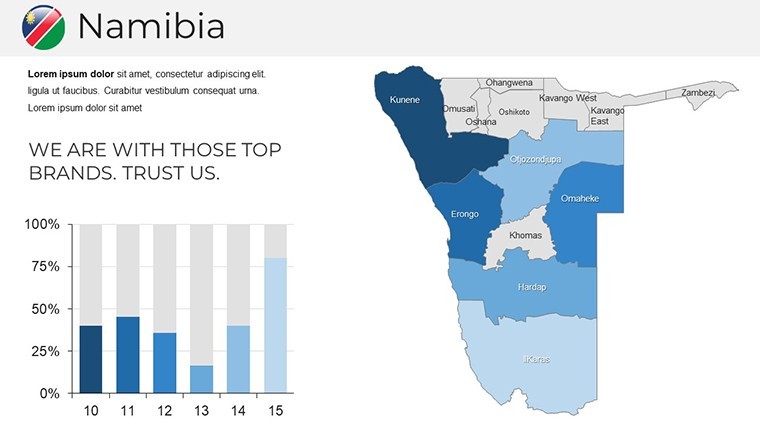
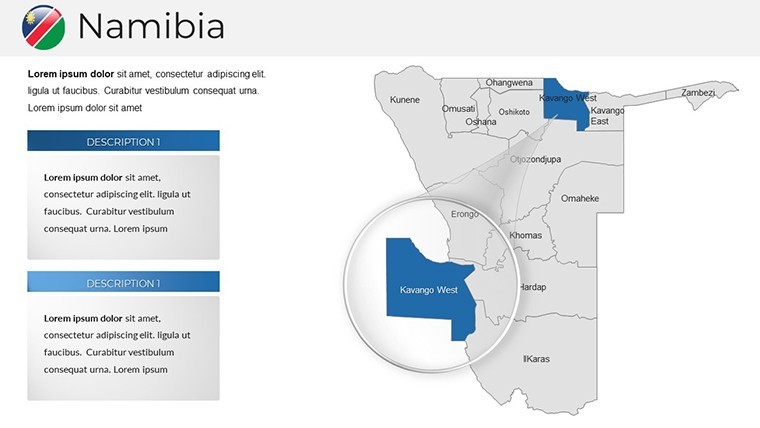
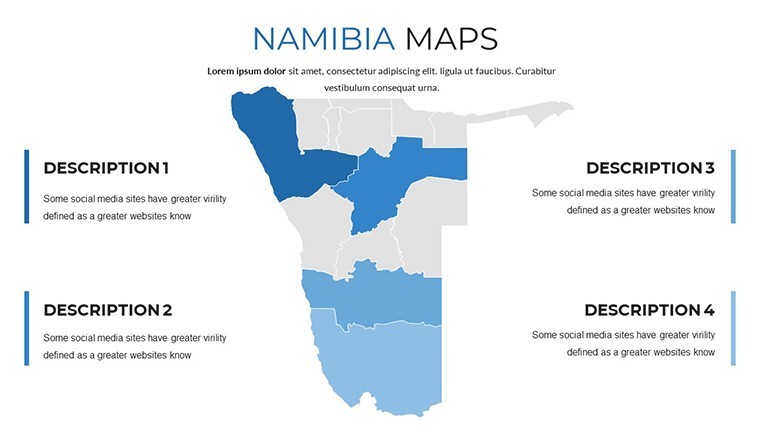
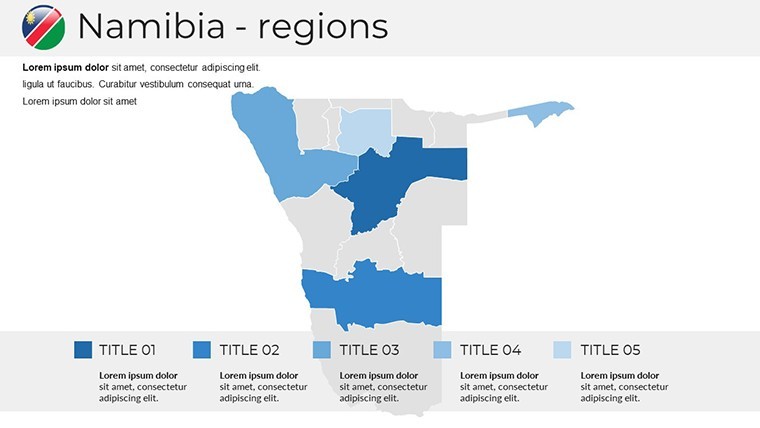
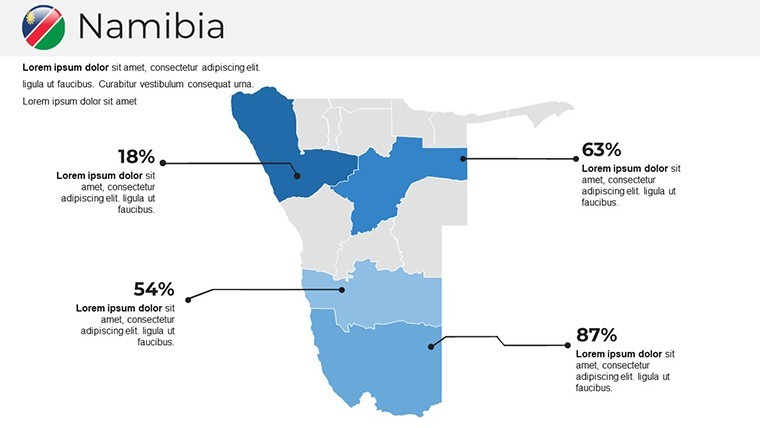
As an architect or urban planner, you know the challenge of presenting site analyses that resonate. This Namibia Keynote Maps template addresses that head-on by providing detailed political and geographical maps that allow you to zoom into specific areas like the Namib Desert or coastal zones. For instance, one slide features a high-resolution map of Namibia's provinces, where you can overlay data on population density or infrastructure needs - perfect for pitching eco-friendly building projects compliant with AIA standards for sustainable design. Business professionals can use these to illustrate supply chain logistics, showing how routes from Walvis Bay harbor connect to inland cities, reducing the guesswork in expansion strategies. Educators, meanwhile, find value in the interactive elements, turning lessons on African geography into engaging sessions that spark curiosity among students. The template's versatility extends to researchers analyzing climate patterns, where customizable icons represent wildlife corridors or mining sites, making abstract concepts tangible.
Key Features That Set This Template Apart
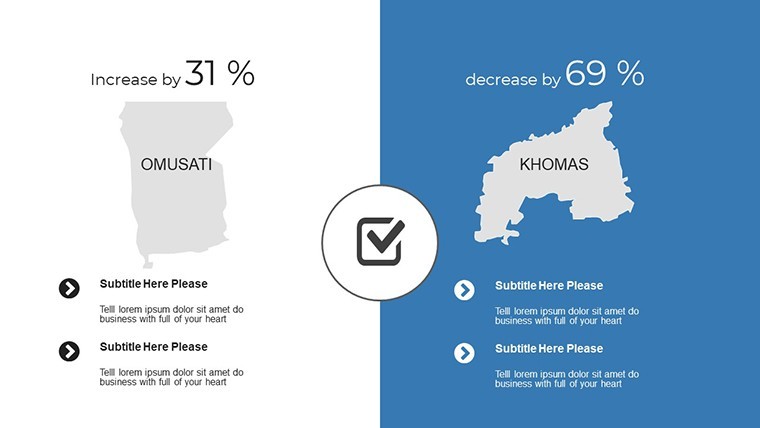
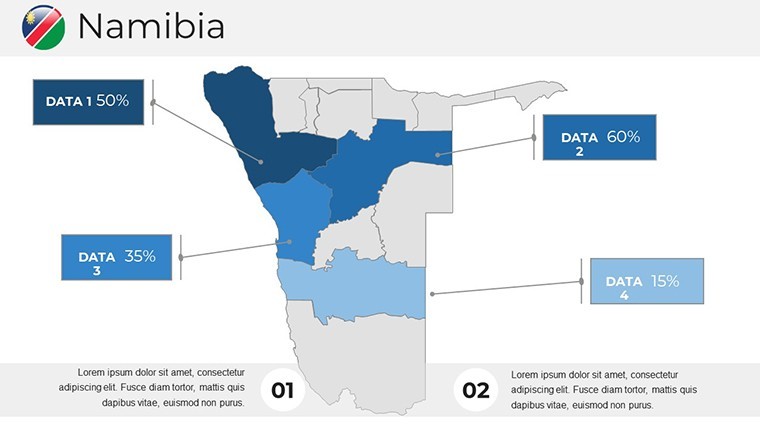
Diving deeper, the 37 slides are packed with features tailored for real-world applications. Each map is vector-based for scalability without quality loss, ensuring crisp visuals on any screen size. Customization is effortless: adjust border thicknesses to emphasize disputed areas or change color schemes to match seasonal themes, like earthy tones for desert-focused presentations. Built-in infographics allow integration of charts showing economic growth in regions like Khomas, while thematic layers support overlays for demographic shifts - crucial for architects planning community developments. Compatibility with all Keynote versions means no technical hurdles, and the drag-and-drop interface saves hours compared to building maps from scratch in basic software. Unlike generic tools, this template includes pre-labeled cities and natural features, reducing errors and enhancing trustworthiness in your deliverables.
- Comprehensive Coverage: Slides dedicated to full-country overviews, regional breakdowns, and zoomed-in city maps.
- Editable Elements: Fonts, colors, and shapes fully modifiable to fit your narrative.
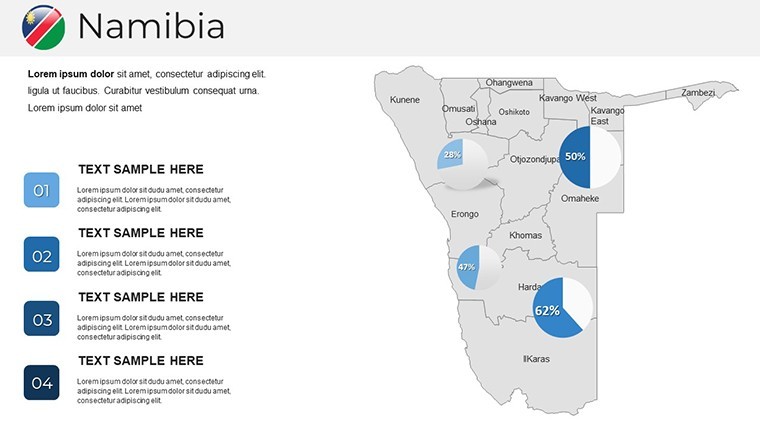
- Data Integration: Easy addition of pie charts or bar graphs for statistical emphasis.
- Professional Polish: High-quality graphics that align with industry standards for visual communication.
Real-World Applications: From Boardrooms to Classrooms
Picture this: You're an architect presenting a proposal for a new eco-resort in Etosha National Park. Using slide 15's detailed topographic map, you overlay proposed building sites, highlighting how designs minimize environmental disruption while maximizing views - backed by real data from sources like the Namibia Ministry of Environment. This not only demonstrates expertise but builds trust with clients. For business users, slide 22's market analysis map helps visualize export routes, turning dry statistics into a story of opportunity. Educators can adapt slide 5's basic outline for interactive quizzes, fostering deeper understanding of Namibia's biodiversity. In research contexts, combine multiple slides to create timelines of urban growth, perhaps referencing case studies from successful projects like the Windhoek redevelopment, where similar mapping tools aided in securing funding. The template's flexibility means you can iterate quickly, testing different color palettes to evoke urgency in climate reports or calmness in tourism pitches.
Step-by-Step Guide to Maximizing Your Template
- Open the .key file in Keynote and select your base map slide.
- Customize colors to match your brand - try blues for coastal themes or greens for savanna regions.
- Add text labels for key points, like marking Windhoek as a hub for architectural innovation.
- Integrate data visuals, such as graphs showing building permit trends.
- Preview and export for seamless sharing with teams or clients.
This workflow not only streamlines your process but elevates the final output, making your presentations memorable. Compared to standard Keynote maps, this template offers more depth, with themed icons that add flair without overwhelming the core message.
Enhancing Your Expertise with Proven Design Tips
To truly shine, incorporate best practices from design pros. For architectural pitches, use contrasting colors to differentiate urban vs. rural zones, drawing from AIA guidelines on visual accessibility. Avoid clutter by limiting overlays to three per slide, ensuring focus on key benefits like sustainable materials in Namibian builds. Testimonials from users highlight how this template cut preparation time by 50%, allowing more focus on content. In a case study, a firm used it for a urban renewal project presentation, winning a contract by clearly mapping phased developments. Whether you're new to Keynote or a seasoned user, these maps provide the foundation to showcase your authority, turning data into decisions.
Ready to transform your next presentation? This Namibia Keynote Maps template is your key to professional excellence. Download it now and start crafting visuals that inspire action.
Frequently Asked Questions
How customizable are the maps in this template?
Every element, from colors to labels, is fully editable in Keynote, allowing you to tailor them to your specific project needs.
Is this template compatible with other software?
Primarily designed for Keynote, but you can export slides to PDF or images for use in other tools like PowerPoint.
Can I use these maps for commercial purposes?
Yes, once downloaded, they're yours to use in business presentations, reports, or client pitches without restrictions.
What if I need more slides?
The 37 slides cover most needs, but you can duplicate and modify them easily within Keynote.
Are there tutorials for editing?
Keynote's built-in help covers basics, and our support team offers tips for advanced customizations.
Good for
- Project roadmaps and sprint plans
- Product launch timelines
- Quarterly or annual review decks
- Company history and milestone summaries
Licence
reviews
Honestly just wanted something with a clean timeline, this had it.
The font choices are weird on some slides but overall usable.
Used the diagram templates to explain our workflow, my boss liked it.
Icons are modern but there's too many different styles mixed together.
Saved me maybe an hour of work, not life-changing but decent.
FAQ
Will it work in Google Slides?
Are fonts embedded?
Can I use this for client work?
What's the refund policy?
Do you update the template after purchase?
Similar templates
See all Keynote Maps →
All 37 slides