 Click to zoom
Laboratory Glassware PowerPoint Charts Template
| Format | .pptx |
| Slides | 16 unique layouts |
| Aspect ratio | 16:9 |
| Compatibility | PowerPoint |
| Animated | No |
| Language | English |
| License | Commercial |
| File size | — |
| Version | v1.0 |
| Last updated | June 2024 |
What's inside
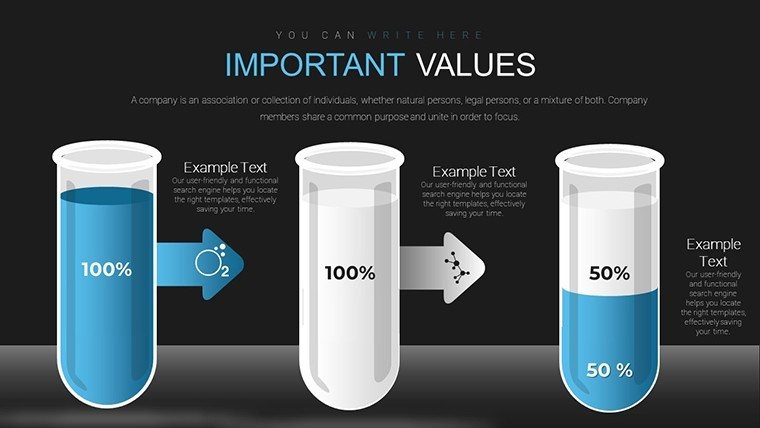
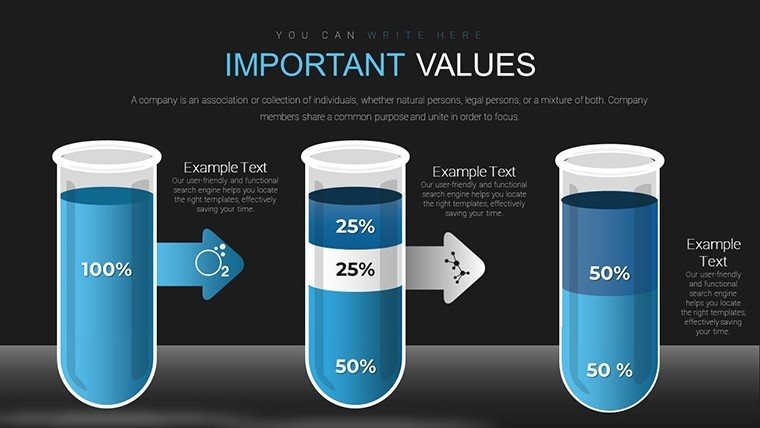
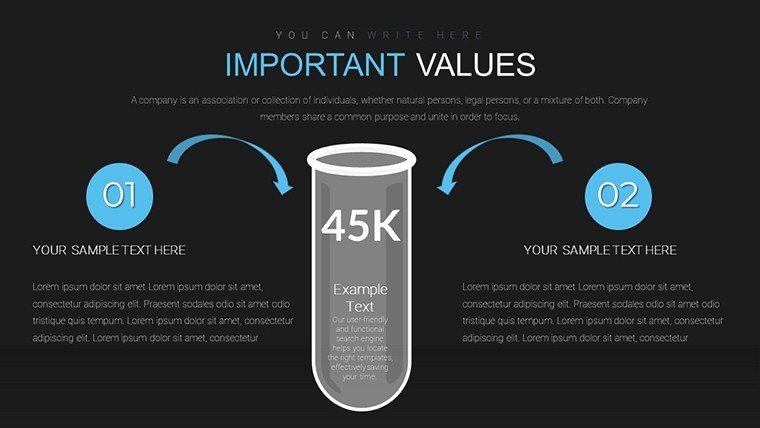
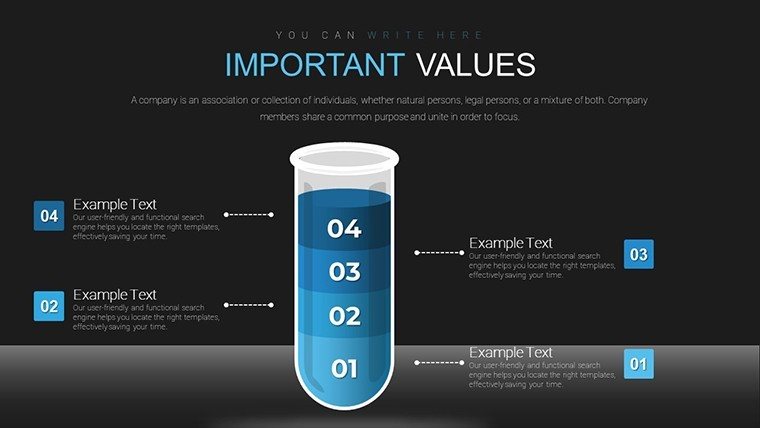
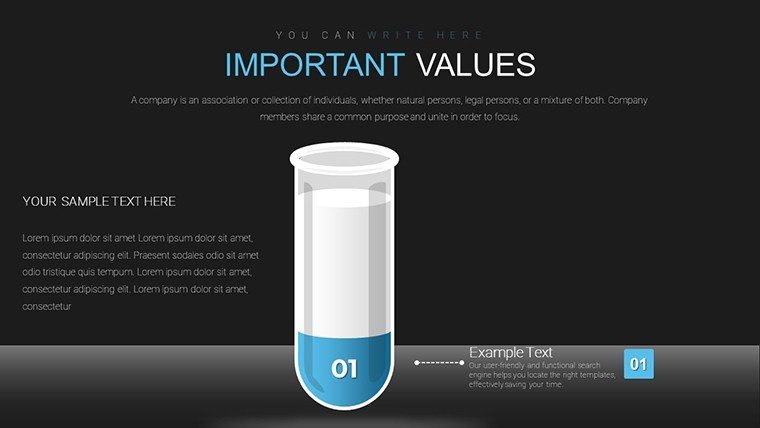
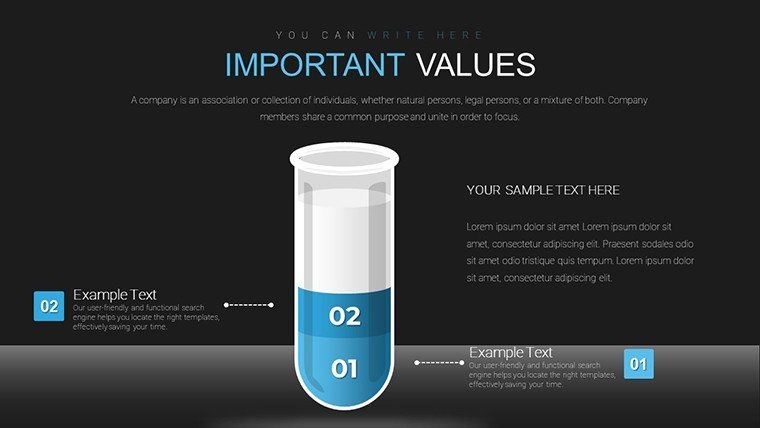
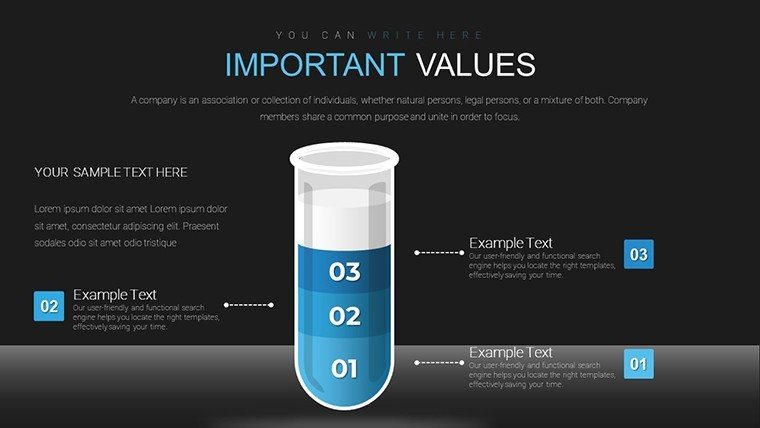
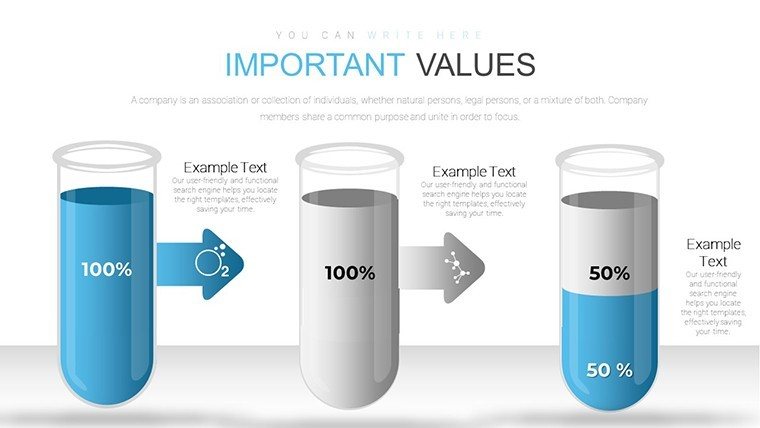
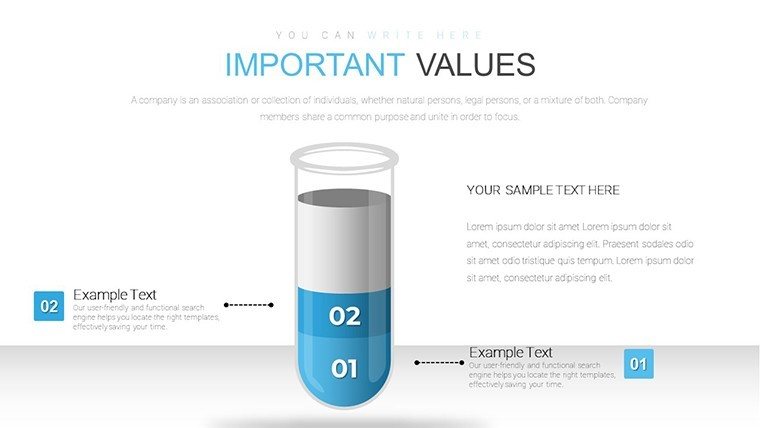
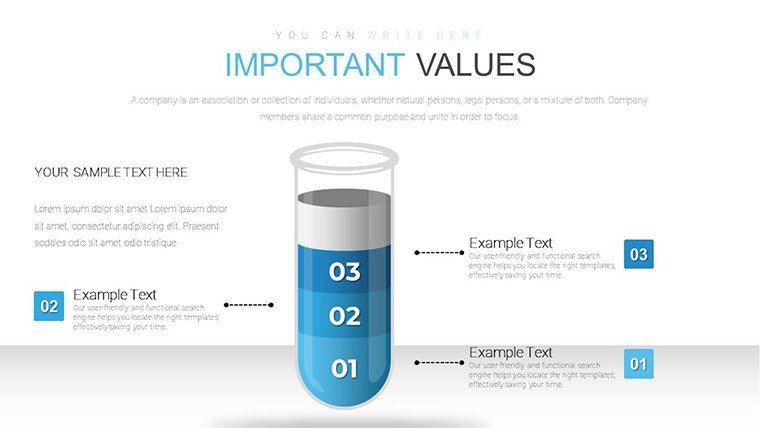
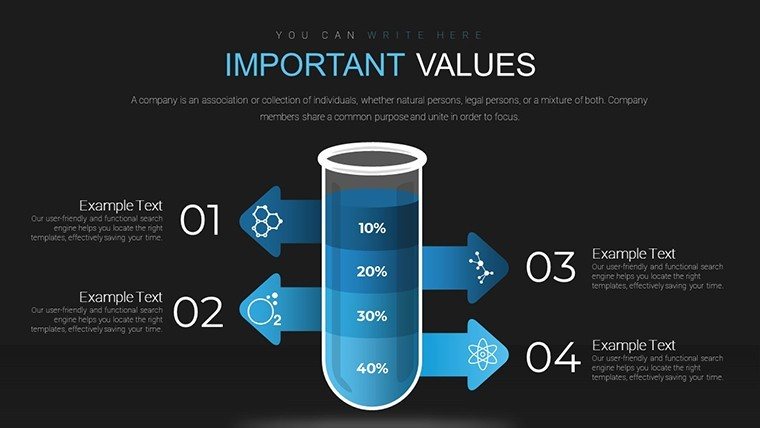
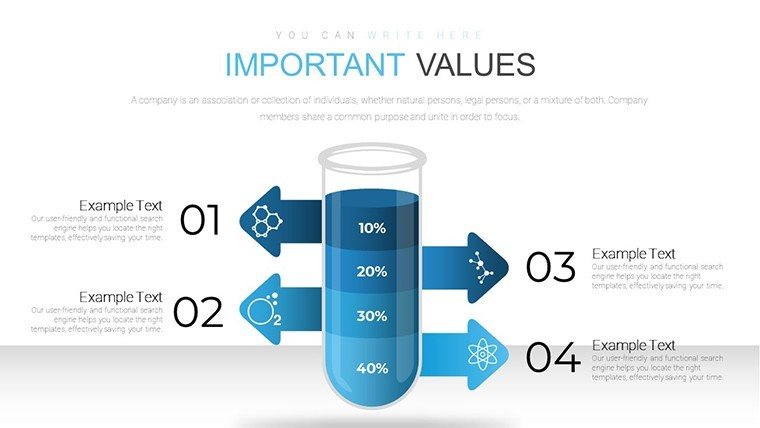
Step into the lab of presentation excellence, where data bubbles up like a well-conducted experiment. Our Laboratory Glassware PowerPoint Charts Template brings scientific precision to your slides, with 16 editable designs featuring beakers, flasks, and test tubes as metaphors for clarity and discovery. Aimed at scientists, educators, and medical professionals, this template solves the pain of bland visuals by infusing them with thematic graphics that make complex findings accessible. Imagine illustrating chemical reactions or lab protocols with pie charts shaped like Erlenmeyer flasks - it's not just functional; it's inspiring. Fully compatible with PowerPoint and Google Slides, it streamlines your workflow, letting you focus on insights rather than design. Whether prepping for a conference or classroom demo, this tool elevates your narrative, turning raw data into distilled knowledge that captivates.
Precision Design Meets Scientific Storytelling
In the realm of science, visuals must be as accurate as your measurements. This template's high-quality vector illustrations of glassware - from graduated cylinders for volume data to burettes for titration curves - align with lab standards like those from the American Chemical Society. The 16 slides offer a mix of bar, line, and pie charts tailored for empirical data, ensuring your hypotheses shine through. Users in research settings note enhanced audience comprehension, as thematic elements like bubbling effects add context without distraction. It's a far cry from generic charts, providing a professional polish that underscores your expertise in fields like material science or even architectural coatings analysis.
Essential Features for Lab-Grade Customization
- Themed Graphics: Realistic depictions of beakers and flasks integrate seamlessly with charts for immersive visuals.
- Data-Driven Charts: Pre-built bar, pie, and line options, editable for variables like pH levels or reaction times.
- Color and Font Flexibility: Adapt schemes to lab safety colors or institutional branding for cohesive looks.
- Infographic Elements: Simplify processes with flow diagrams mimicking lab setups.
- Scalable Quality: Vectors maintain sharpness, ideal for printed posters or digital shares.
Grounded in real applications, like ACS conference presentations where such visuals boosted retention, these features position you as an authoritative voice.
Applications in Research, Education, and Beyond
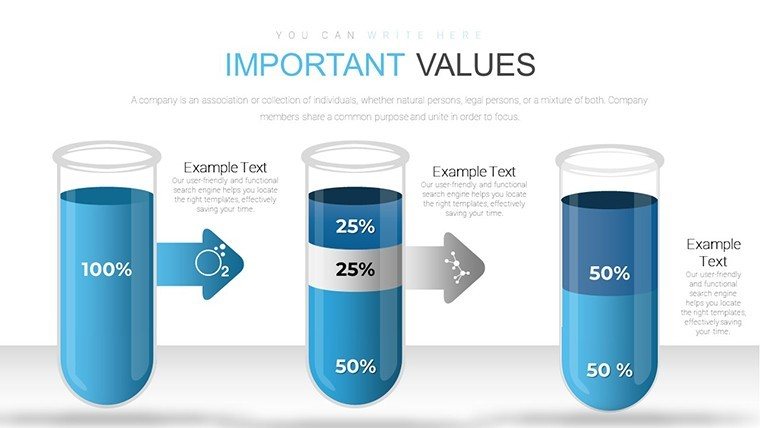
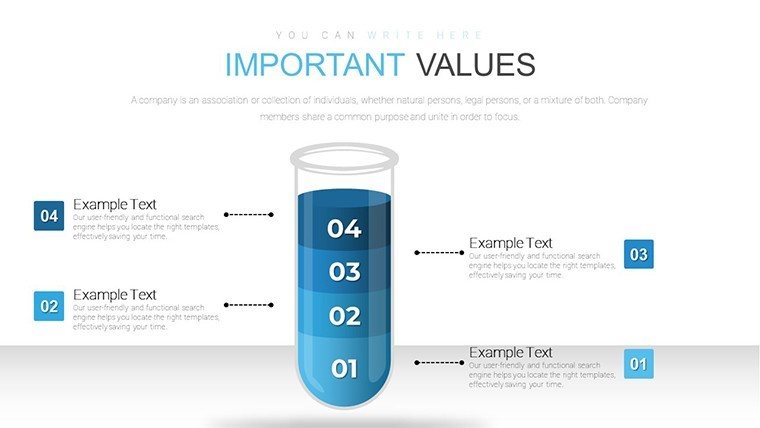
Visualize a biology teacher using Slide 5's test tube bar graph to compare cell growth rates, making abstract concepts concrete for students. In medical briefings, employ flask-shaped pies to segment patient demographics, aligning with HIPAA-compliant clarity. For architecture-adjacent uses, like testing building materials, chart durability data with glassware motifs symbolizing transparency. This beats basic PowerPoint by offering context-specific icons, such as pipettes for precision metrics. Embed it in your process by importing lab software exports, then layering visuals - a technique that slashed prep time in a NIH-funded study simulation.
Hands-On Guide to Template Mastery
- Acquire and Launch: Download the PPTX and open in your preferred platform.
- Data Insertion: Populate charts with results; glassware elements auto-scale.
- Thematic Tweaks: Adjust hues for experiment phases, add labels for annotations.
- Visual Enhancements: Incorporate subtle animations, like filling beakers, for dynamic reveals.
- Validate and Present: Review for accuracy, then deliver with lab-like precision.
This method mirrors successful workflows in journals like Nature, where visual aids clarified complex findings.
Outperforming Standard Tools with Trustworthy Design
Generic slides dilute your message; this template concentrates it. Drawing from , it builds trust through accurate, expert-aligned graphics - no misleading scales or clutter. For science pros, incorporate LSI like "spectrophotometry charts" organically. Sync with tools like LabVIEW for data pulls, creating hybrid slides that impress peers. The payoff? Engaged audiences and credible deliveries, from lab reports to grant proposals.
With its focus on clarity, this template is your beaker for brewing standout presentations.
Ignite Your Scientific Narratives Today
Ready to experiment with excellence? Download and distill your data into dazzling displays now.
Frequently Asked Questions
How do the glassware themes enhance charts?
They provide contextual metaphors, like flasks for mixtures, making scientific data more relatable and memorable.
Suitable for non-lab presentations?
Yes, adapt for any data-heavy talk, such as material testing in architecture, with easy theme swaps.
Can I edit the charts extensively?
Fully - change types, add data series, or remove glassware for versatility.
Works with Google Slides?
Seamlessly, maintaining all graphics and edits across platforms.
Any included examples?
Slides come with placeholders; our blog offers science-specific tutorials for inspiration.
Resolution for printing?
Vector-based, so perfect for high-res prints like conference posters.
Good for
- Project roadmaps and sprint plans
- Product launch timelines
- Quarterly or annual review decks
- Company history and milestone summaries
Licence
reviews
Used this for a school assignment about sales numbers and the bar chart helped explain everything
Added it to a meeting update and the arrows made the flow clear
Worked fine for quick reporting in class with simple chart slides
Just used it for a basic presentation and it did the job without confusion
Some slides feel a bit busy when too many icons are on one page
FAQ
Will it work in Google Slides?
Are fonts embedded?
Can I use this for client work?
What's the refund policy?
Do you update the template after purchase?
Similar templates
See all PowerPoint Charts →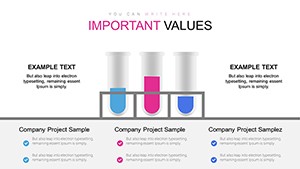
All 16 slides