 Click to zoom
Lab Glassware Keynote Charts - Editable KEY | ImagineLayout
| Format | .pptx |
| Slides | 16 unique layouts |
| Aspect ratio | 16:9 |
| Compatibility | PowerPoint |
| Animated | No |
| Language | English |
| License | Commercial |
| File size | — |
| Version | v1.0 |
| Last updated | April 2026 |
What's inside
Lab Glassware Keynote Charts Template for Science
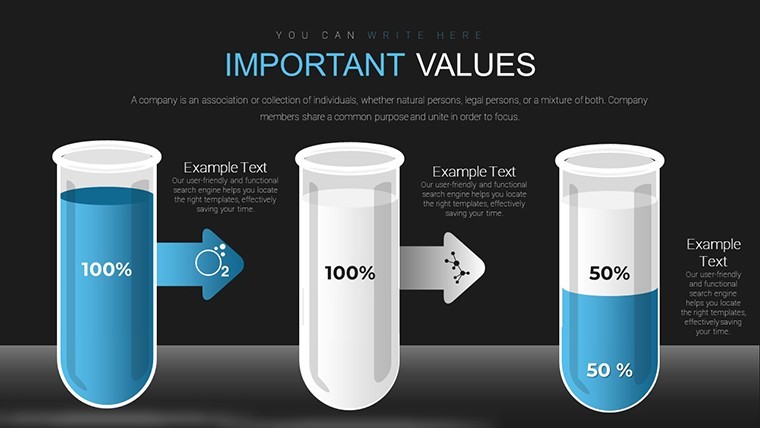
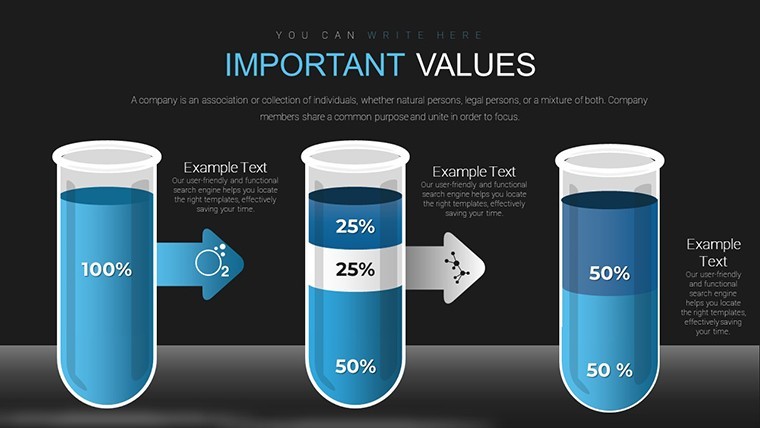
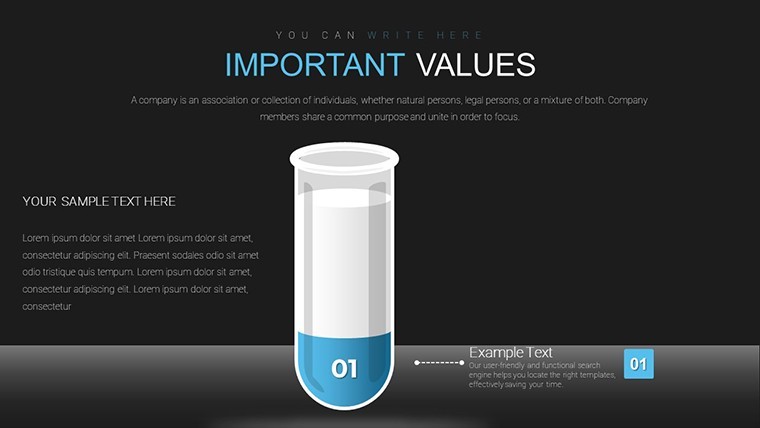
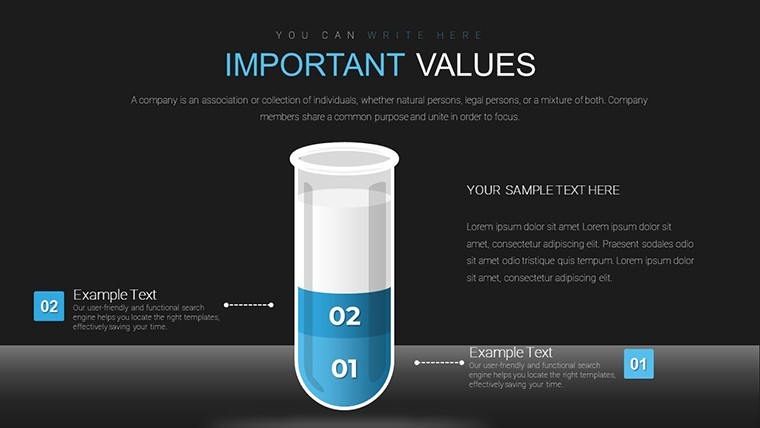
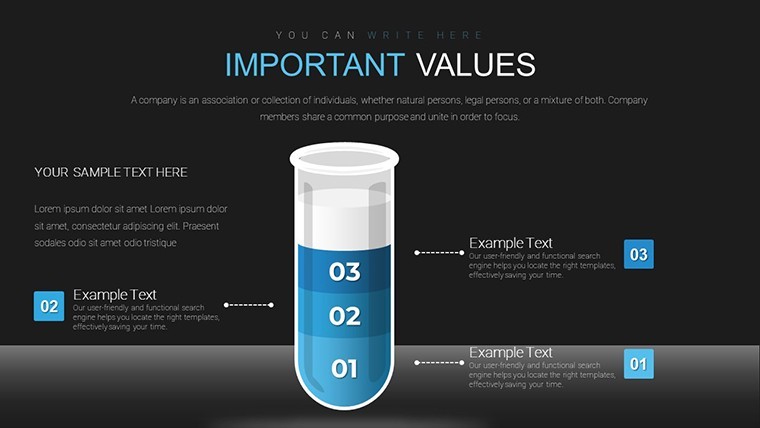
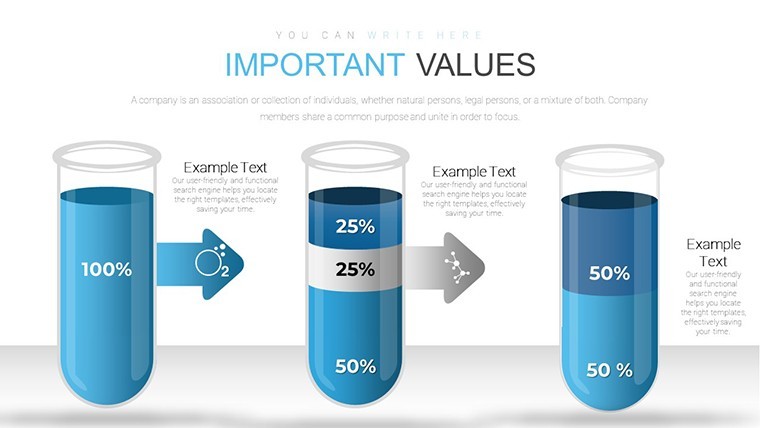
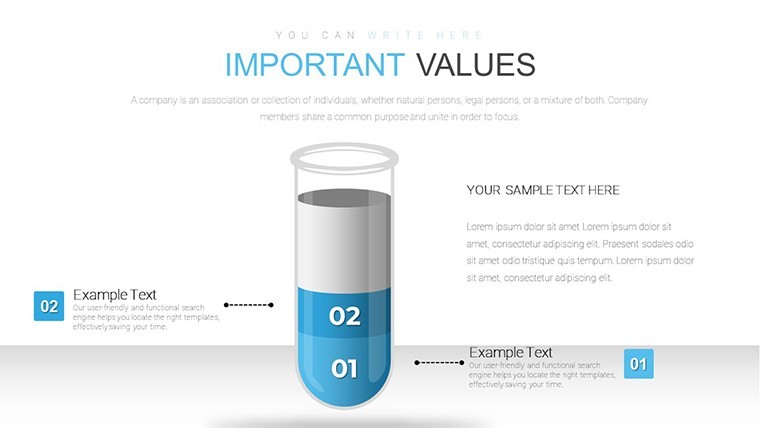
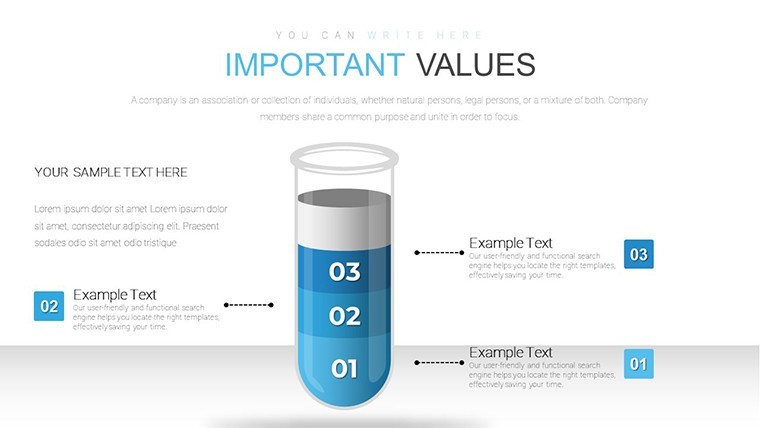
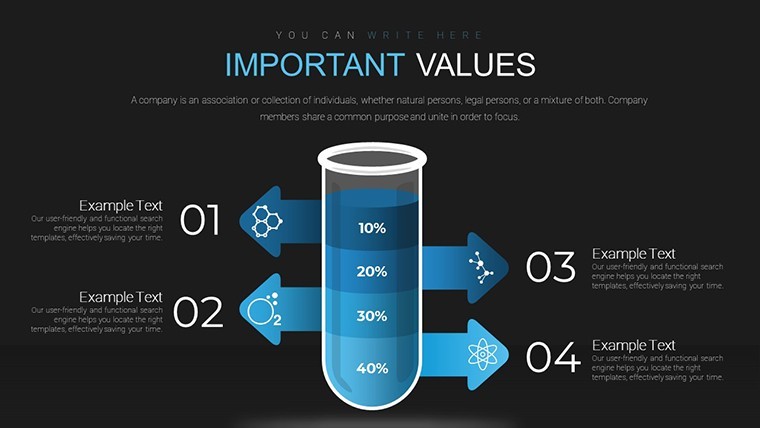
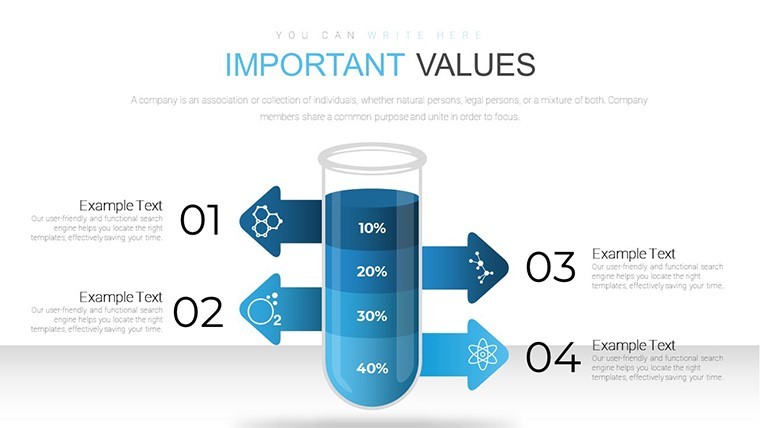
16 lab glassware diagrams come in the KEY file and suit science reports where you compare experimental results side by side.
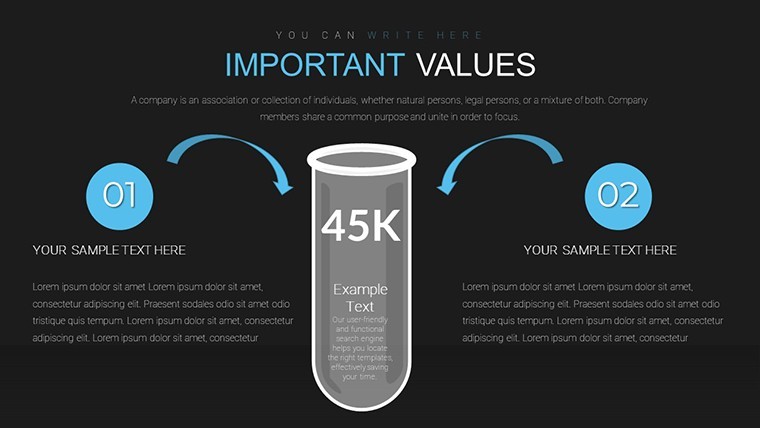
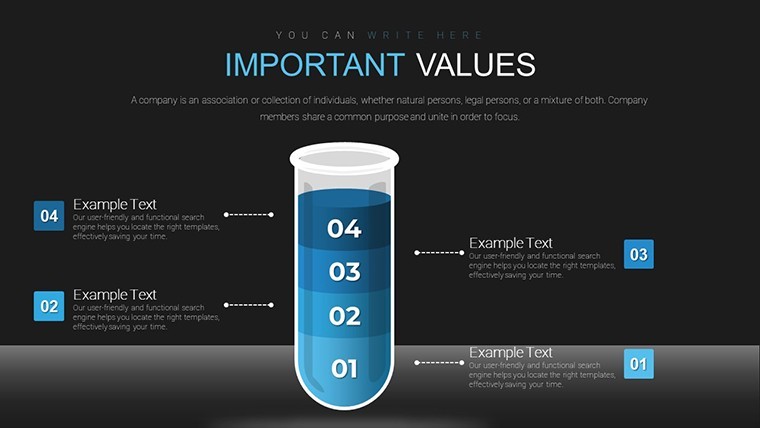
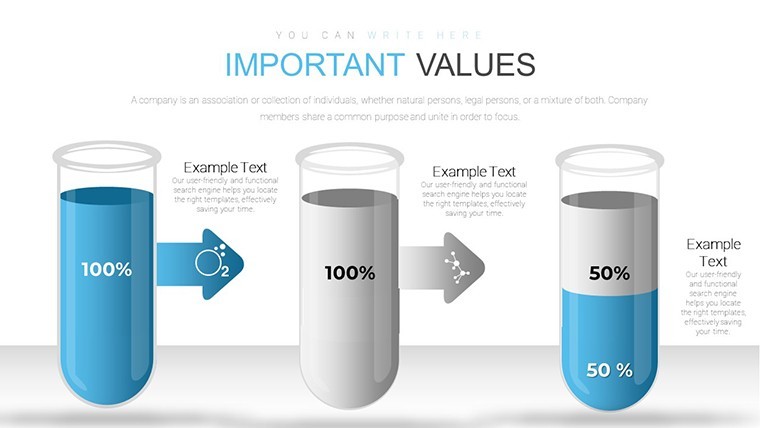
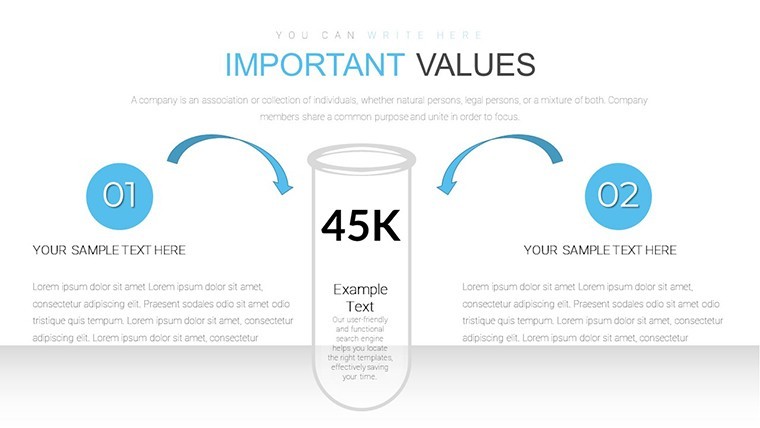
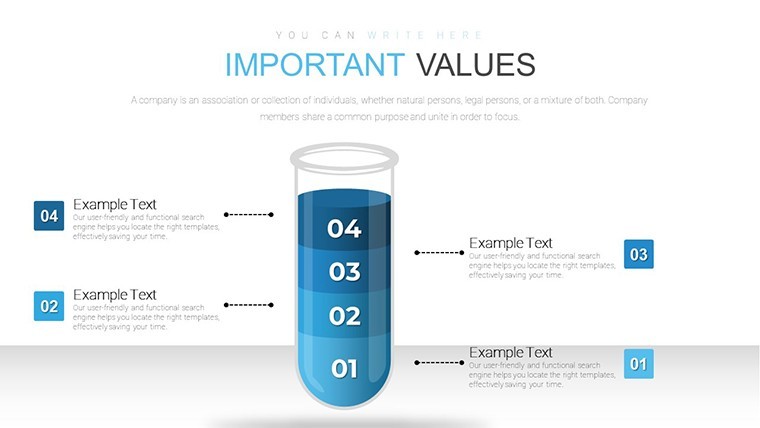
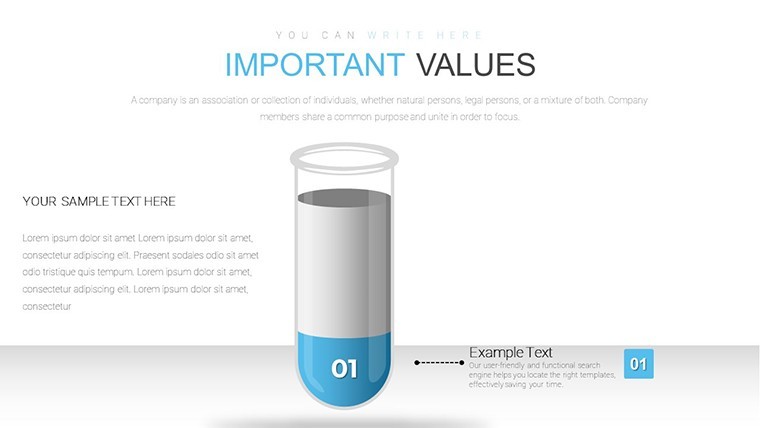
Horizontal test tube bar charts with outline icons display quantitative results while vertical process flows mimic lab procedures and side-by-side glassware shows control versus experimental groups.
You can duplicate slides and reuse the same structure.
The paid version delivers the complete 16 editable slides instead of building from scratch and color changes happen via slide master so the entire deck updates in seconds.
Filled glassware icons with moderate grid spacing keep the layout airy yet precise.
When you need to explain multi-step lab procedures to stakeholders the predefined flows handle the sequence out of the box instead of arranging shapes manually.
Use this instead of building diagrams manually in Keynote.
The side-by-side comparisons clarify control versus experimental outcomes so the team decides on procedure adjustments fast.
This Keynote diagram template supports quantitative analysis in experiments and after viewing the charts viewers can conclude which variables perform best.
The file works across multiple reports and typically teams reuse the same diagram across weekly lab updates.
In most cases you only replace text and adjust colors.
It works best for structured lab data and is not ideal for data-heavy dashboards.
This layout suits lab researchers who present findings regularly yet is not designed for creative storytelling slides.
Check related options like the Biomedical Charts Keynote Template for Science or Chemical Test Keynote Charts.
FeatureDetailsSlides / diagrams16 lab glassware themed charts including test tube bars, process flows and flask summariesFile formatKEYSoftware versionKeynote 12+Color schemesCustomizable via slide master with one-click palette updatesEditable elementsText, icons and bars resize or recolor independently without breaking alignmentAspect ratio16:9Free vs PaidPaid version delivers all 16 editable slides; no free full version listedMasters / BackgroundsSingle master slide for consistent lab glassware stylingEverything is already structured.
Download and start editing immediately
What Keynote version and macOS is required?The template works in Keynote 12 and newer.
It requires macOS 13 or later for full compatibility.
Older versions may show minor alignment issues but the core diagrams remain editable.
How do I change colors via slide master?Open View > Master Slides in Keynote.
Select the master slide and update the color palette in the Format panel.
Close the master view and the change applies to every slide instantly.
Does the license allow client work?Yes the license permits use in client projects.
You can deliver the customized deck to your client but cannot resell the original template files.
One license covers one user account.
What is the difference between free and paid?The paid version provides the complete set of 16 editable slides.
No free version is listed on the page but previews show sample layouts.
The full download unlocks all elements for immediate use.
What are the refund conditions?Refunds are available within 14 days if the template does not meet your needs.
Contact support with your order number to start the process.
Full details appear in the purchase confirmation email.
Good for
- Project roadmaps and sprint plans
- Product launch timelines
- Quarterly or annual review decks
- Company history and milestone summaries
Licence
reviews
Used for a university assignment and it helped organize data quickly
The diagrams are straightforward and easy to edit
I didn’t spend time adjusting layout much
Good for fast work when you don’t care about design too much
Nothing confusing in the structure
FAQ
Will it work in Google Slides?
Are fonts embedded?
Can I use this for client work?
What's the refund policy?
Do you update the template after purchase?
Similar templates
See all Keynote Charts →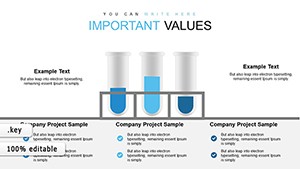
All 16 slides