 Click to zoom
Internal And External Destinations PowerPoint Diagram
| Format | .pptx |
| Slides | 24 unique layouts |
| Aspect ratio | 16:9 |
| Compatibility | PowerPoint |
| Animated | No |
| Language | English |
| License | Commercial |
| File size | — |
| Version | v1.0 |
| Last updated | January 2025 |
What's inside
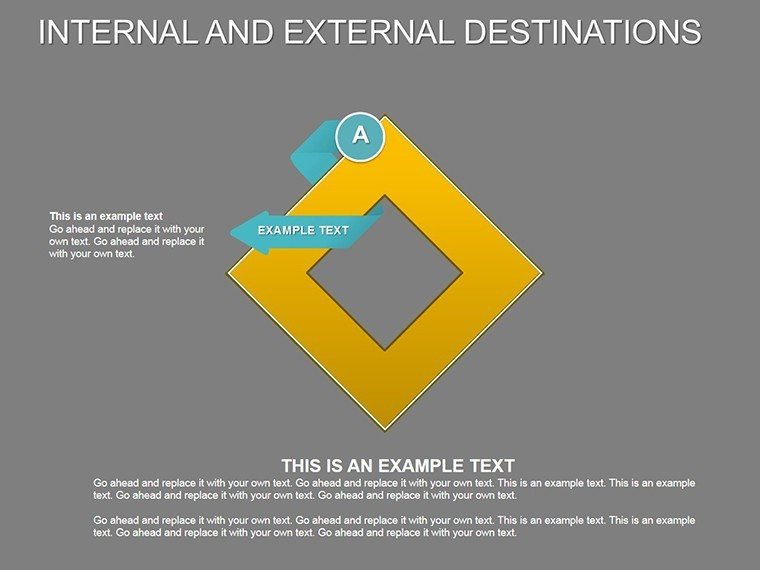
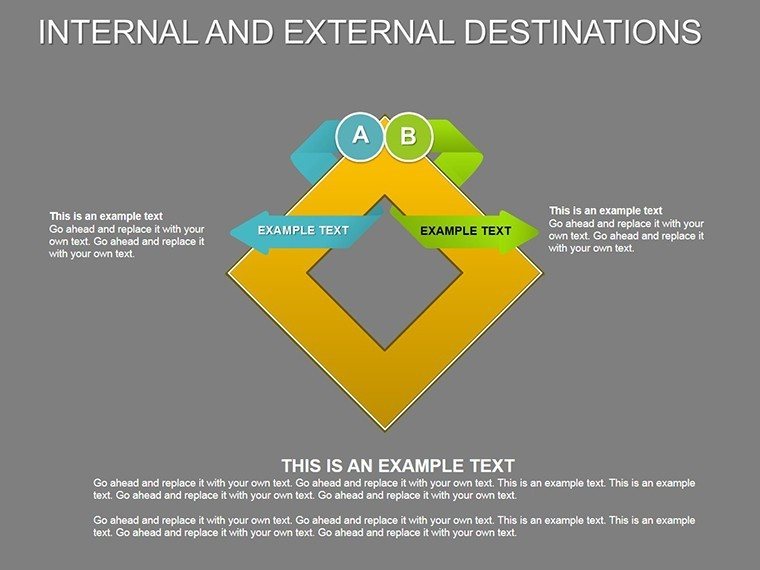
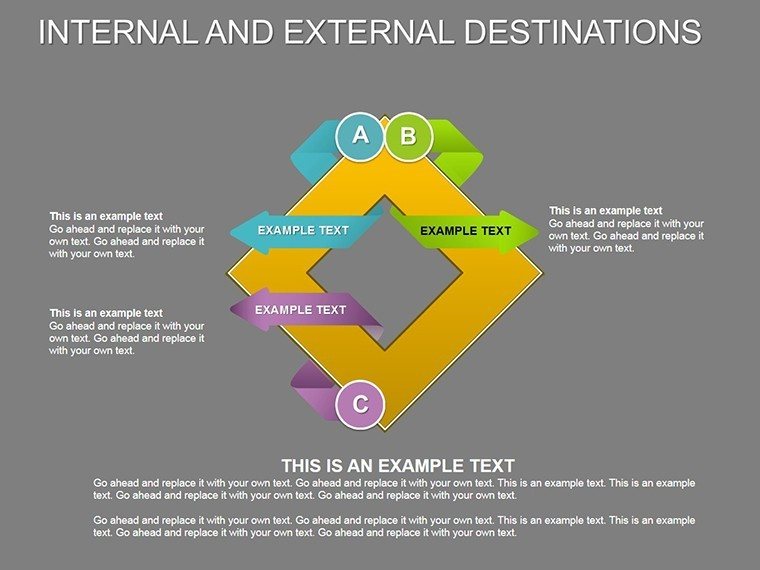
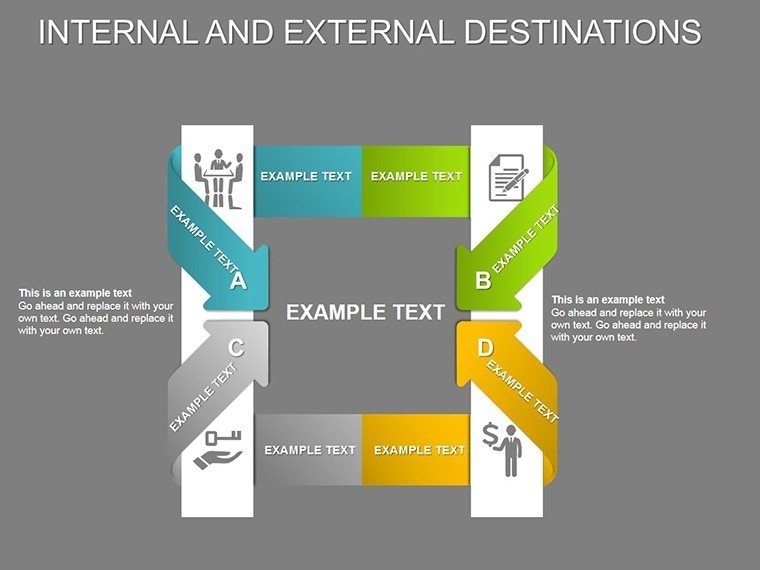
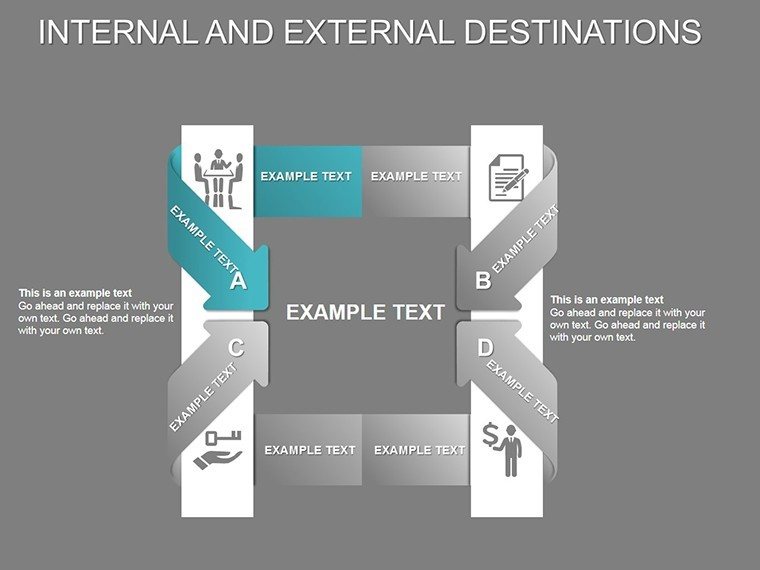
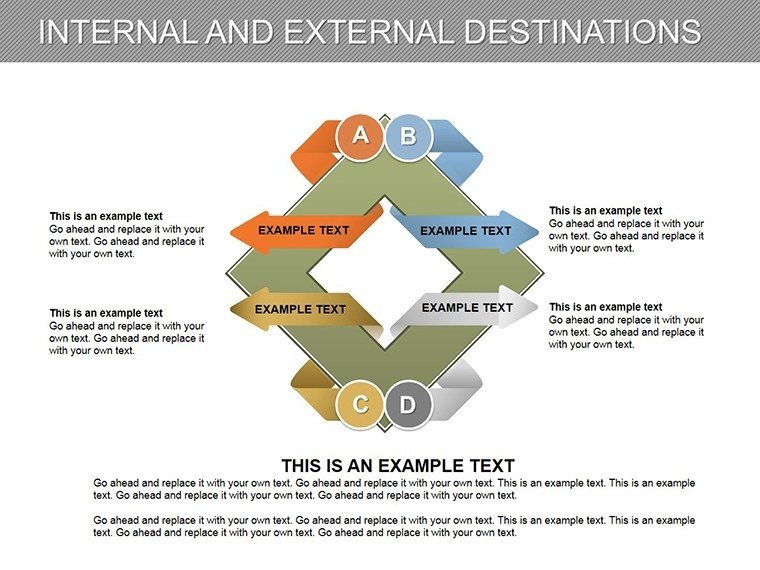
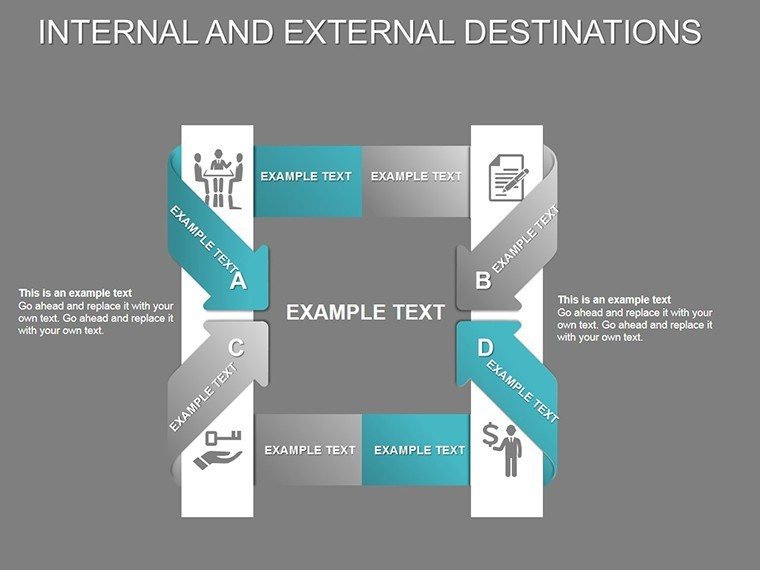
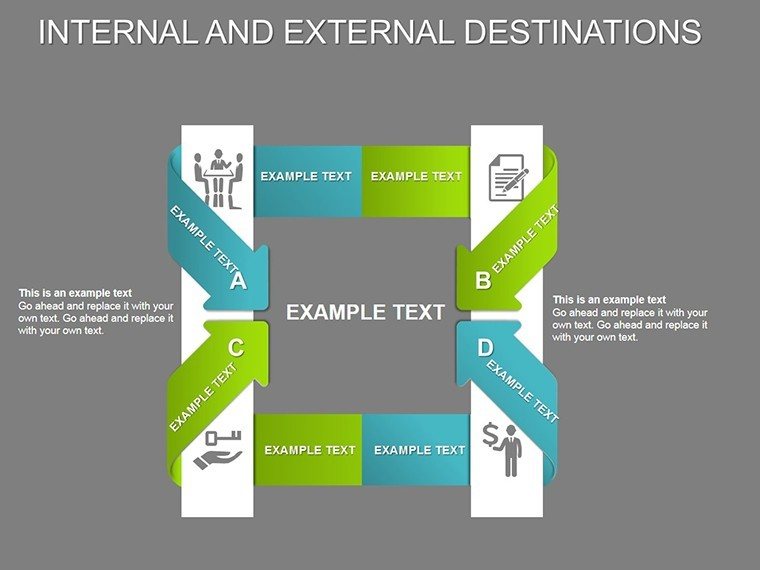
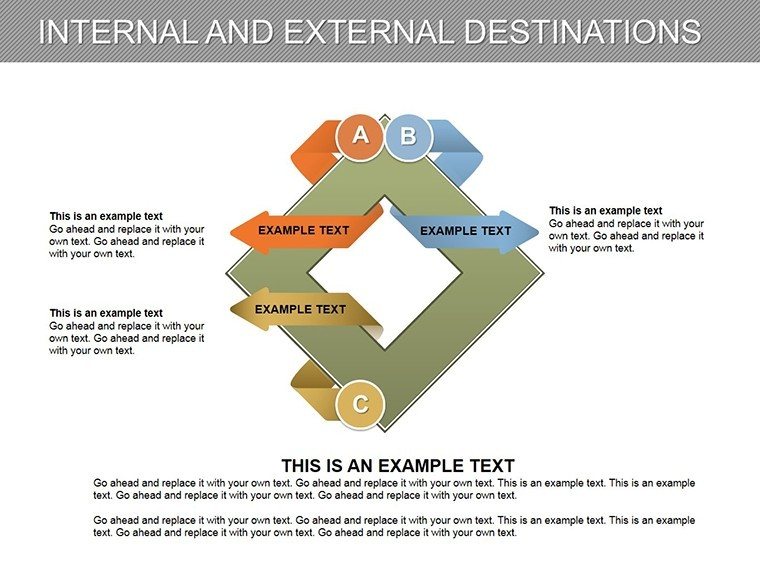
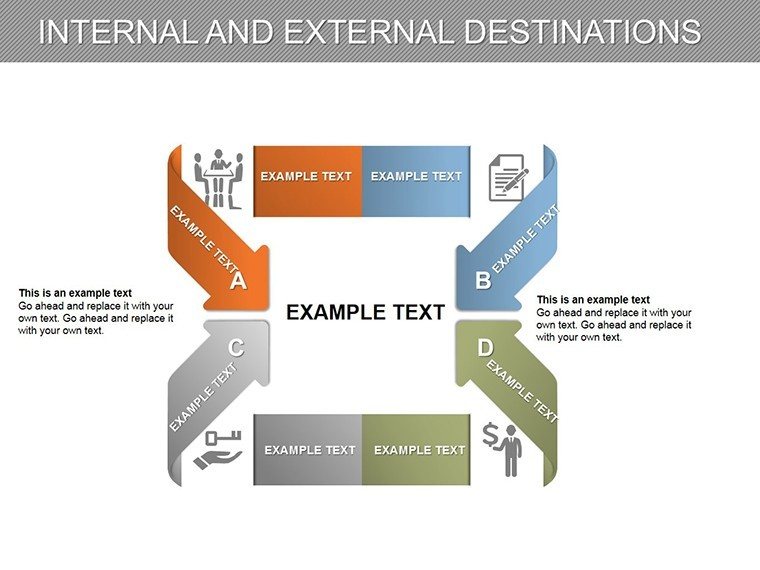
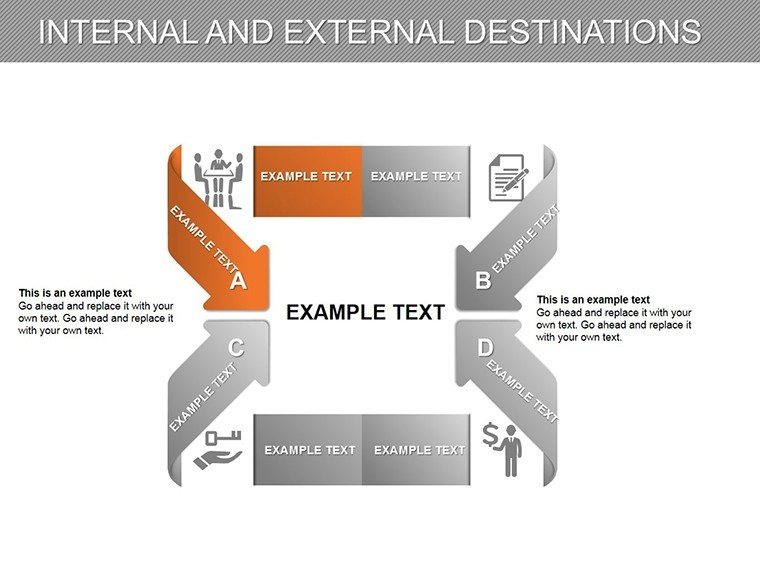
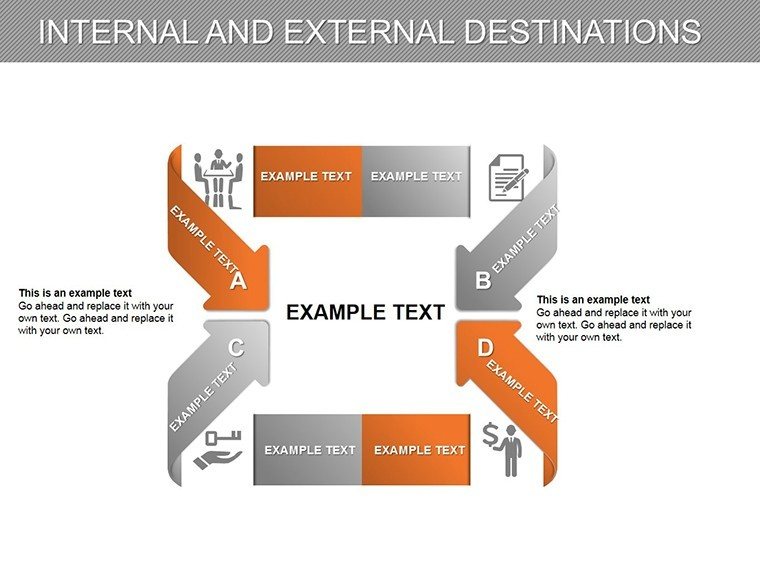
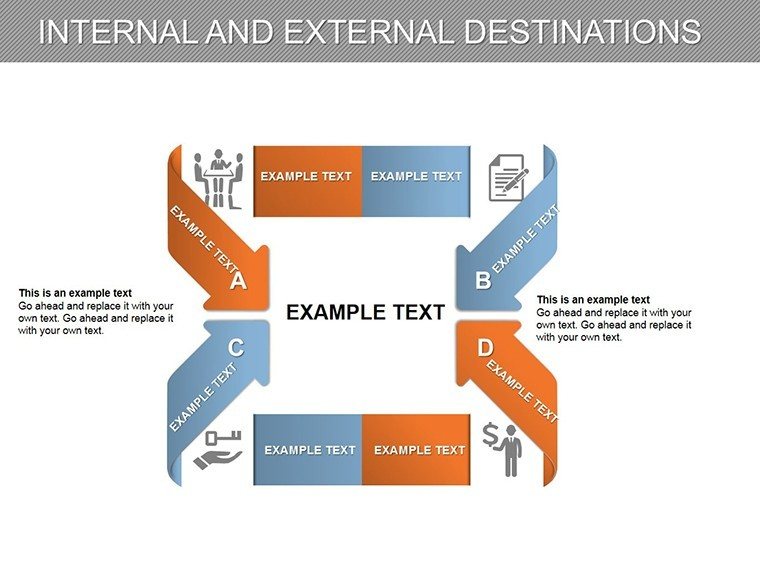
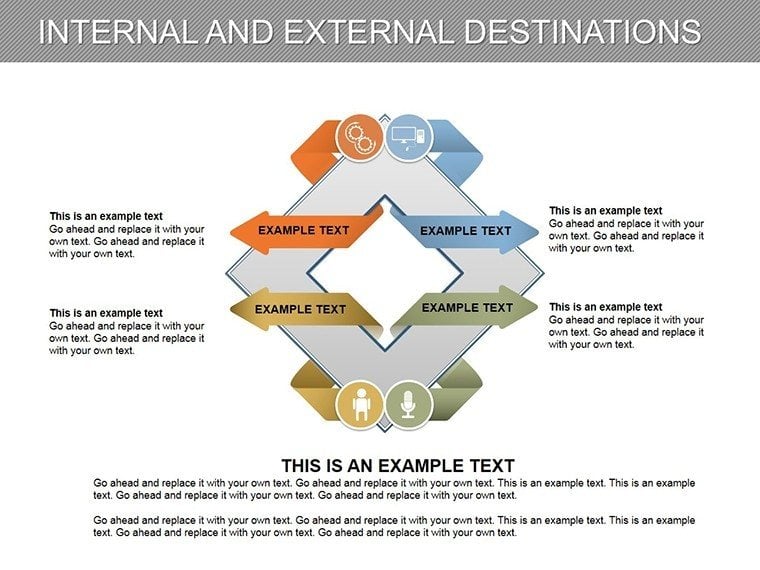
In today's dynamic business environment, clearly communicating directional indicators can be the difference between strategic success and missed opportunities. This Internal and External Destinations PowerPoint diagram template, boasting 24 editable slides, is engineered for professionals like market analysts, project managers, and executives who need to illustrate complex relationships between internal operations and external market forces. By visualizing attitudes and directions of key indicators - such as supply chain efficiencies or market expansion paths - this tool simplifies data interpretation, making your presentations more persuasive and actionable. Whether you're charting company growth trajectories or evaluating competitive landscapes, these diagrams provide a structured yet flexible framework to convey insights with precision and flair.
Mastering Indicator Visualization for Strategic Edge
Delve into a template that's more than just visuals; it's a blueprint for effective communication. Inspired by methodologies from leading consultancies like McKinsey, where directional diagrams clarify strategic pivots, this set allows you to list indicators and denote their orientations seamlessly. For example, in a corporate strategy session, use an arrow-based slide to depict how internal R&D investments align with external consumer trends, supported by data from Gartner reports on industry benchmarks.
Standout Features for Professional Polish
Crafted for ease and impact, each slide supports full customization in PowerPoint, ensuring seamless workflow integration. Key attributes include:
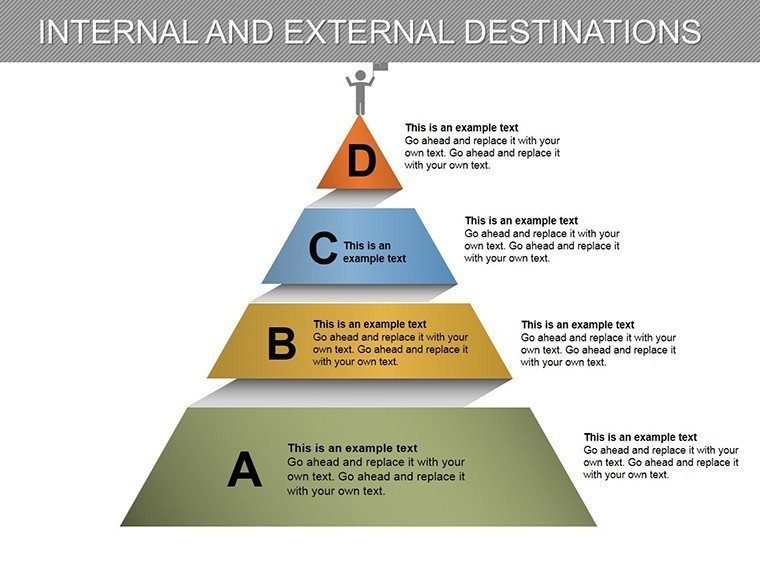
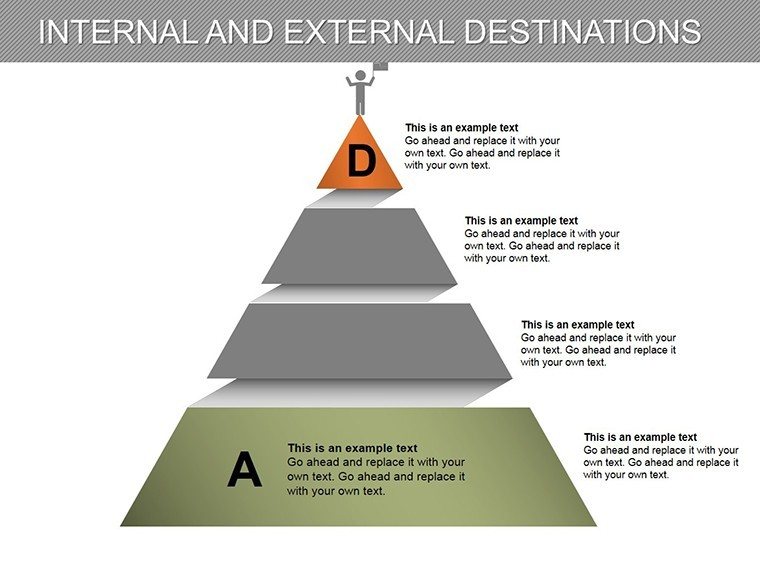
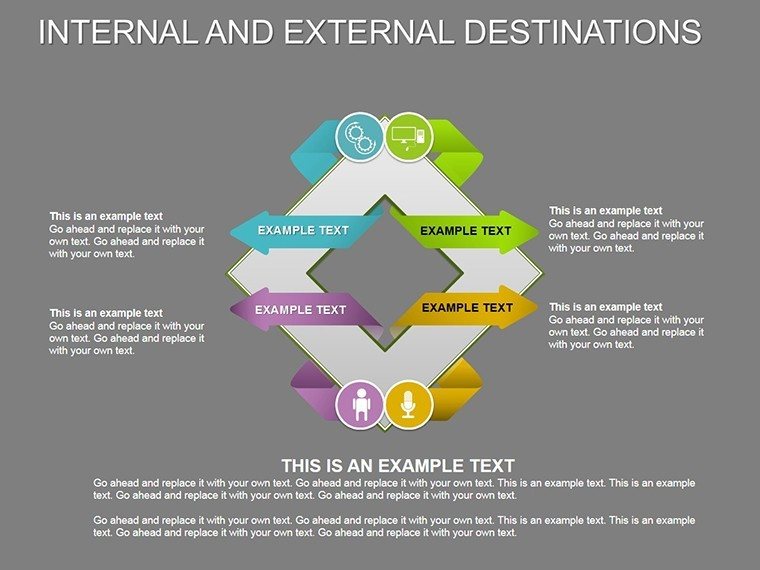
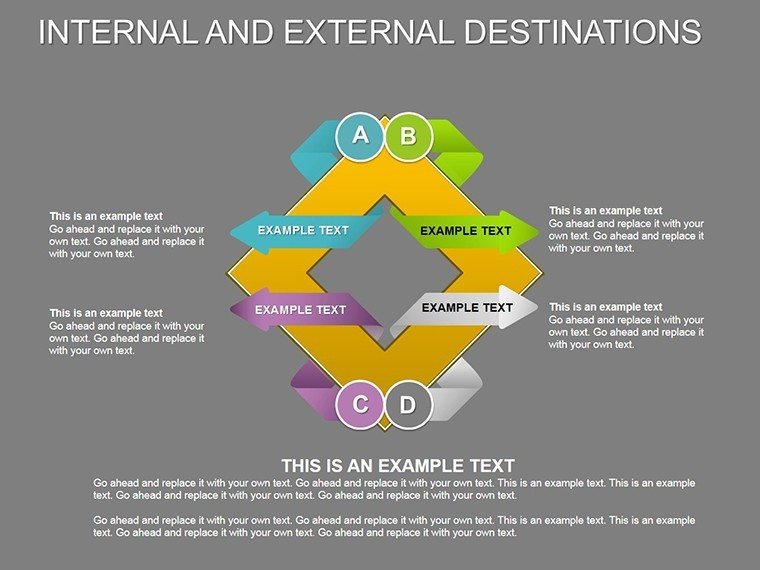
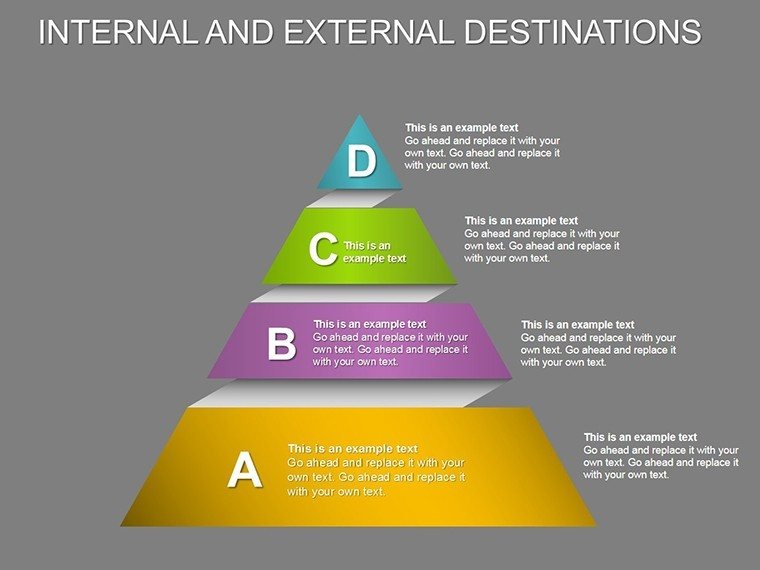
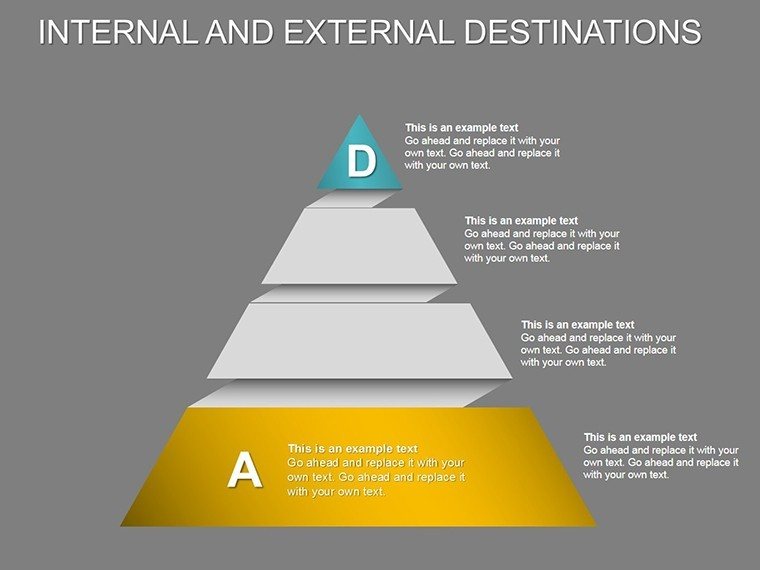
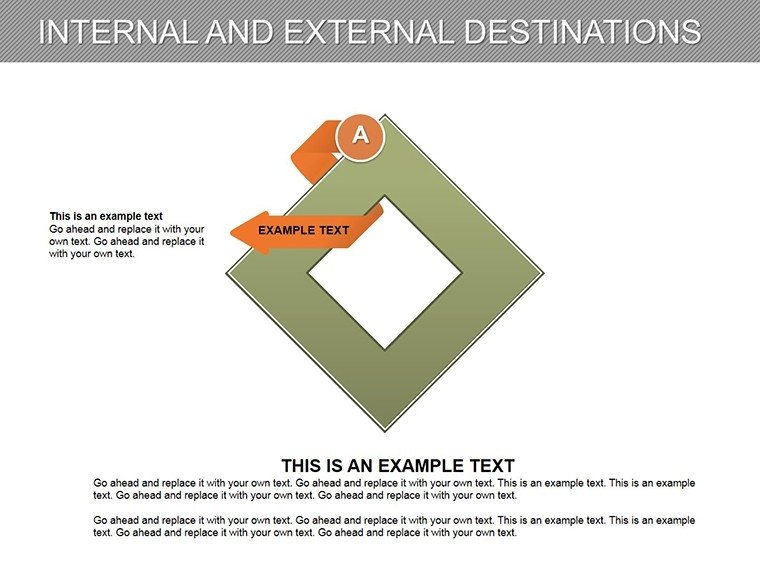
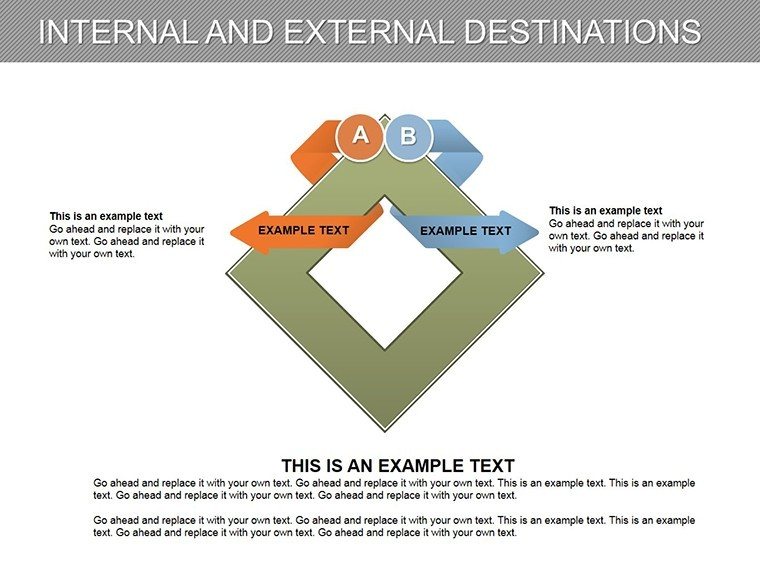
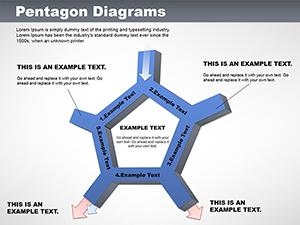
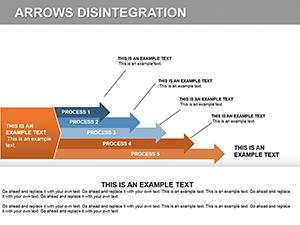
- Complex Graphic Elements: Arrows, cubes, and pyramids that adapt to your data, perfect for showing multi-directional flows.
- Indicator-Focused Layouts: Dedicated spaces to highlight attitudes (positive/negative) and directions (upward/downward trends).
- Scalable Designs: High-quality vectors that maintain clarity across devices, from laptops to large screens.
- Intuitive Editing: Change orientations or add elements without starting from scratch.
Unlike standard PowerPoint shapes that lack depth, these diagrams incorporate layered complexities, enabling nuanced representations that captivate audiences.
Practical Scenarios and Implementation Strategies
Apply this template across diverse contexts. In supply chain management, for instance, map internal logistics against external vendor performances using directional charts, drawing from real cases like Amazon's optimization strategies. For marketing teams, visualize campaign directions, comparing internal goals with external audience responses via integrated data from tools like Google Analytics.
Customizing for Maximum Impact: A Guided Approach
- Identify Core Indicators: List key metrics, such as revenue streams or risk factors, to anchor your diagram.
- Choose Diagram Style: Select from 24 variants, like pyramid for hierarchical directions or arrows for linear progressions.
- Input and Orient Data: Assign attitudes with color coding - green for positive, red for challenges - and directions with arrows.
- Enhance with Context: Add notes or icons to explain implications, aligning with best practices from the Project Management Institute (PMI).
- Iterate for Clarity: Preview and adjust for audience comprehension, ensuring every slide advances your narrative.
This methodical process addresses common issues like misaligned strategies, fostering better decision-making as seen in Fortune 500 case studies.
Pro Tips to Elevate Your Directional Diagrams
To truly shine, integrate storytelling: Begin with an internal snapshot, transition to external influences, and conclude with actionable directions. Avoid clutter by limiting indicators per slide; focus on 3-5 for impact. For virtual delivery, use subtle animations to guide viewer attention along directional paths. This template's versatility also shines in reports - export slides for PDFs or embed in dashboards with software like Tableau for interactive extensions.
Building on authoritative frameworks, such as SWOT analysis enhancements from Harvard Business Review, this tool ensures your presentations exude credibility. It's a reliable choice for scaling strategies, whether for startups plotting market entry or enterprises navigating global shifts.
The Ultimate Tool for Directional Mastery
In a world where directions define destinies, this template equips you to chart paths with confidence. Its editable prowess and strategic focus make it indispensable for forward-thinking professionals. Don't settle for vague overviews - harness these diagrams to drive clarity and conviction in every presentation. Secure your set now and steer your strategies toward success.
Frequently Asked Questions
What makes these diagrams suitable for indicator analysis?
They feature complex, editable graphics designed to show attitudes and directions clearly, ideal for strategic overviews.
Can I adjust the number of indicators per slide?
Yes, the templates are flexible - add or remove elements to fit your specific data needs.
Is compatibility limited to PowerPoint?
Primarily for PowerPoint, but .pptx files can be imported into Google Slides with minor tweaks.
How do I represent positive vs. negative attitudes?
Use color coding and arrow orientations to visually distinguish, enhancing quick comprehension.
Are there examples for business use?
Yes, like mapping internal efficiencies against external market trends for comprehensive strategy sessions.
Good for
- Project roadmaps and sprint plans
- Product launch timelines
- Quarterly or annual review decks
- Company history and milestone summaries
Licence
reviews
The diagrams helped explain our quarterly process review.
The colors were calm and readable.
A few slides had unnecessary graphics.
Easy to customize without breaking formatting.
Pretty decent for office presentations.
FAQ
Will it work in Google Slides?
Are fonts embedded?
Can I use this for client work?
What's the refund policy?
Do you update the template after purchase?
Similar templates
See all Powerpoint Diagrams →
All 24 slides