 Click to zoom
Interconnected Insights: 7-Period Cycle Keynote Charts for Closed-Loop Processes
| Format | .pptx |
| Slides | 18 unique layouts |
| Aspect ratio | 16:9 |
| Compatibility | PowerPoint |
| Animated | No |
| Language | English |
| License | Commercial |
| File size | — |
| Version | v1.0 |
| Last updated | May 2022 |
What's inside
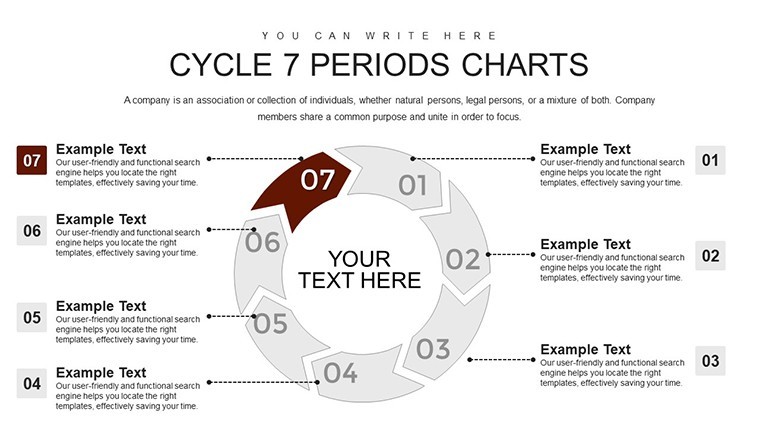
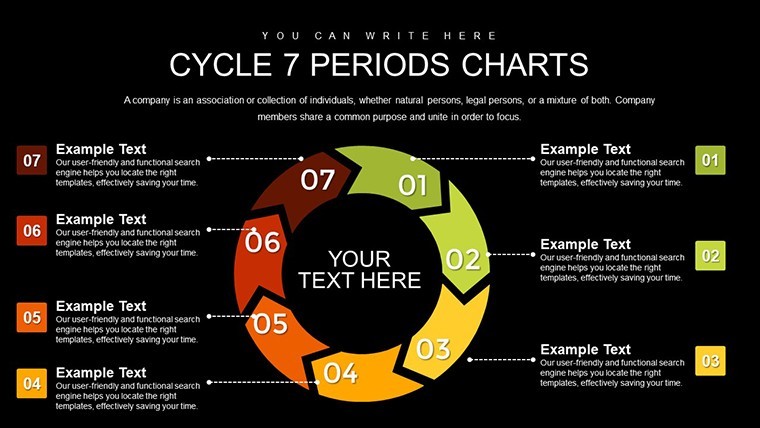
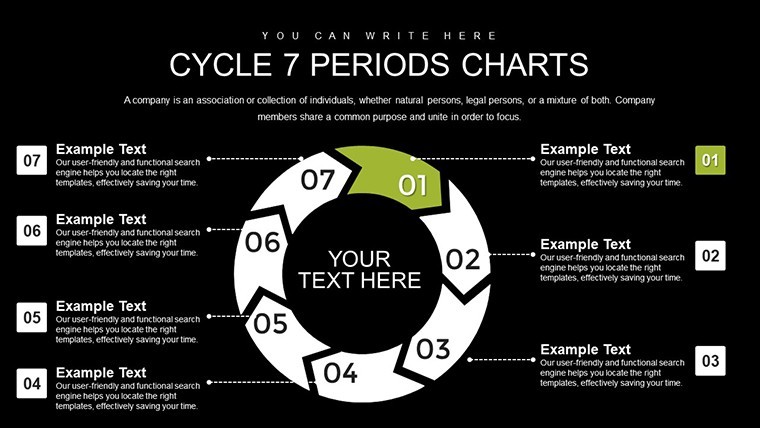
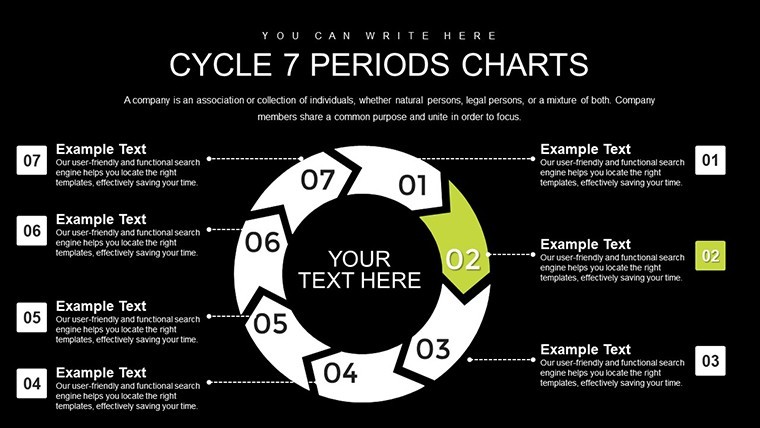
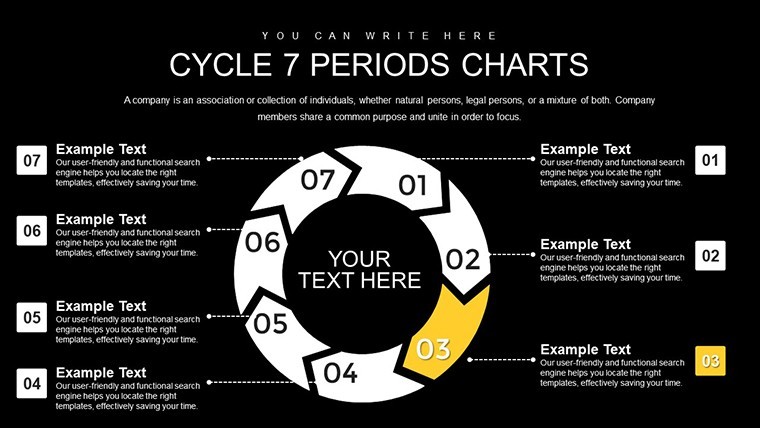
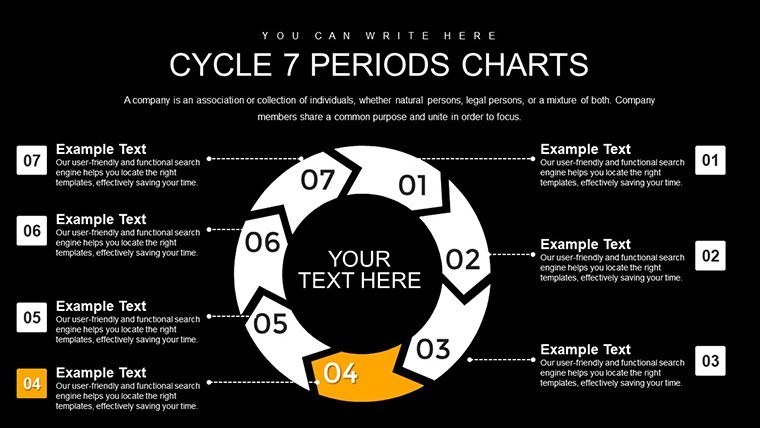
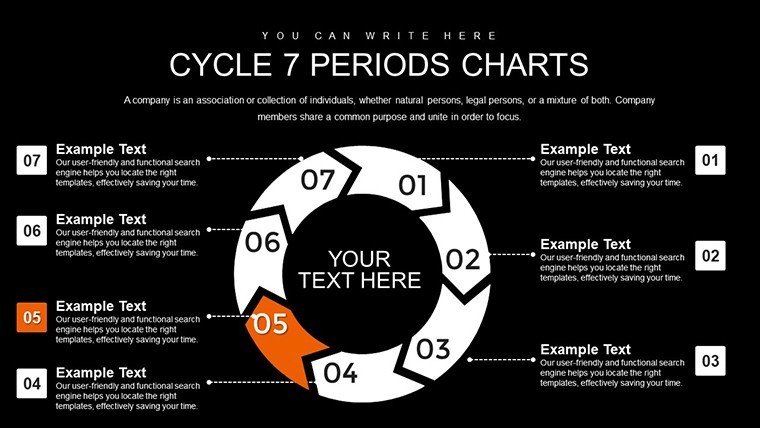
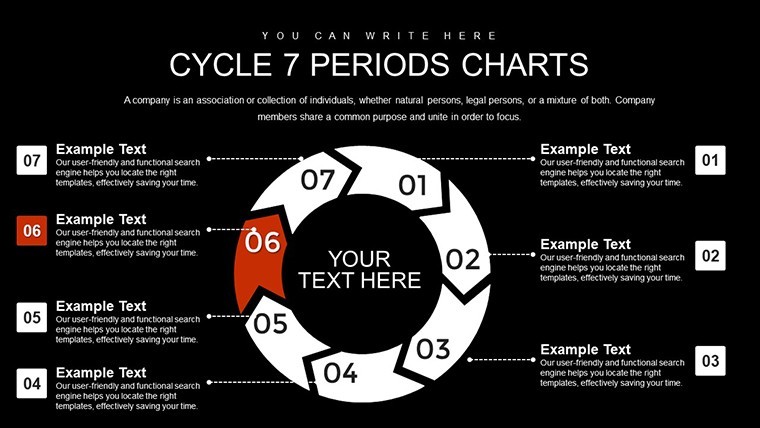
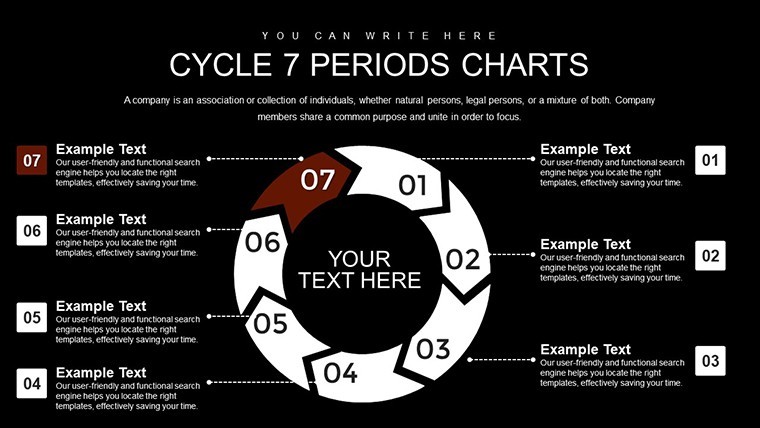
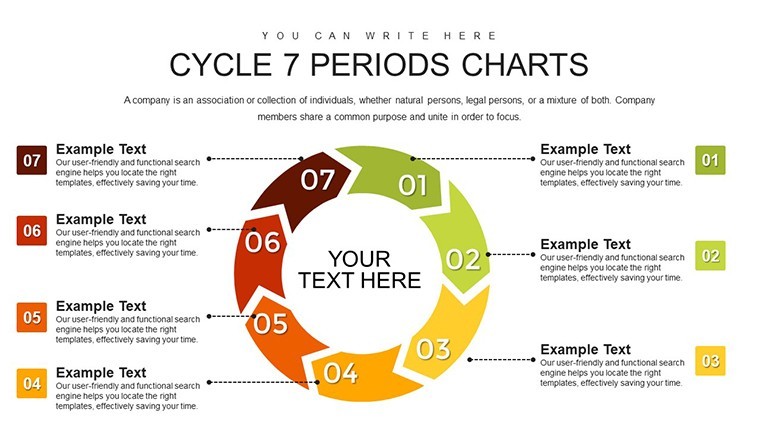
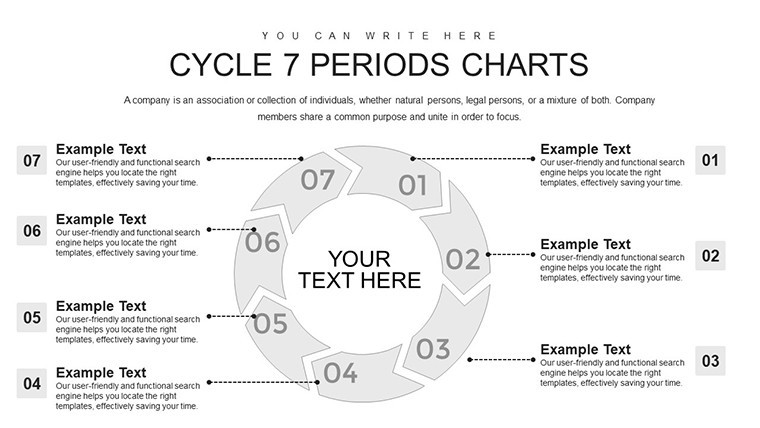
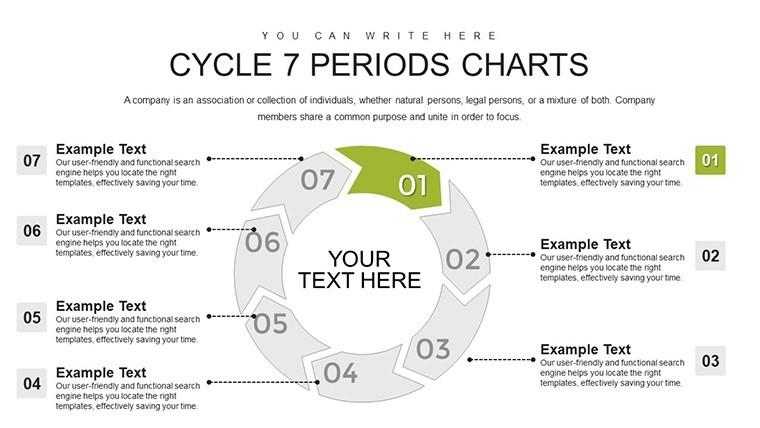
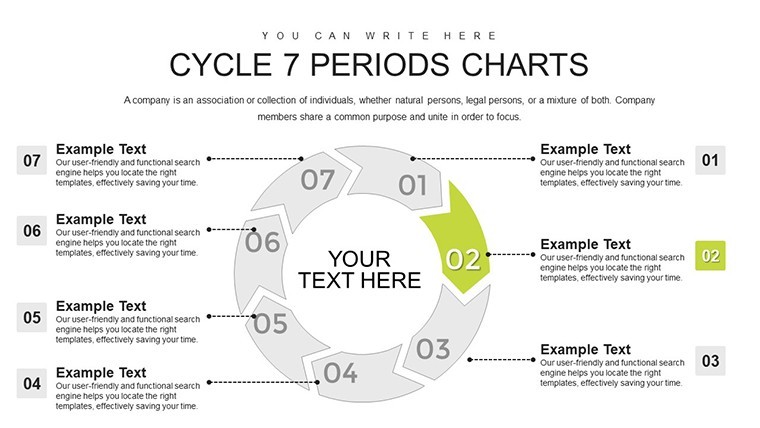
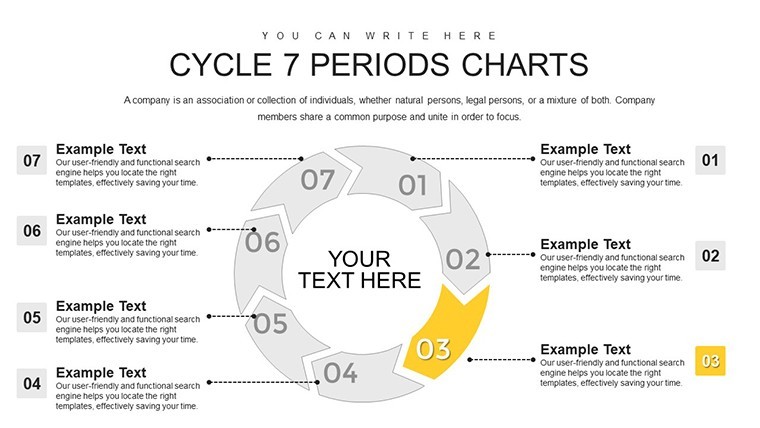
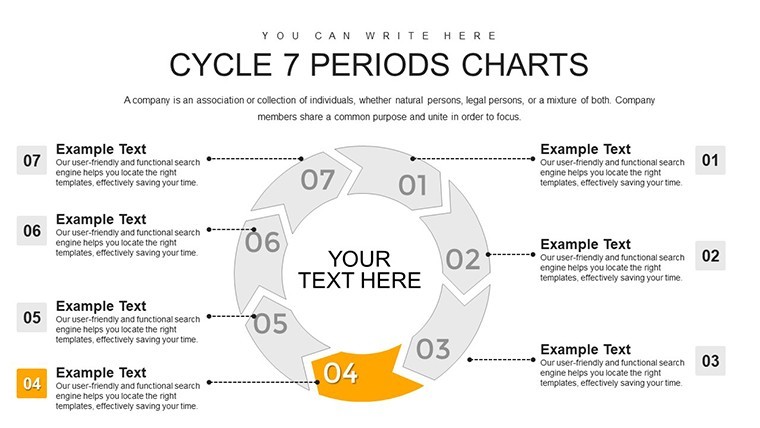
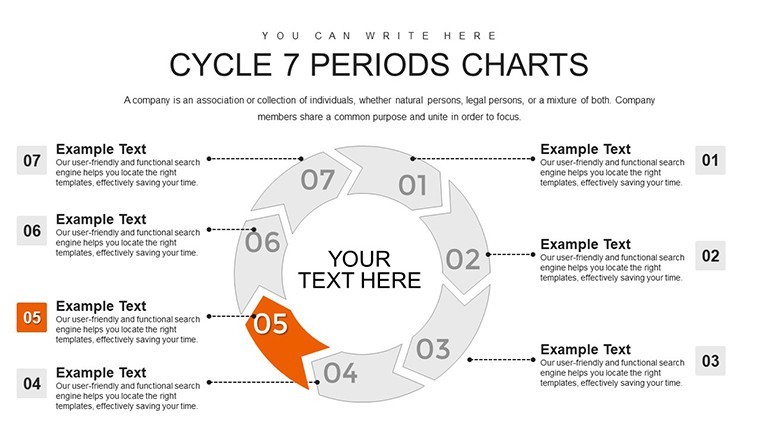
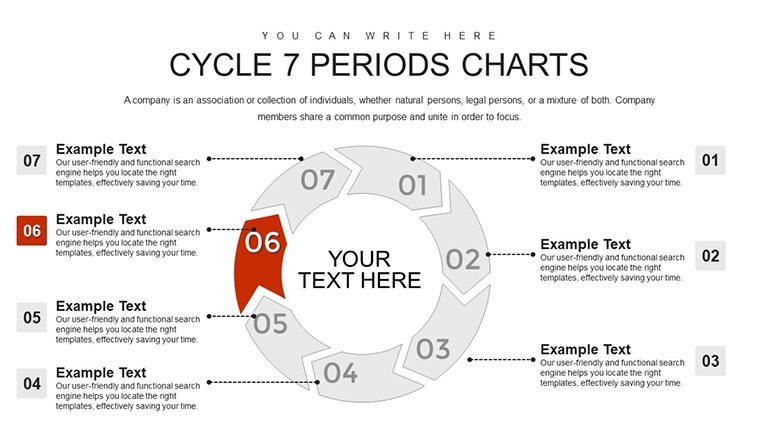
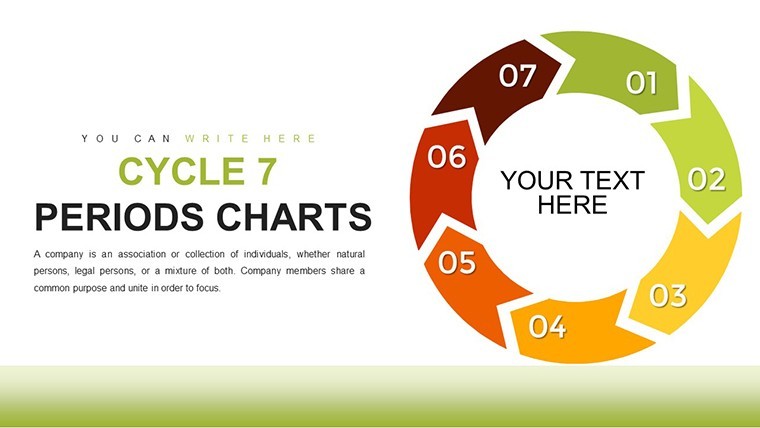
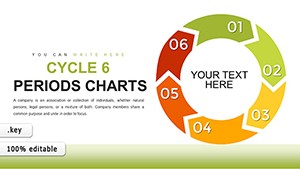
Processes rarely exist in isolation; they loop, influence, and evolve, much like data streams in a thriving ecosystem. Our Cycle - 7 Periods Keynote Charts template embodies this, providing a arrow-formed circular framework to map seven interconnected stages for metrics, information, and workflows. Suited for data scientists analyzing feedback loops, operations managers optimizing supply chains, or strategists planning long-term initiatives, this 18-slide arsenal makes abstract cycles concrete. Inspired by systems thinking from Donella Meadows' work on leverage points, it illustrates how each period feeds into the next, fostering holistic understanding. With editable .key files, this tool integrates into your Apple ecosystem, cutting design drudgery and letting you spotlight insights. Perfect for boardrooms or seminars, it turns data deluges into digestible stories, driving decisions with precision and flair.
Core Features Driving Process Clarity
The arrow-circle design uniquely captures flow, with seven periods allowing detailed segmentation for intricate systems beyond basic cycles.
- Arrow-Linked Segments: Visualizes directionality, showing how outputs become inputs in closed loops.
- Total Editability: Reshape arrows, colors, and content to reflect your unique processes.
- Scalable Graphics: Maintains integrity across resolutions, from desktops to large venues.
- Keynote-Native Ease: Instant compatibility, with no learning curve for users.
- Multi-Variant Slides: Ranges from basic to icon-enriched for varying depths.
Aligned with IBM's process modeling expertise, these boost efficiency, per industry benchmarks showing 30% improved process comprehension.
Targeted Use Cases: Mapping Real-World Loops
In operations, chart supply chain cycles: Seven periods for sourcing, production, distribution, sales, feedback, refinement, and reintegration - using ERP data for authenticity. This echoes Lean Six Sigma applications at companies like General Electric, reducing waste.
For data pros, visualize analytics pipelines, with periods handling collection to deployment. Strategists can model innovation cycles, per Forrester insights. Guide: Outline your loop, choose slide, fill periods, animate arrows, validate with peers. Surpasses standard tools with specialized loop focus, reliable for pros.
- Map your seven interconnected periods.
- Pick an arrow-circle variant.
- Add metrics and directional cues.
- Animate for sequential emphasis.
- Iterate for refined accuracy.
Tips for Optimal Loop Narratives
Build suspense through arrows, revealing interdependencies progressively. Keep labels action-oriented, limiting to essentials. Use Keynote sharing for collaborative mapping, enhancing loop accuracy. Incorporate credible sources like OECD data for weight. Cross-platform testing ensures arrow flows intact.
Layer loops for multi-system views, akin to complex simulations in NASA's planning.
Advantages in a Crowded Field
Generic circles miss direction; our 18-slide set adds arrows for dynamics, with expert foundations for authority and secure edits for trust.
Testimonials: "Clarified our data flows - team alignment soared." Loop no further with basics.
Close the loop on excellence: Claim your 7-Period Cycle Keynote Charts and process with purpose.Frequently Asked Questions
What sets 7 periods apart?
Enables detailed, closed-loop analysis for complex systems.
Full customization possible?
Yes, every arrow and element adjustable in Keynote.
Handles metrics-heavy content?
Perfectly, with integration for charts and data.
Easy for novices?
Yes, intuitive with embedded tips.
Export options?
Yes, to various formats for sharing.
Arrow animations included?
Pre-configured for directional flow.
Good for
- Project roadmaps and sprint plans
- Product launch timelines
- Quarterly or annual review decks
- Company history and milestone summaries
Licence
reviews
Downloaded it mostly for the pie chart pages and they worked fine.
Everything lined up properly which honestly surprised me.
Used this template during an internal office presentation and people paid attention more than usual.
The graph slides were simple enough for quick editing.
I wish there were fewer duplicate layouts but overall it was okay.
FAQ
Will it work in Google Slides?
Are fonts embedded?
Can I use this for client work?
What's the refund policy?
Do you update the template after purchase?
Similar templates
See all Keynote Charts →
All 18 slides