 Click to zoom
Innovative Choice Keynote Charts: Strategizing for Innovation Mastery
| Format | .pptx |
| Slides | 15 unique layouts |
| Aspect ratio | 16:9 |
| Compatibility | PowerPoint |
| Animated | No |
| Language | English |
| License | Commercial |
| File size | — |
| Version | v1.0 |
| Last updated | May 2017 |
What's inside
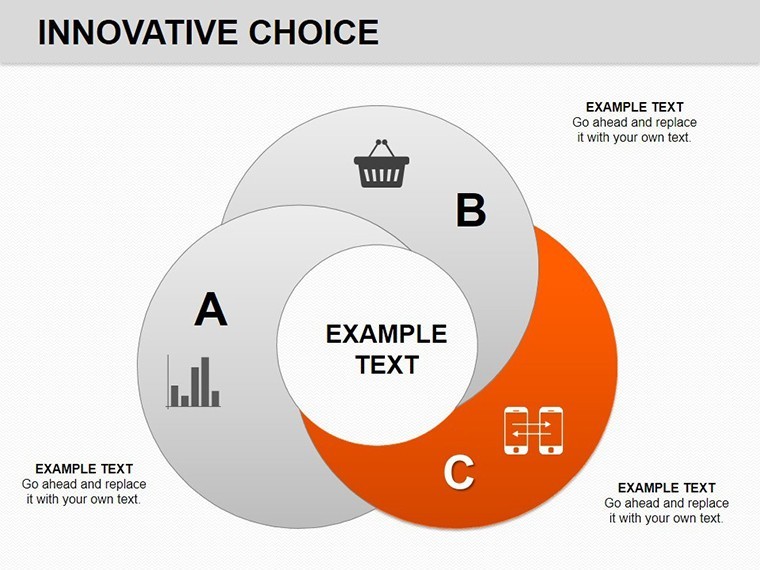
Innovation isn't a gamble; it's a calculated choice that can propel your company forward or leave it vulnerable to market shifts. Our Innovative Choice Keynote Charts template equips you with 15 editable slides to visualize these pivotal decisions, focusing on relationships within the innovation cycle. Suited for strategy leaders, entrepreneurs, and consultants, it highlights how timely responses to changes avert crises, as seen in case studies from firms like Apple during their product pivot eras.
This template integrates relationship charts to map interconnections, offering editable frameworks for custom scenarios. It streamlines complex strategy discussions, drawing from management theories in books like 'The Innovator's Dilemma' by Clayton Christensen, ensuring your presentations are both insightful and actionable.
Key Features for Strategic Visualization
Designed for depth, these charts emphasize relational dynamics with editable nodes and links.
- Full Customization: Adjust relationships, labels, and visuals to your strategy.
- Relationship-Focused Designs: Diagrams for dependencies, influences, and cycles.
- Strategic Insights: Tools to highlight risks and opportunities.
- Quality Assurance: High-fidelity for professional outputs.
Users gain from enhanced decision-making, per INSEAD studies on visual strategy tools.
Comprehensive Slide Overview
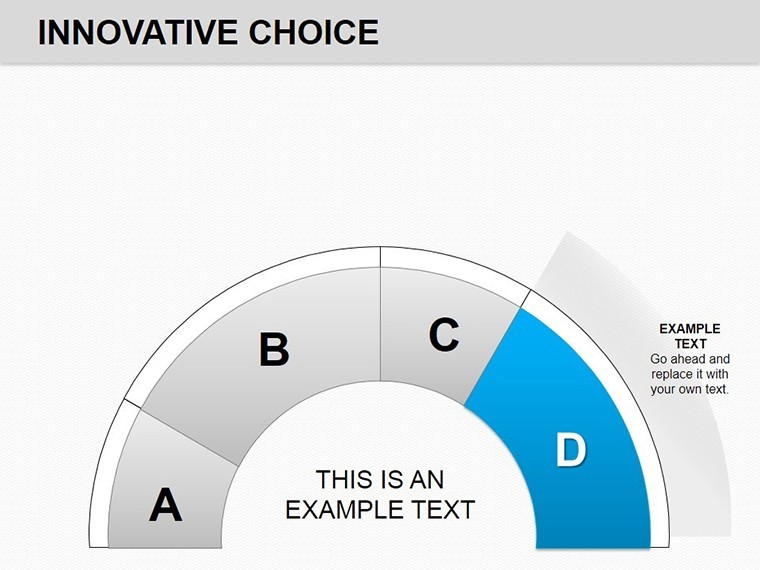
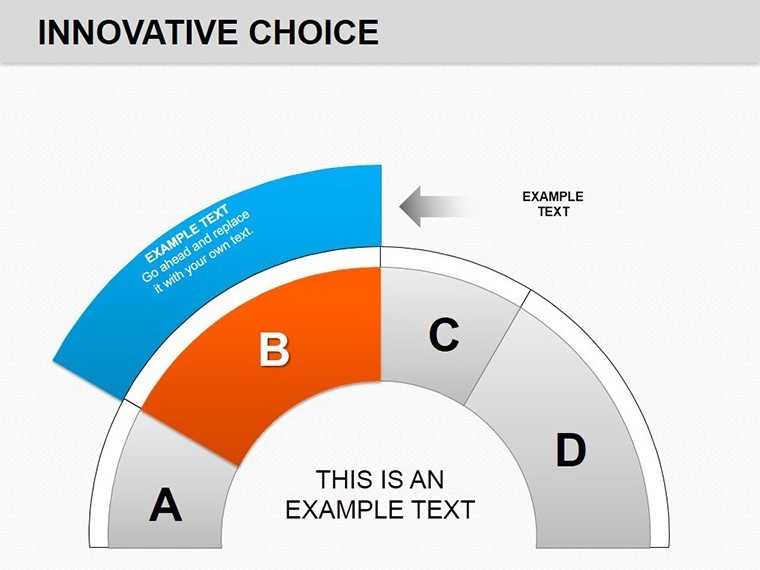
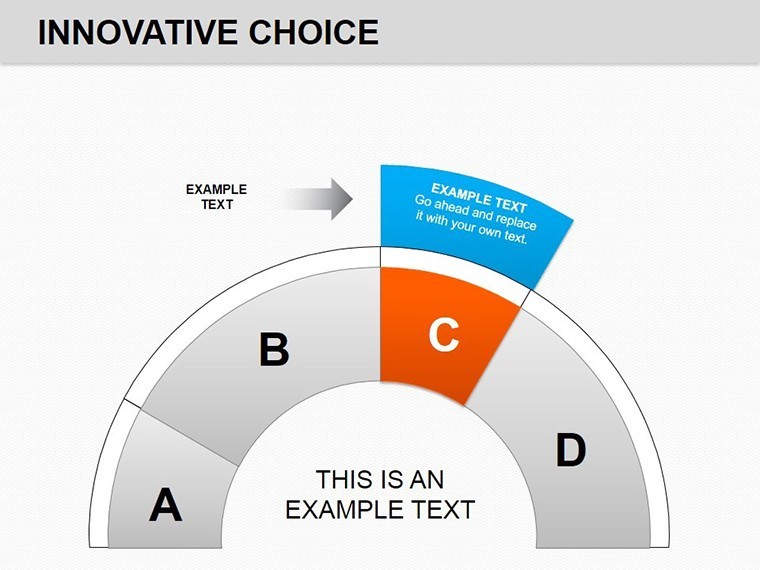
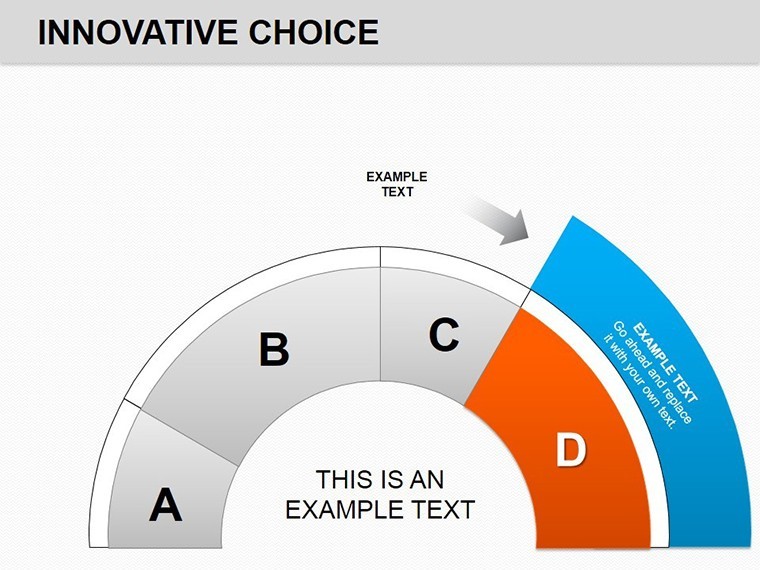
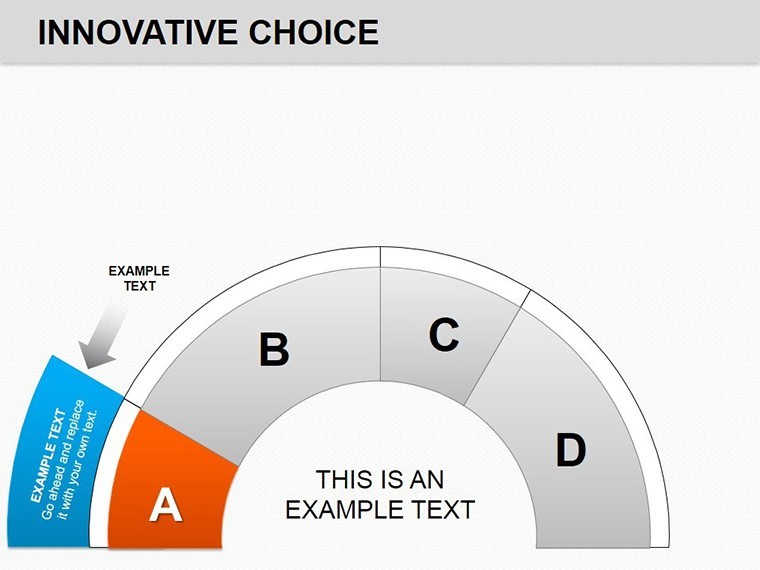
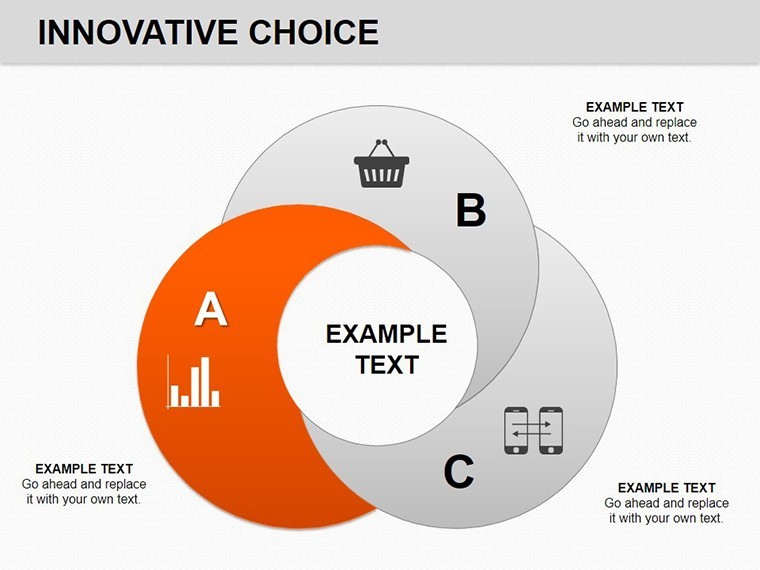
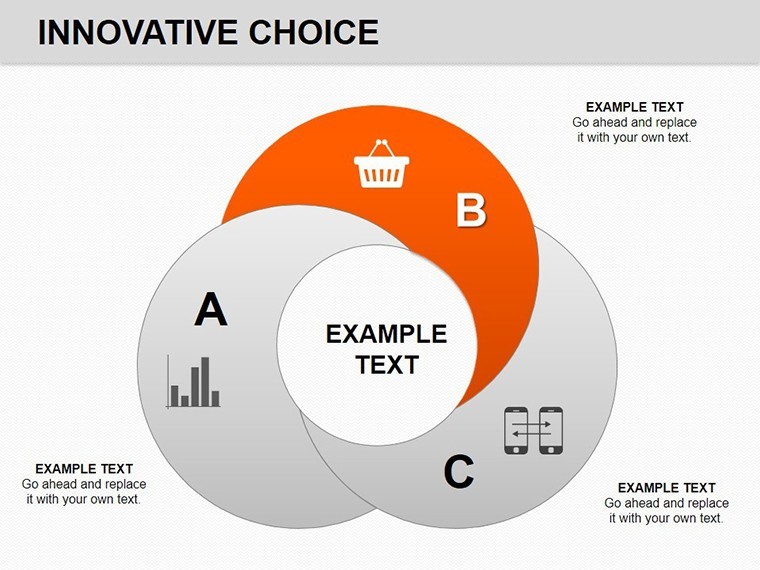
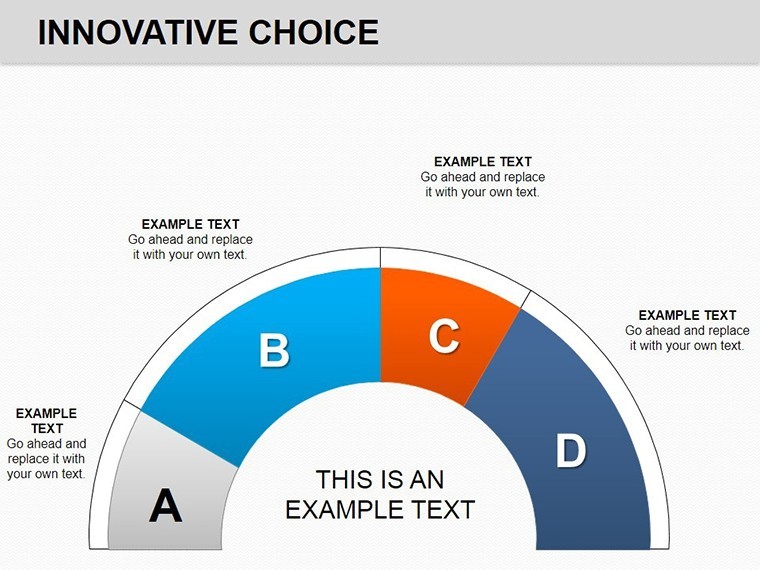
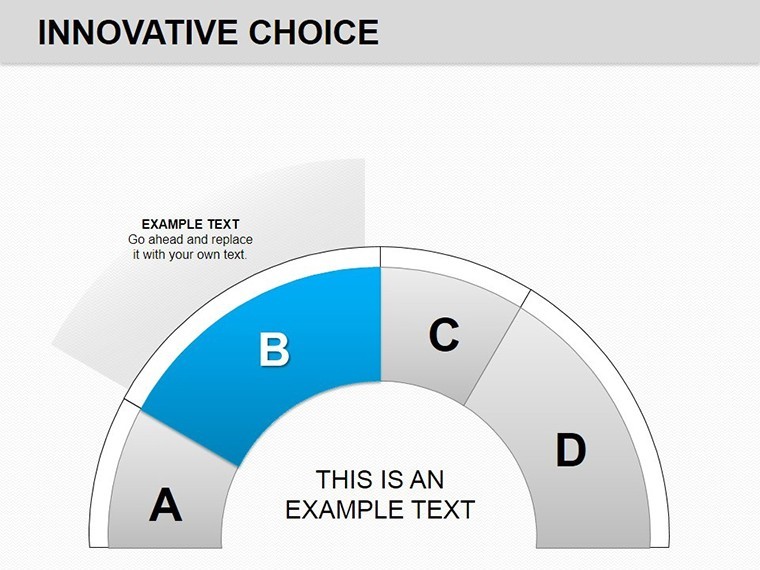
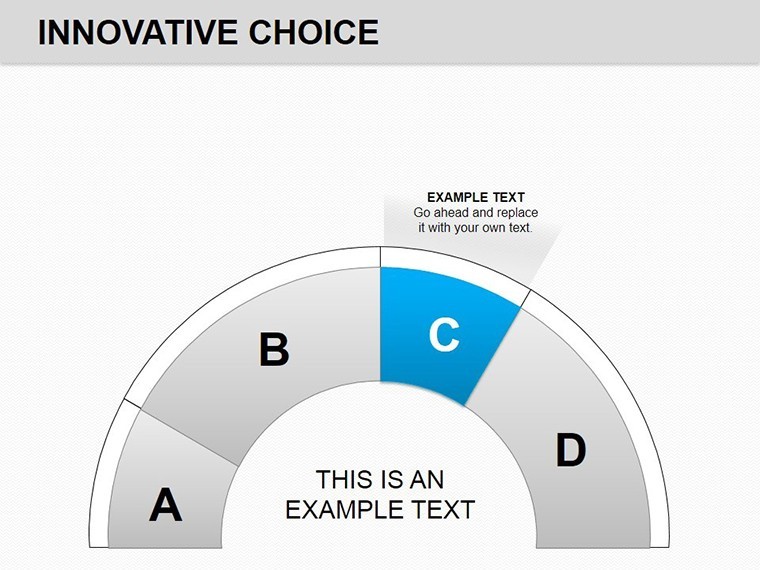
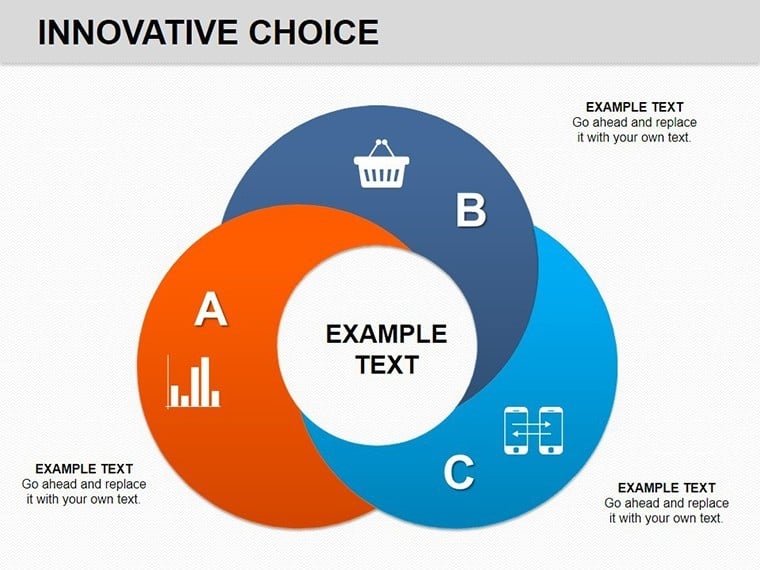
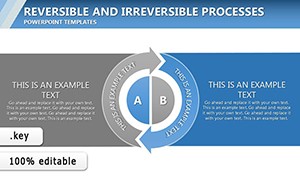
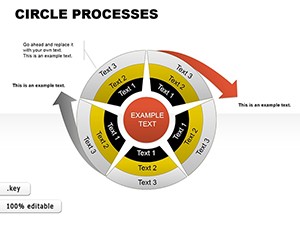
Slide 1 overviews the innovation cycle. Slides 2-6 detail pairwise relationships. Slides 7-11 explore multi-node networks. Slides 12-15 summarize choices with impact matrices.
Strategic Applications in Innovation Management
Use for R&D planning, mapping tech adoptions like in Tesla's ecosystem.
For crisis avoidance, visualize scenario planning.
- Strategy Session Guide: Populate Slide 5 with options, discuss relations.
- Executive Briefing: Use Slide 13 for choice impacts.
- Workshop Tool: Customize Slide 9 for group inputs.
Customization Strategies for Innovators
Layer in metrics, use colors for priorities. Superior to basic charts with built-in strategy templates.
Choose Innovation Excellence Now
Empower your strategies - acquire Innovative Choice Charts and lead with foresight.
Frequently Asked Questions
What do relationship charts offer?
They map interconnections for better strategic understanding.
Keynote compatibility?
Yes, from version 8 onward.
Adaptable to non-innovation topics?
Sure, for any relational analysis.
Delivery format?
.key file for Keynote.
Sharing capabilities?
Export to various formats easily.
Handling complex strategies?
Expandable nodes for depth.
Good for
- Project roadmaps and sprint plans
- Product launch timelines
- Quarterly or annual review decks
- Company history and milestone summaries
Licence
reviews
Needed something for a marketing recap and this worked better than expected.
The charts didn’t feel messy even after adding extra data.
I liked the clean title slides the most.
Could be better organized inside the file honestly.
Still easier than building slides from scratch.
FAQ
Will it work in Google Slides?
Are fonts embedded?
Can I use this for client work?
What's the refund policy?
Do you update the template after purchase?
Similar templates
See all Keynote Charts →

All 15 slides