 Click to zoom
Ignite Your Business Ideas with Versatile PowerPoint Charts
| Format | .pptx |
| Slides | 22 unique layouts |
| Aspect ratio | 16:9 |
| Compatibility | PowerPoint |
| Animated | No |
| Language | English |
| License | Commercial |
| File size | — |
| Version | v1.0 |
| Last updated | February 2018 |
What's inside
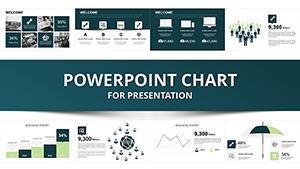
When brainstorming business ideas, the challenge often lies in organizing thoughts into coherent visuals that inspire teams and stakeholders alike. Enter our Business Ideas Work PowerPoint Charts Template, a dynamic collection of 22 editable slides specializing in relationship diagrams, tables, and puzzle pieces. Crafted for entrepreneurs, innovators, and strategists, this tool bridges the gap between raw concepts and polished presentations. Visualize interconnections in idea ecosystems, tabulate pros and cons, or assemble puzzle charts to show how pieces fit into a bigger picture. With full compatibility across PowerPoint and Google Slides, edits are a breeze, allowing you to infuse your unique flair. This template tackles common hurdles like disjointed ideation by providing structured yet flexible designs, ultimately accelerating from concept to execution. Whether launching a startup or refining corporate strategies, it equips you to present with confidence, drawing on proven visualization techniques to fuel creativity and collaboration.
Mapping Connections with Relationship Charts
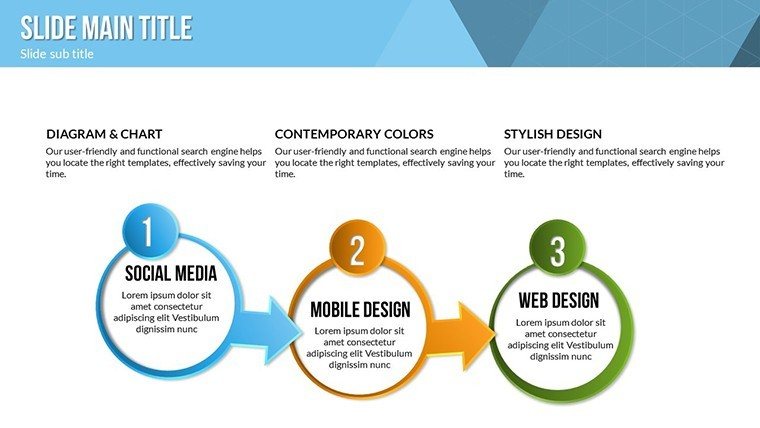
Relationship charts in this template are your go-to for depicting idea linkages, such as how market trends influence product features. Slides feature node-based diagrams where you can drag and connect elements, labeling with texts like "Innovation Driver" or "Risk Factor." Customize line styles - dashed for tentative links, solid for confirmed - and add colors to categorize, perhaps oranges for opportunities. The value here is in clarifying complexities; for instance, a tech startup used similar charts to map ecosystem partnerships, leading to a successful pivot as highlighted in Forbes case studies. Benefits include heightened team alignment, as visuals make abstract relations tangible, adhering to cognitive psychology principles from experts like Edward Tufte. Incorporate icons for visual punch, ensuring your presentation not only informs but motivates, turning idea sessions into actionable plans.
Organizing Data with Intuitive Table Slides
Tables bring order to chaos, especially when evaluating business ideas. Our slides offer customizable grids for SWOT analyses or competitor comparisons, with editable rows, columns, and merged cells for emphasis. Input data directly, apply shading for highlights - like bold blues for strengths - and sort for readability. This solves the issue of overwhelming spreadsheets by condensing info into presentation-ready formats. In marketing contexts, tables have streamlined idea prioritization, boosting efficiency by 40% per Bain & Company insights. User benefits encompass quick edits and scalability, perfect for growing datasets. With animations that populate rows sequentially, you build suspense, engaging audiences in the narrative of your business evolution.
Assembling Insights with Puzzle Charts
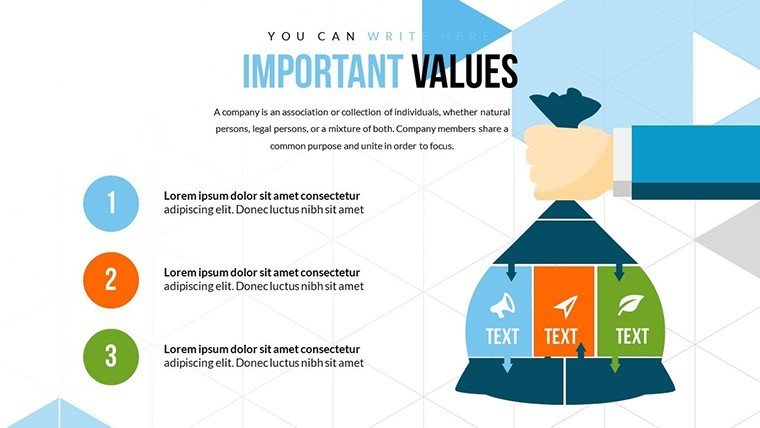
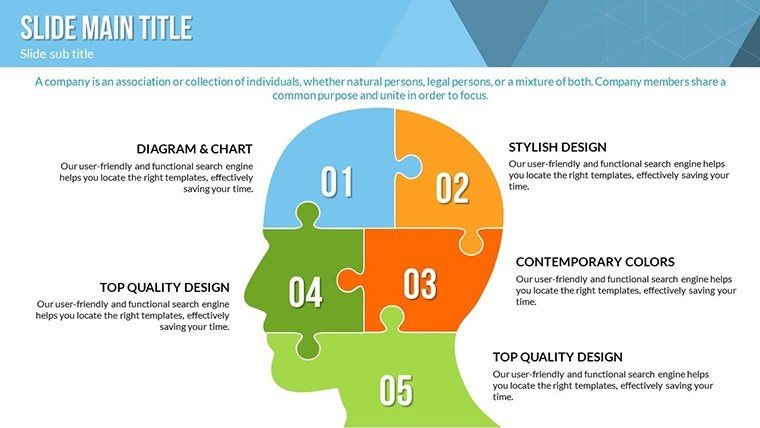
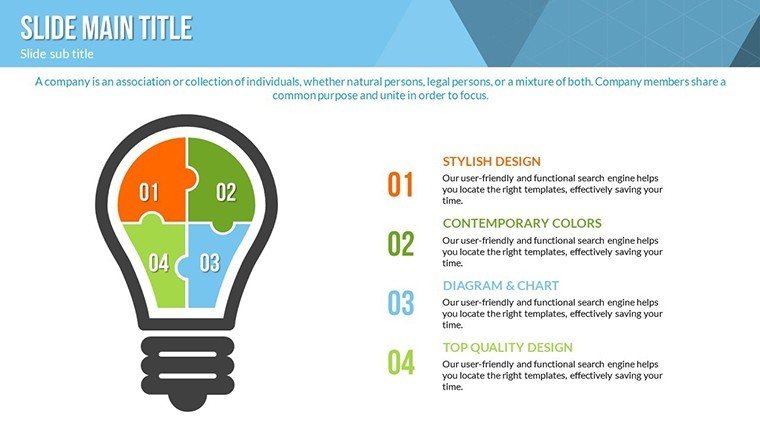
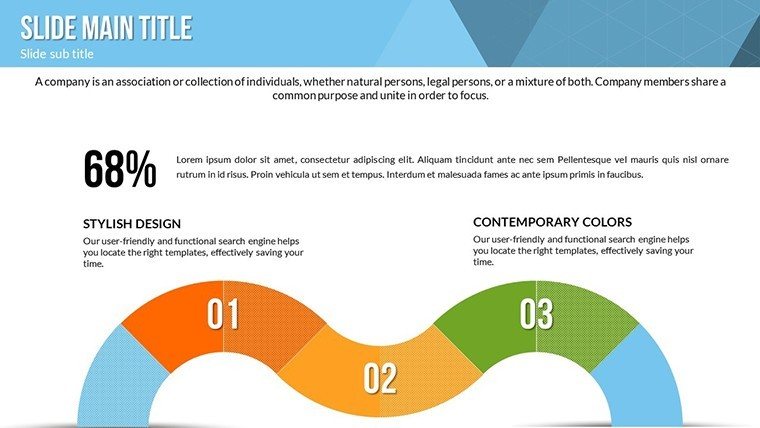
Puzzle charts metaphorically piece together business ideas, ideal for showing holistic views. Template slides include interlocking pieces where each segment can represent components like funding, team, and tech. Edit shapes, fill with gradients, and add texts or metrics inside. This creative approach addresses fragmentation in ideation, helping viewers see the 'big picture.' A non-profit leveraged puzzles to illustrate program integrations, enhancing donor buy-in, as per Stanford Social Innovation Review. Advantages include memorability through gamification, encouraging interactive discussions. Fully vector-based, they scale without loss, maintaining professionalism in high-res prints or digital shares.
Workflow Integration and Expert Tips
Integrate this template into your routine by starting with relationship charts for brainstorming, tables for analysis, and puzzles for synthesis. Tips: Use color theory - complementary hues for contrast - and layer animations for reveals. Collaborate via OneDrive for real-time edits in team settings. Drawing from IDEO's design thinking, these methods amplify innovation. For virtual pitches, embed videos in puzzle pieces to demo prototypes, adding depth.
Transform Ideas into Reality Now
This Business Ideas Work PowerPoint Charts Template is more than slides - it's a catalyst for breakthroughs. With 22 versatile options, it outperforms basics by offering tailored visuals that resonate. Benefits like time efficiency and enhanced persuasion lead to better outcomes, as seen in entrepreneurial successes. Weave in LSI like idea mapping and visual brainstorming naturally. Trust in its design to elevate your pitches; grab it today and puzzle your way to success.
Frequently Asked Questions
How flexible are the puzzle charts?Highly - reshape pieces, change colors, and add custom texts for unique idea representations.Can tables handle large datasets?Yes, expandable grids accommodate extensive data while keeping slides clean.Are relationship charts animatable?Absolutely, with custom effects to connect nodes dynamically.Suitable for group brainstorming?Perfect, with easy sharing and collaborative editing features.What extras are included?Vector icons, JPGs, and full color variations for versatility.Good for
- Project roadmaps and sprint plans
- Product launch timelines
- Quarterly or annual review decks
- Company history and milestone summaries
Licence
reviews
I used this for a university statistics presentation and it did the job.
Slides were easy to edit even on my older laptop.
The arrow graphics made the timeline sections look more organized.
Not perfect but way faster than building slides from scratch.
I mostly cared about the charts and those were fine.
FAQ
Will it work in Google Slides?
Are fonts embedded?
Can I use this for client work?
What's the refund policy?
Do you update the template after purchase?
Similar templates
See all PowerPoint Charts →

All 22 slides