 Click to zoom
Business Analyst PowerPoint Charts Template for Impactful Presentations
| Format | .pptx |
| Slides | 26 unique layouts |
| Aspect ratio | 16:9 |
| Compatibility | PowerPoint |
| Animated | No |
| Language | English |
| License | Commercial |
| File size | — |
| Version | v1.0 |
| Last updated | August 2023 |
What's inside
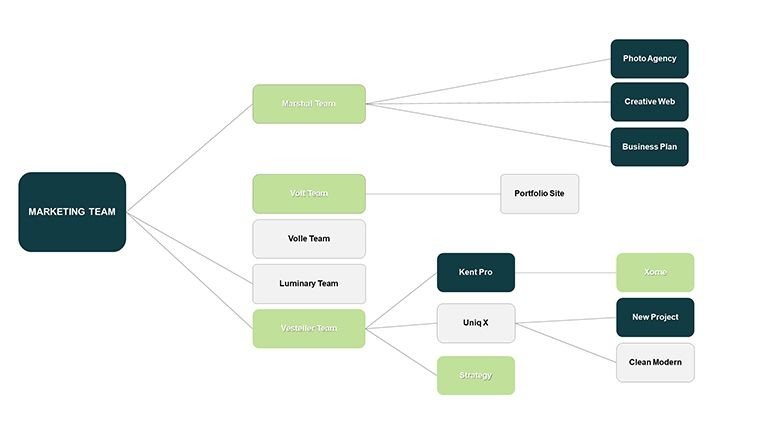
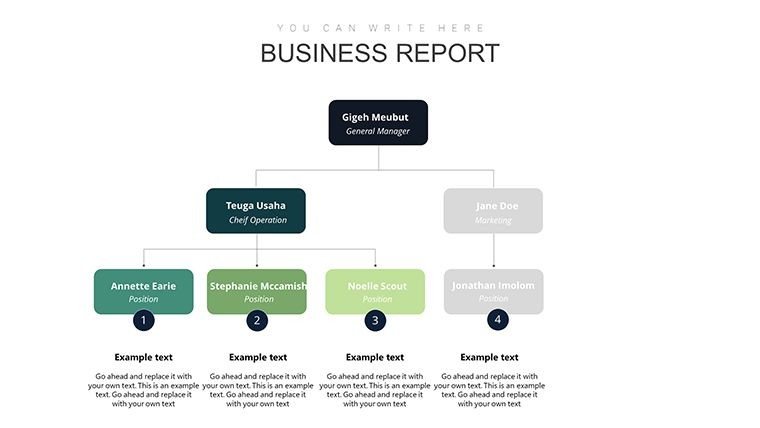
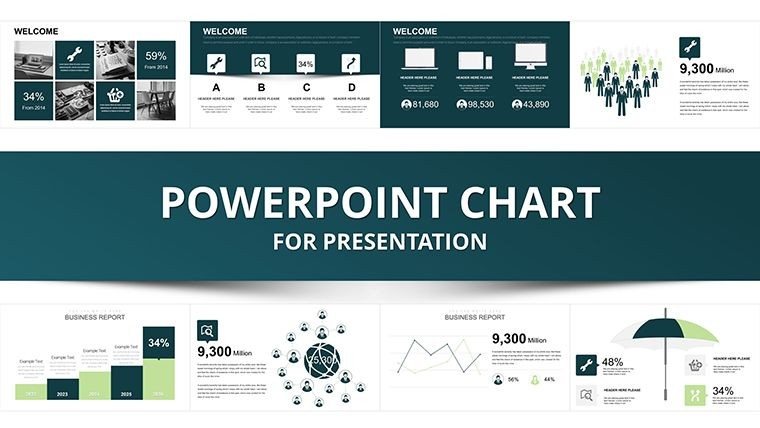
Envision turning raw numbers into compelling narratives that drive business decisions - this is the essence of the Business Analyst PowerPoint Charts template. With 26 editable slides, it's crafted for analysts who wrestle with presenting intricate data in finance, marketing, or project management. Consider a consultant preparing a market analysis: Instead of overwhelming tables, they deploy sleek graphs to spotlight trends, making recommendations crystal clear. This template bridges the gap between data complexity and audience comprehension, offering tools that align with industry standards like those from the International Institute of Business Analysis (IIBA). Compatible across PowerPoint and Google Slides, it empowers users to customize swiftly, enhancing professionalism and efficiency. From relationship diagrams illustrating stakeholder dynamics to business model canvases for strategic planning, it caters to professionals seeking to amplify their analytical prowess and leave lasting impressions.
Essential Features for Analytical Excellence
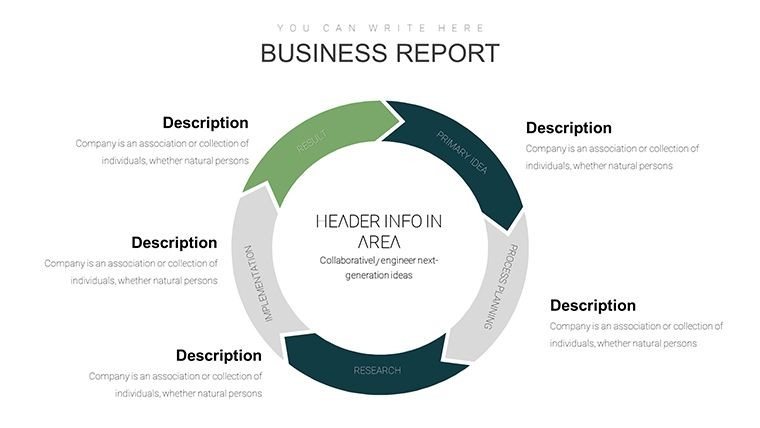
This template's strength lies in its targeted features, optimized for data-driven roles. The 26 slides encompass process flows for operational breakdowns, relationship charts for network mapping, and analytical graphs like SWOT matrices. Adjust hues to reflect corporate identities, modify scales for precise metrics, or embed formulas for dynamic updates - ideal for real-time financial forecasting. Drawing on best practices from consulting firms like McKinsey, these visuals ensure logical progression, such as layering data in bar charts to compare quarterly revenues. For project managers, the timeline integrations help track milestones, incorporating Gantt-style elements without external software. This not only streamlines workflows but also instills confidence through clean, authoritative designs that resonate in high-stakes meetings.
Practical Use Cases in Professional Settings
Its applications span industries, providing tangible value in everyday scenarios. In finance, use it for variance analysis, where pie charts dissect budget overruns, aiding corrective strategies. Marketing teams can map customer journeys via relationship diagrams, identifying pain points with data from tools like Google Analytics. A detailed workflow: Import your dataset into an analysis slide, customize axes for clarity, add annotations for key insights, then transition to a business model slide to propose solutions. Consultants at firms like Deloitte have leveraged similar templates to secure client approvals by visualizing ROI projections effectively. In project proposals, the charts clarify scopes and risks, fostering stakeholder buy-in. This user-centric approach solves the dilemma of misinterpreted data, promoting informed discussions and successful outcomes.
Advanced Customization Strategies
Elevate your use with these pro tips rooted in analytical expertise. Start by defining your key message, then select complementary charts - pair a process flow with a relationship graph to show interdependencies in supply chains. Use subtle animations to unveil data layers, as suggested in Edward Tufte's data visualization principles, avoiding clutter. For collaboration, share via Google Slides to gather feedback, refining metrics like KPI dashboards. Incorporate icons from the built-in library to symbolize concepts, such as gears for processes, enhancing visual appeal. Steer clear of overuse of colors; stick to 3-4 shades for focus. These methods, refined through years of business consulting, transform standard analyses into persuasive tools that command attention.
Advantages Over Basic Presentation Software
Unlike rudimentary PowerPoint defaults, which offer limited customization and generic looks, this template provides integrated, industry-specific elements that foster coherence. Basic tools might suffice for simple bar graphs, but here, advanced relationship and model charts enable deeper insights, like mapping organizational hierarchies. Analysts report enhanced credibility when using themed templates, as they project expertise in domains like risk management. With 26 options, variety prevents monotony, contrasting with free alternatives that lack depth. Ultimately, it's a strategic asset for differentiating in competitive landscapes, where clear visuals can tip the scales in negotiations or reviews.
Empower your analyses - grab the Business Analyst Charts template today and analyze with authority.
Frequently Asked Questions
How many chart types are available?
Multiple, including process, relationship, and business model variations across 26 slides.
Can I integrate external data?
Yes, easily import from Excel or other sources for dynamic updates.
Is it optimized for mobile viewing?
Absolutely, responsive designs ensure clarity on all devices.
What industries does it suit best?
Finance, marketing, consulting, and project management, among others.
Are updates free?
Yes, purchase includes access to any future enhancements.
Good for
- Project roadmaps and sprint plans
- Product launch timelines
- Quarterly or annual review decks
- Company history and milestone summaries
Licence
reviews
Business Analyst charts with SWOT and relationship diagrams turned data into narratives. 26 slides ideal for consultants. Clean professional style.
Analyst perspective: dynamic graphs for trends excellent. Easy Excel import. Helped secure approval.
Practical for finance reviews. Model canvases comprehensive. Good customization depth.
The stakeholder maps clarified dynamics well. Timelines integrated nicely. Minor icon variety limit.
MBA presentation success thanks to these. Authoritative look under time crunch.
Varied analytical tools covered most needs. Responsive designs work across devices.
FAQ
Will it work in Google Slides?
Are fonts embedded?
Can I use this for client work?
What's the refund policy?
Do you update the template after purchase?
Similar templates
See all PowerPoint Charts →


All 26 slides