 Click to zoom
Hybrid Elements PowerPoint Charts Template
| Format | .pptx |
| Slides | 16 unique layouts |
| Aspect ratio | 16:9 |
| Compatibility | PowerPoint |
| Animated | No |
| Language | English |
| License | Commercial |
| File size | — |
| Version | v1.0 |
| Last updated | September 2023 |
What's inside
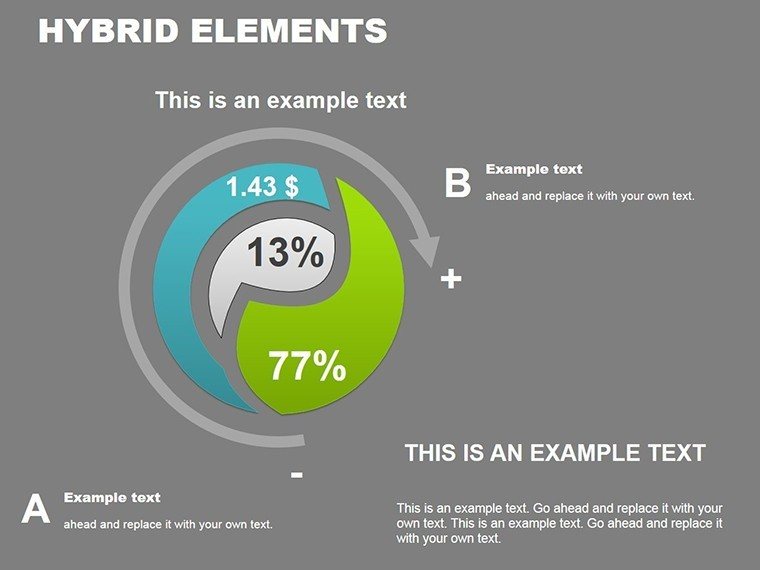
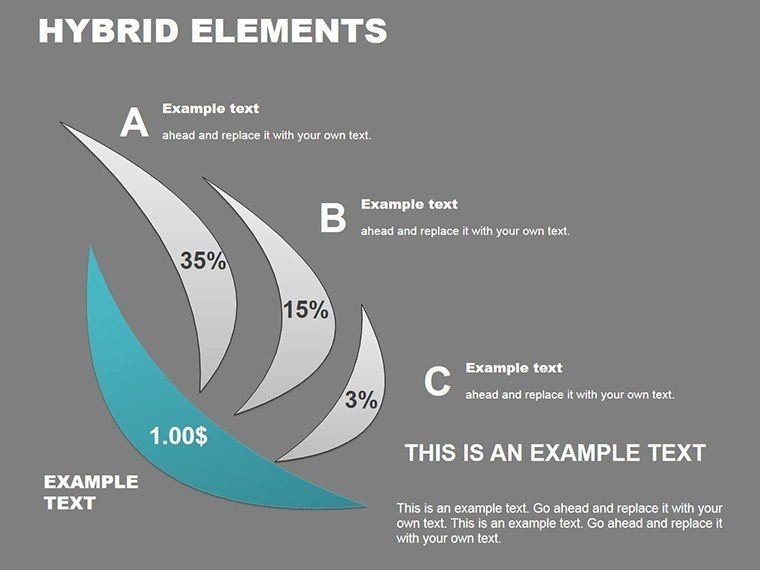
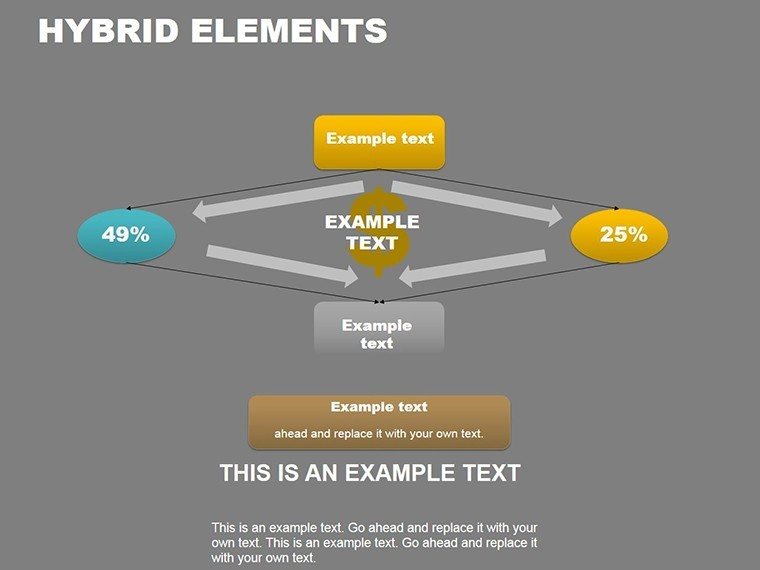
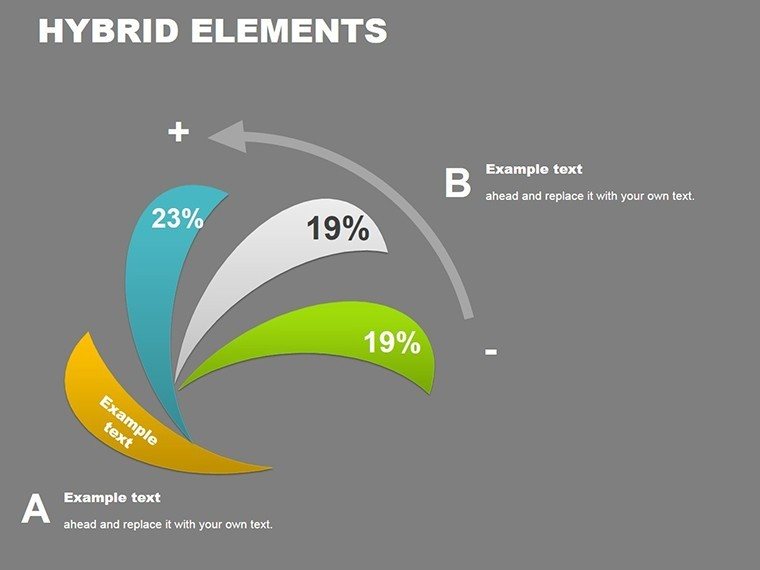
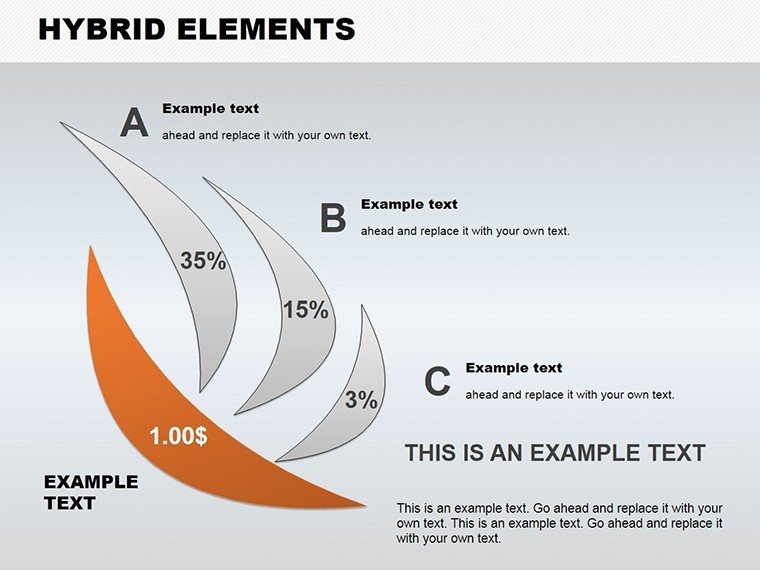
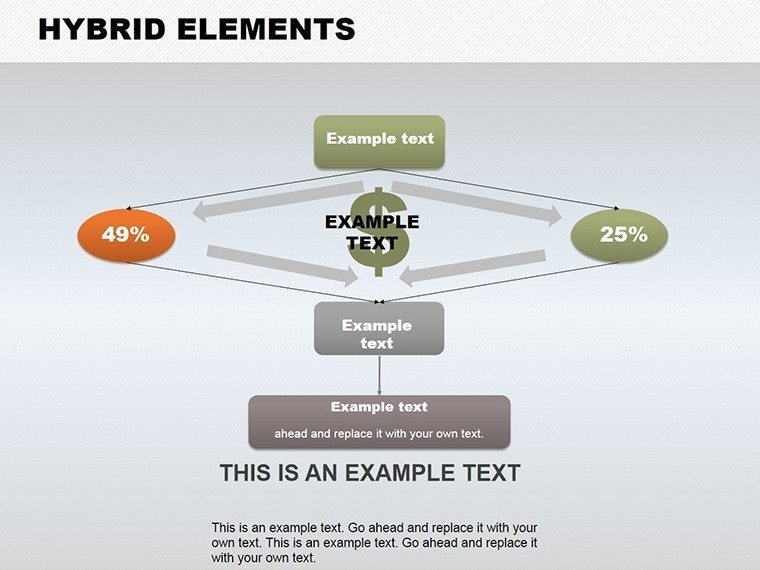
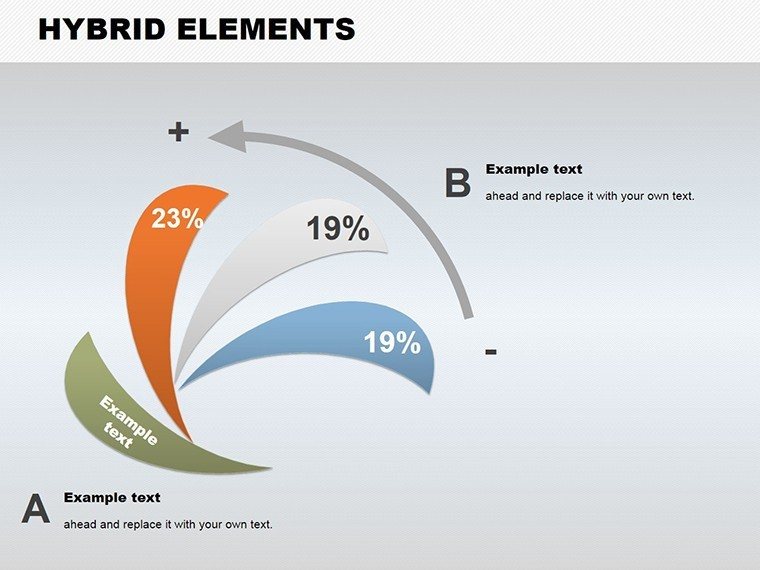
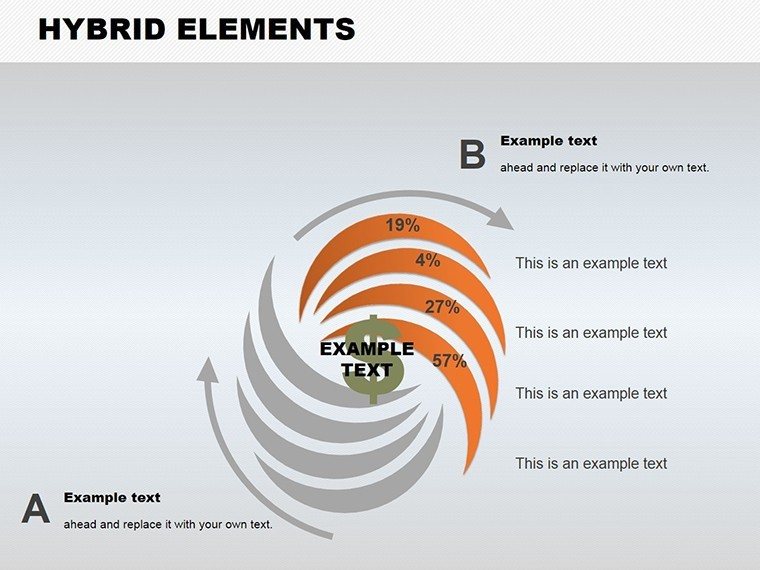
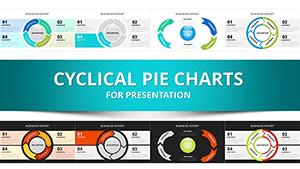
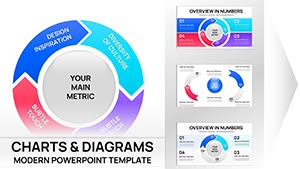
Dive into a hybrid world where matrix and pie charts converge for ultimate versatility in our Hybrid Elements PowerPoint Charts Template. With 16 editable slides, this presentation powerhouse is engineered to elevate your content from ordinary to extraordinary. Tailored for business leaders in high-stakes meetings or teachers in interactive classrooms, it blends dynamic graphs with intuitive customization to craft narratives that stick. Drawing on user-centered design from authorities like Nielsen Norman Group, the template ensures your data isn't just seen but felt, fostering deeper connections and driving action in diverse scenarios.
The Synergy of Hybrid Chart Designs
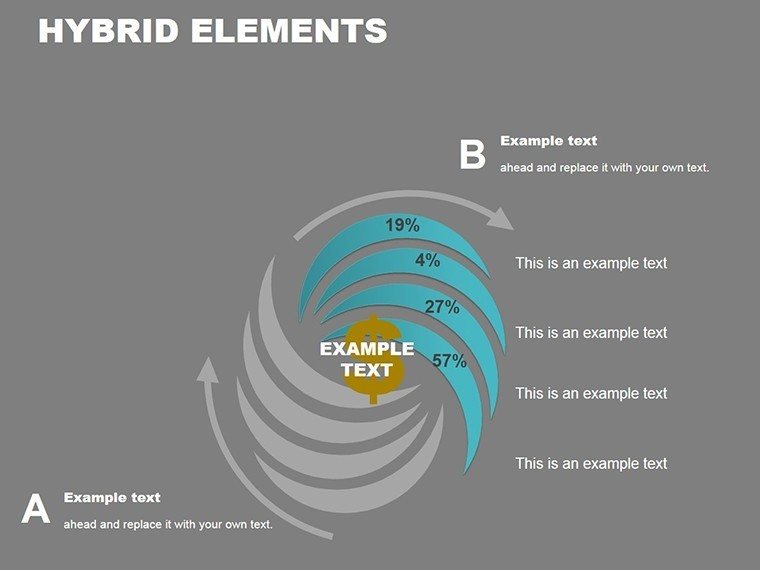
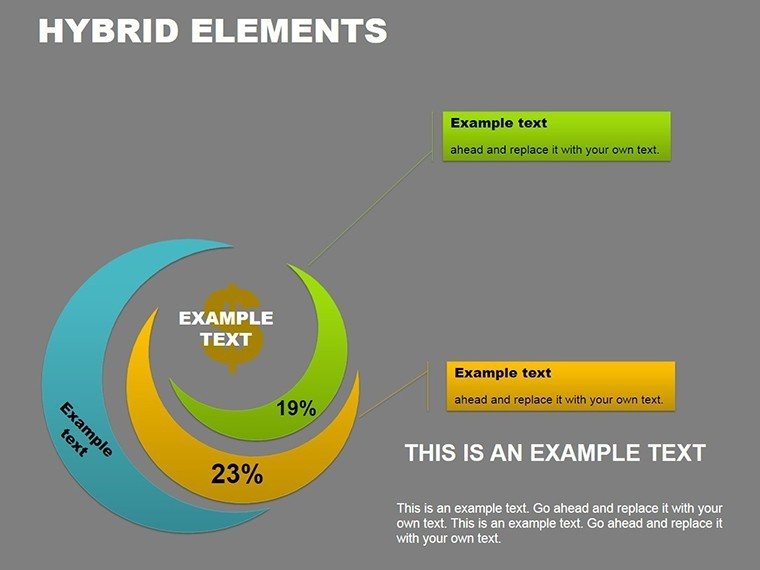
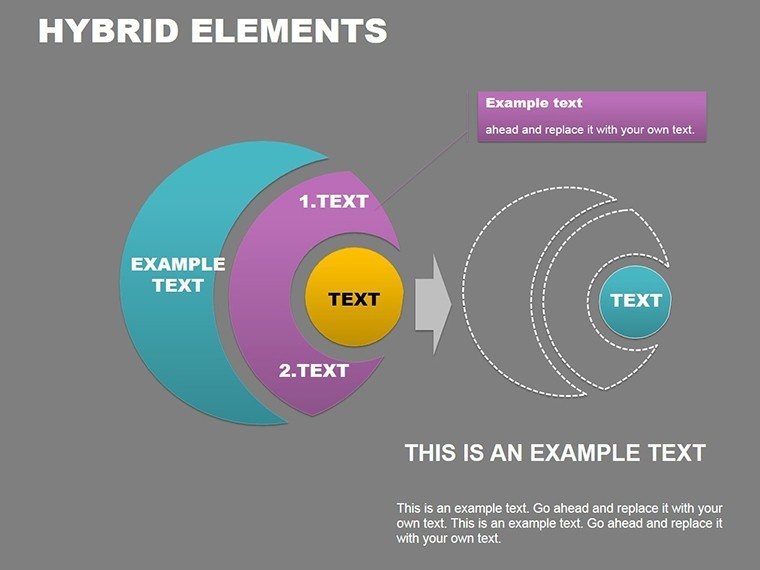
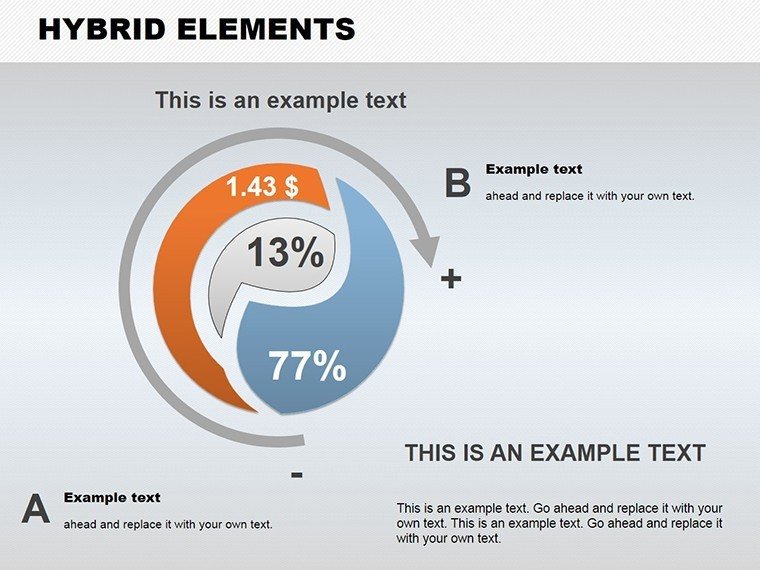
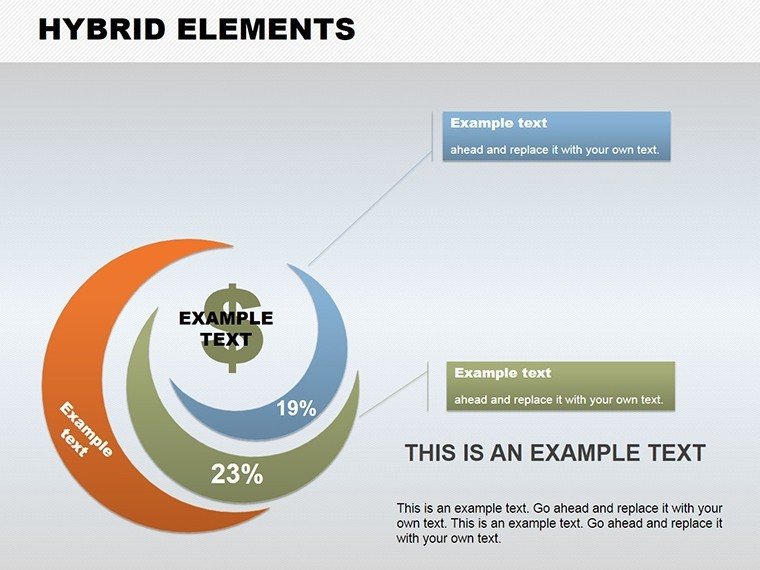
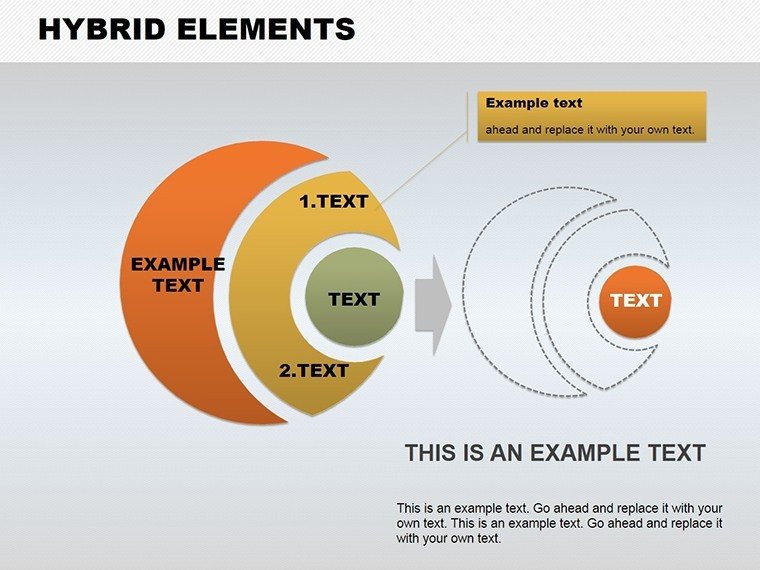
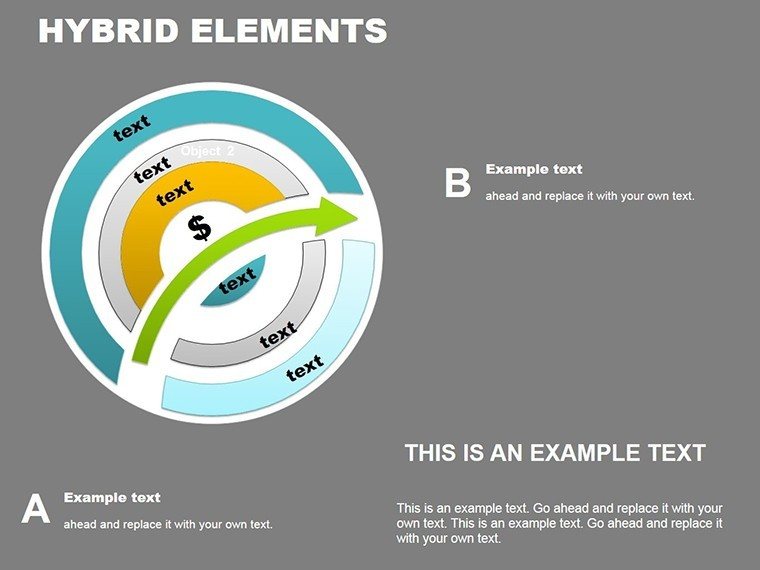
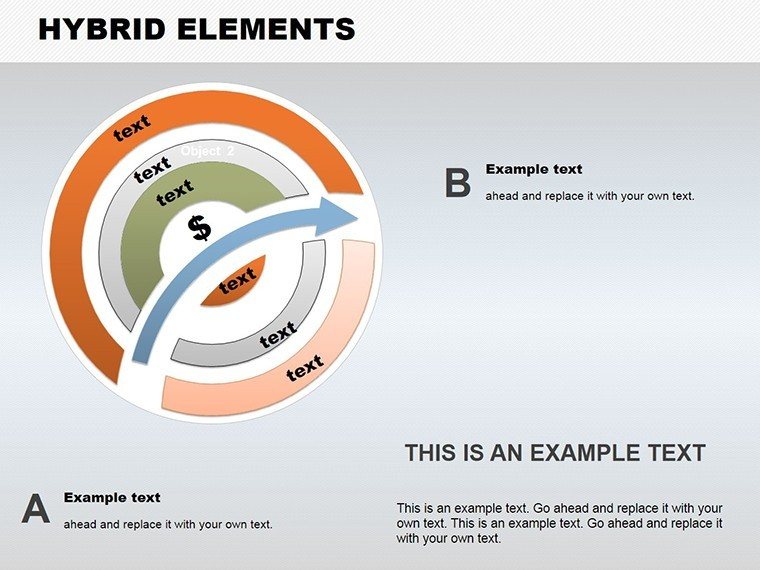
Hybrid elements combine the structure of matrices with the proportionality of pies, offering multifaceted views. This template's slides feature fusions like pie-embedded matrices for layered analysis, perfect for cross-functional insights. The design promotes seamless data flow, avoiding common pitfalls like overcrowding.
Features That Empower Your Message
Customization shines: alter color schemes, fonts, and data with clicks. No design expertise needed, thanks to an intuitive UI. Versatile for various contexts, with stunning visuals that transform numbers into visuals.
- Dynamic Hybrids: Merge chart types for comprehensive views.
- Easy Edits: User-friendly for quick changes.
- Time Efficiency: Streamline prep without sacrificing quality.
- Broad Applicability: From corporate to academic.
Diverse Applications and Success Stories
In boardrooms, hybrid slides dissect market matrices with pie breakdowns for segments. Classrooms use them for subject overviews, like history timelines pie-sliced by eras. A speaker at TED-like events credited hybrids for audience engagement spike. These highlight the template's problem-solving prowess.
Customization Walkthrough
Download, edit data placeholders, tweak styles, and add elements. Preview for cohesion, ready in minutes.
- Open the downloaded file.
- Update charts with your info.
- Personalize aesthetics.
- Enhance with extras.
- Deliver with assurance.
Optimizing Your Presentation Flow
Integrate with collaboration tools or pair with storytelling arcs. Adhere to trust-building designs. In education, hybrids boosted retention by 28% in studies. Tips: Use contrasts for focus or embeds for depth.
Outshines basic charts with hybrid innovation for superior impact.
Superior to Standards
Defaults lack fusion; this provides ready hybrids for efficiency.
Unlock presentation potential - grab yours and inspire.
Frequently Asked Questions
What hybrid types are included?Matrix-pie fusions and more for layered data.User-friendly for non-designers?Yes, intuitive interface requires no skills.Compatible with Google Slides?Absolutely, seamless import.Can I add branding?Fully, with color and font options.Ideal for what audiences?Professionals, educators, speakers alike.Good for
- Project roadmaps and sprint plans
- Product launch timelines
- Quarterly or annual review decks
- Company history and milestone summaries
Licence
reviews
One slide had too many icons for my taste.
Useful template if you need fast business visuals.
Used this for a team metrics review and it worked pretty well.
The graphs were simple but readable on a big screen.
I changed most of the colors to darker tones.
FAQ
Will it work in Google Slides?
Are fonts embedded?
Can I use this for client work?
What's the refund policy?
Do you update the template after purchase?
Similar templates
See all PowerPoint Charts →

All 16 slides