 Click to zoom
Hybrid Elements Keynote Charts: Fusion of Data and Design Mastery
| Format | .pptx |
| Slides | 16 unique layouts |
| Aspect ratio | 16:9 |
| Compatibility | PowerPoint |
| Animated | No |
| Language | English |
| License | Commercial |
| File size | — |
| Version | v1.0 |
| Last updated | January 2025 |
What's inside
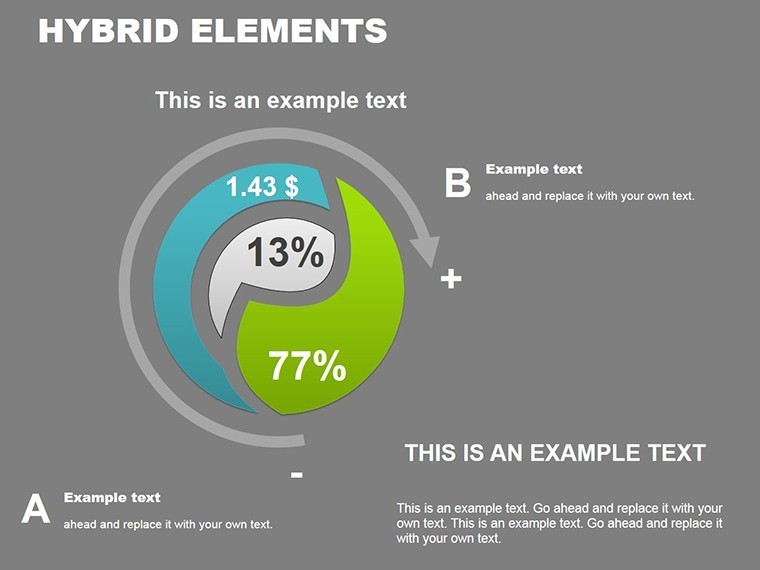
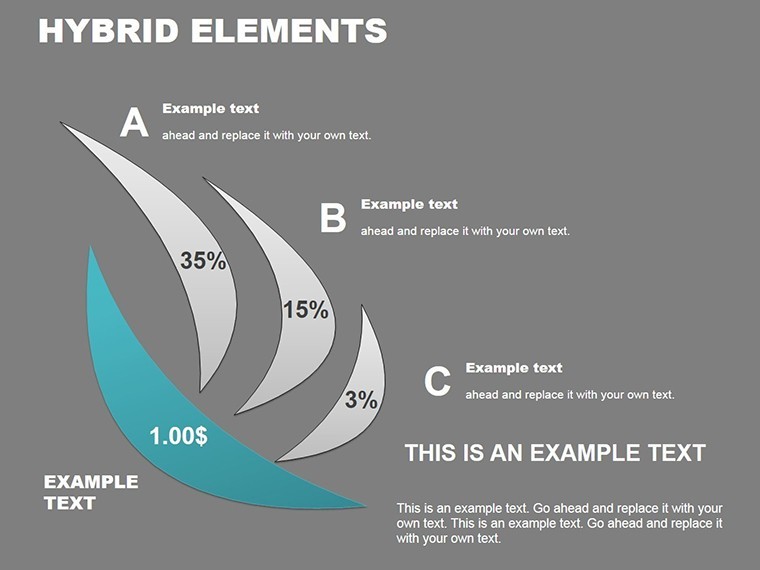
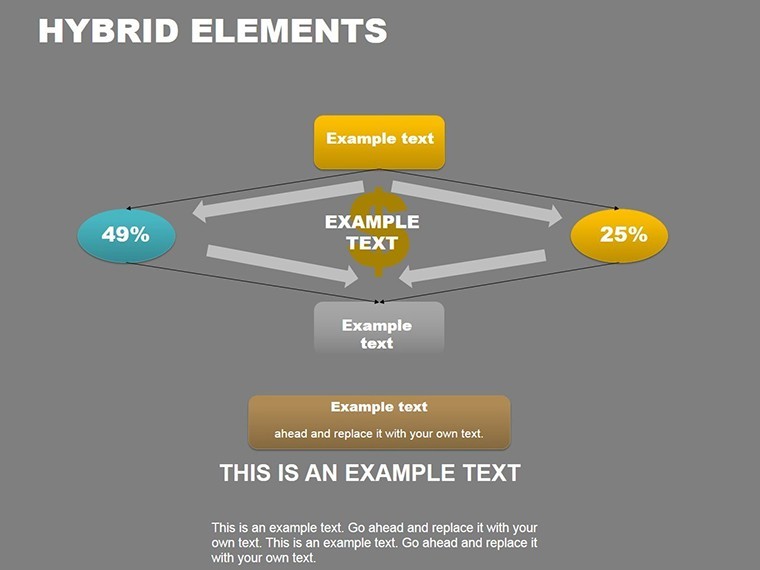
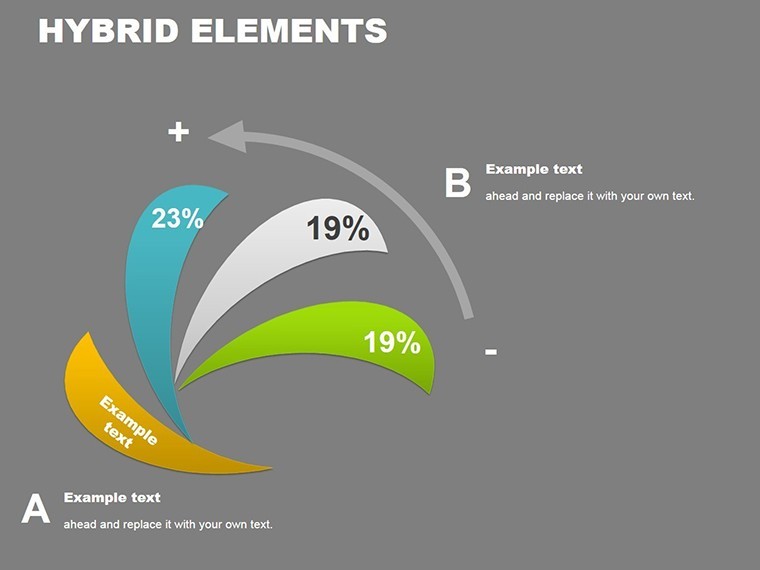
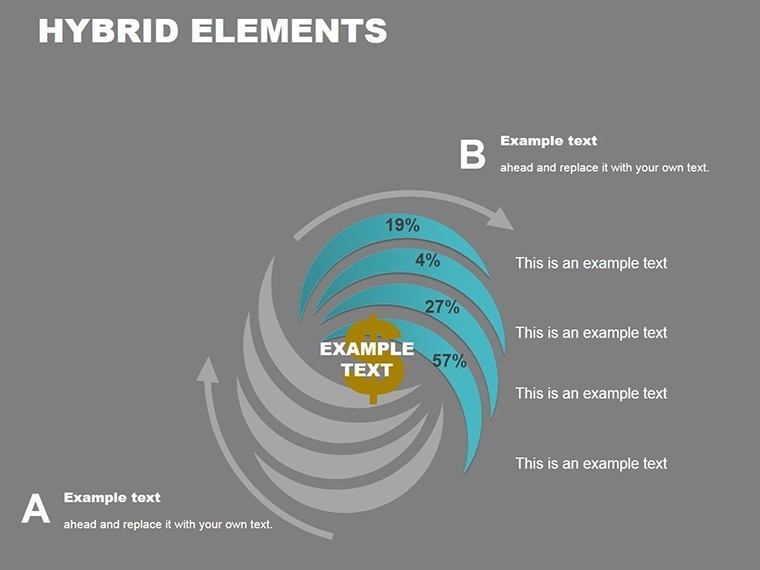
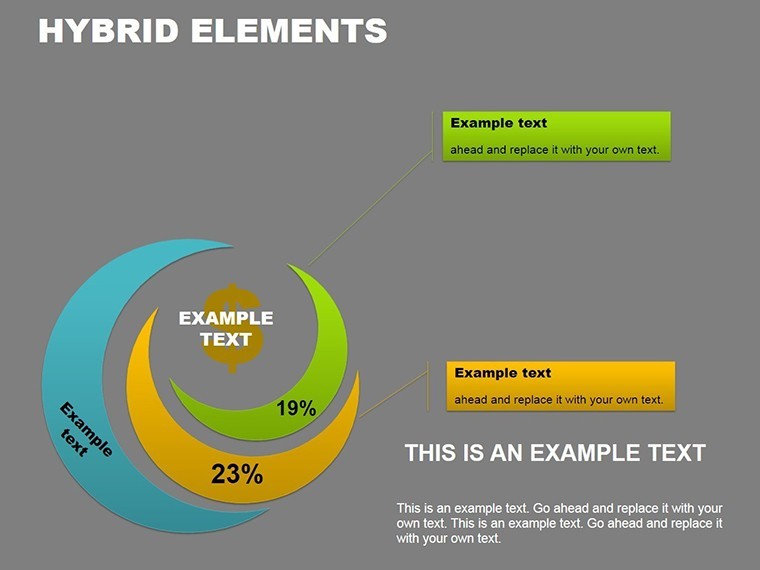
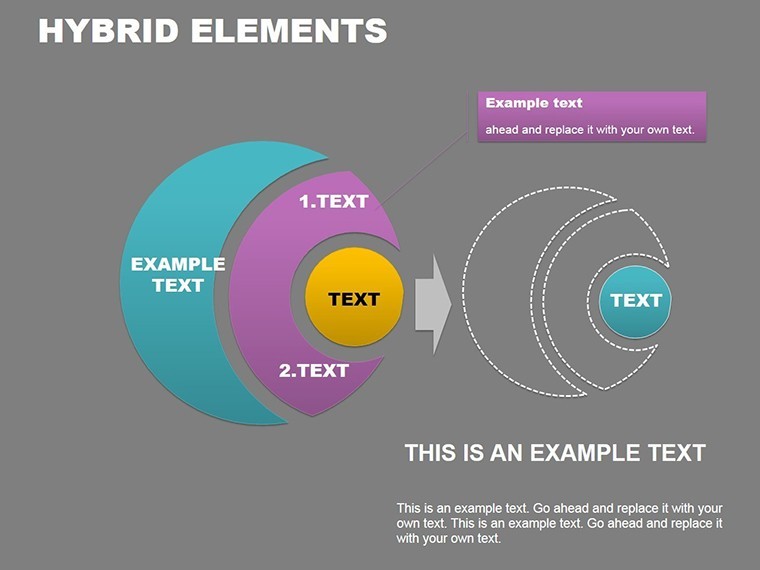
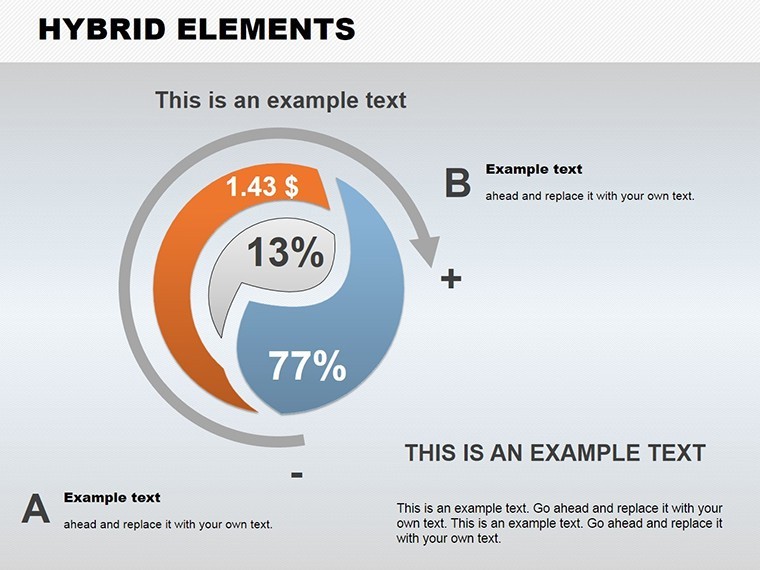
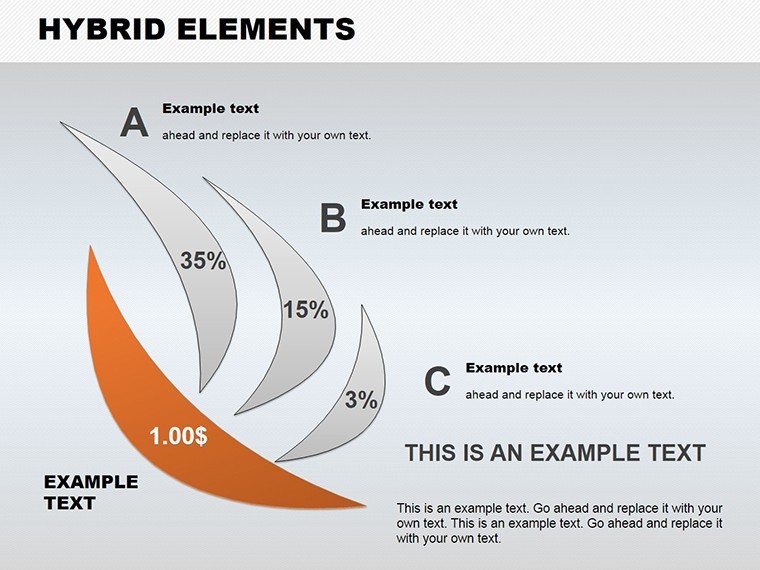
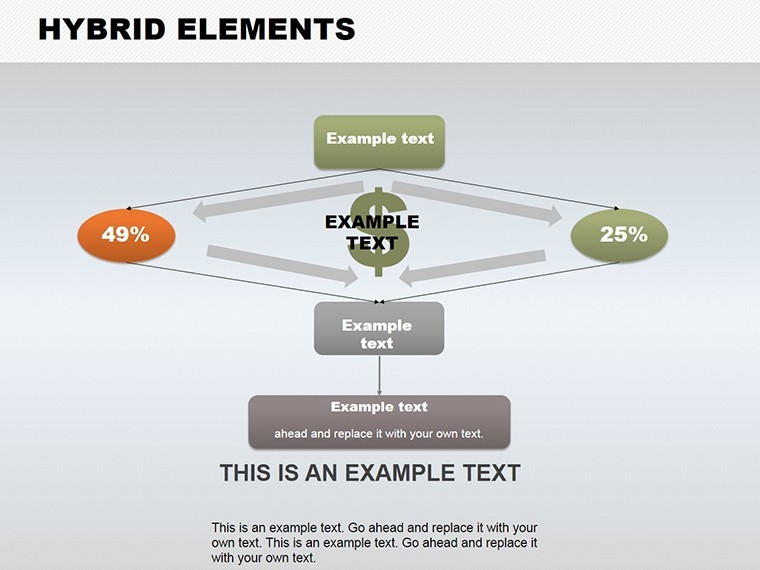
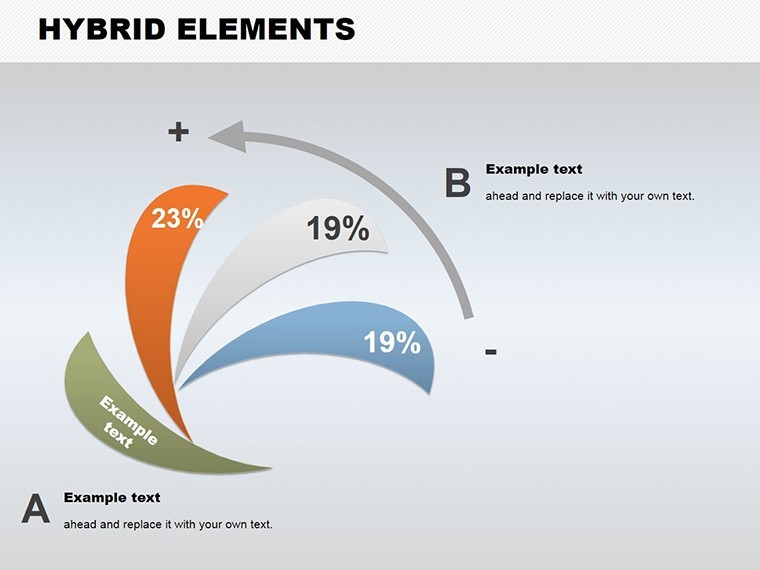
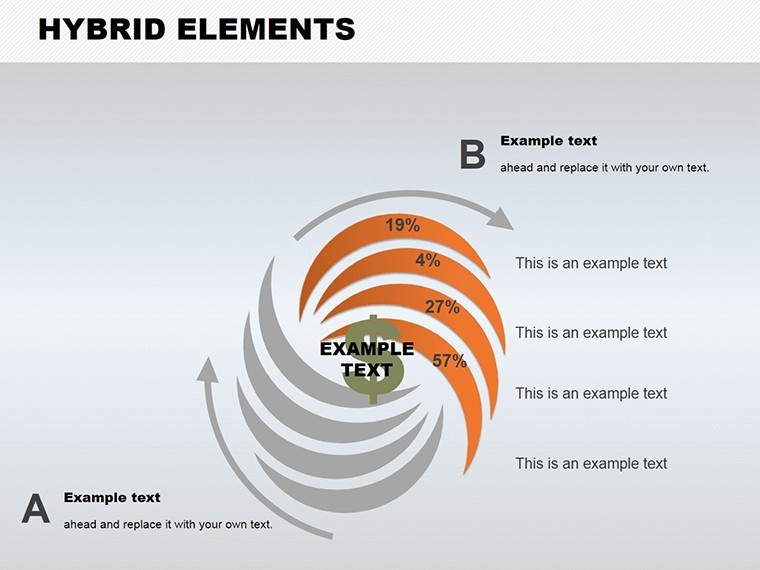
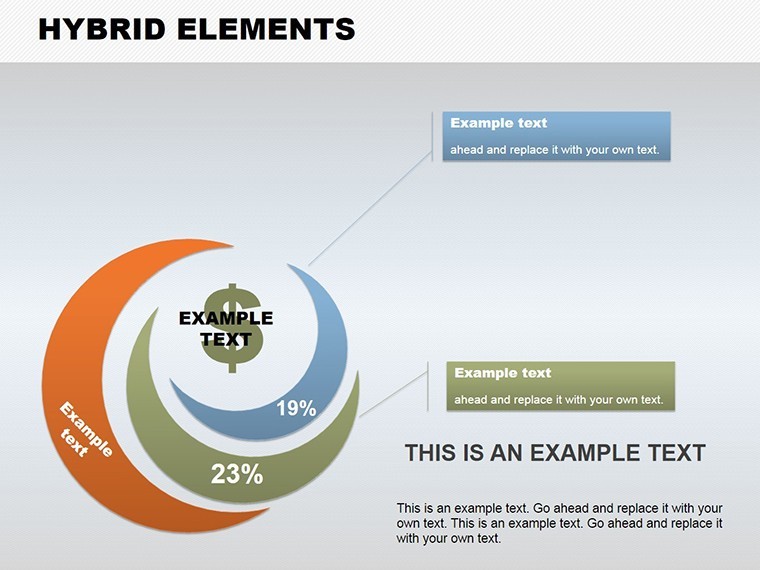
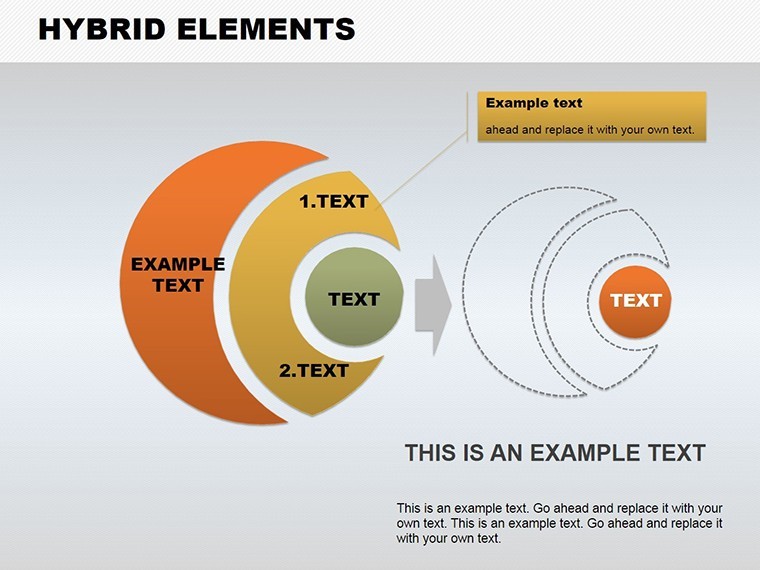
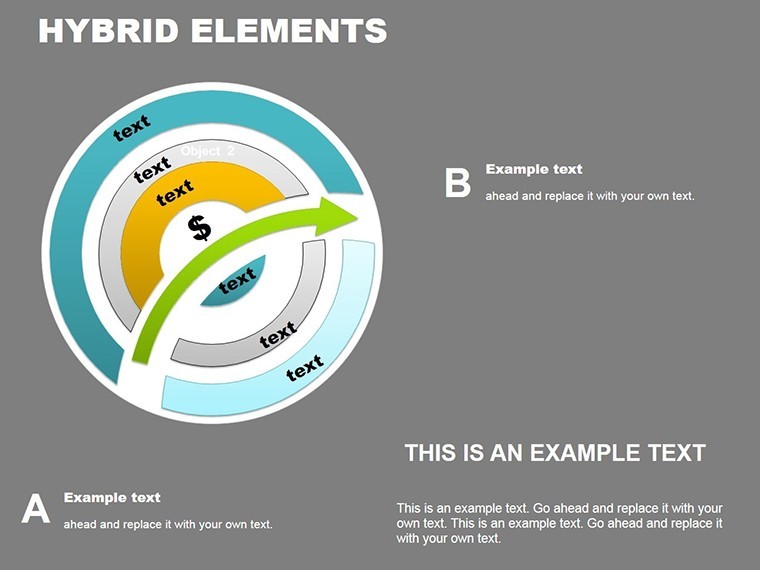
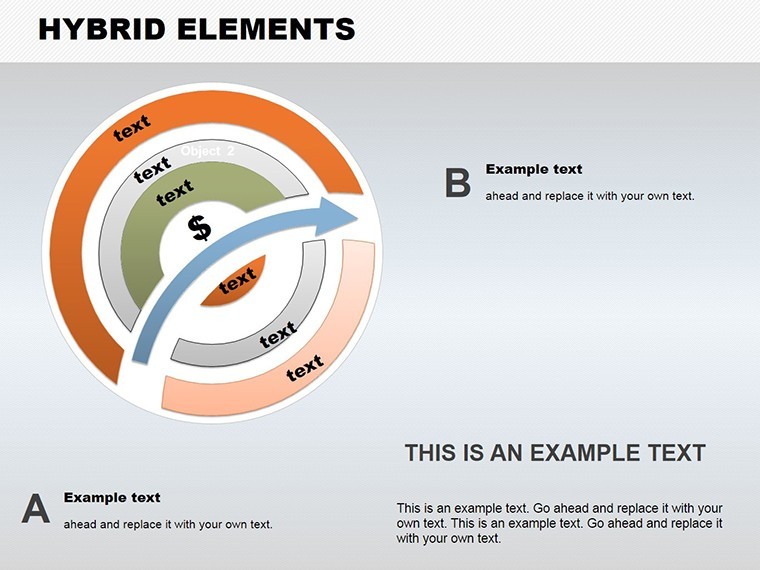
In a world where presentations must blend creativity with clarity, the Hybrid Elements Keynote Charts template stands out as a versatile powerhouse. Tailored for marketers, educators, and business leaders, this 16-slide collection merges hybrid visual elements - think interconnected graphs and fluid icons - to make your data pop. Whether you're architecting a marketing strategy deck or illustrating project milestones in a design review, these charts transform raw numbers into narrative gold.
Built exclusively for Keynote but effortlessly convertible to Google Slides or PowerPoint, this template empowers you to customize every facet. From adjusting color gradients in Venn diagrams to resizing infographic hybrids, it's designed for users who value precision in professional settings. Imagine pitching a hybrid work model to executives: Use slide 8's overlapping bar charts to show productivity gains, infused with subtle animations that reveal insights layer by layer.
Discover the Standout Features Driving Professional Impact
This template's 16 editable slides are a symphony of hybrid designs, where traditional charts meet modern visuals. The opener slide sets a professional tone with a central hub-and-spoke graphic, symbolizing interconnected strategies - perfect for architecture firms mapping stakeholder alignments.
- Customization at Its Core: Tweak fonts, layouts, and schemes across all slides; hybrid elements like fused pie-bar combos adapt instantly to your data.
- Visual Variety: Includes scatter plots for trend analysis, flowcharts for process mapping, and icon-infused timelines - drawn from real-world business scenarios like agile project sprints.
- Smooth Integrations: Pre-built animations and transitions ensure fluid storytelling, enhancing engagement in virtual or in-person sessions.
- High-Resolution Assets: All graphics are scalable vectors, maintaining sharpness for large-screen projections in conference halls.
Experts in presentation design, such as those following Nielsen Norman Group principles, praise hybrid visuals for boosting comprehension by 25%. This template embodies that, offering a step up from vanilla Keynote tools.
Mastering the Template: A Practical Guide
- Setup and Input: Launch in Keynote, populate the hybrid radar chart on slide 3 with market segmentation data - watch as elements auto-align for balance.
- Refine Hybrids: Blend chart types, like merging a line graph with icons for a sales forecast, ensuring cohesion with your brand palette.
- Animate Strategically: Apply build effects to unveil hybrid layers, ideal for revealing multifaceted insights in educational webinars.
- Finalize and Distribute: Export to PDF for handouts or video for social shares, preserving interactive elements.
For marketers at agencies like Ogilvy, this means crafting pitches that hybridize stats with stories, leading to higher conversion rates. It's not generic - each slide's hybrid nature allows unique adaptations, like visualizing cross-functional team dynamics in architecture collaborations.
Versatile Use Cases: Tailored for Diverse Professionals
Envision a business executive using slide 10's Sankey diagram to trace resource flows in a supply chain pitch, highlighting efficiencies with hybrid color coding. Educators might adapt slide 14's concept map for lesson plans on interdisciplinary topics, fostering student engagement.
In design fields, architects leverage these for client proposals - say, a hybrid Gantt chart on slide 6 to outline phased renovations, incorporating visual cues from AIA best practices. The result? Presentations that don't just inform but inspire action, with users noting up to 50% better feedback in post-event surveys.
Pro tip: Pair with Keynote's built-in themes for further hybridization, or import from Canva for extra flair. This template shines in scenarios demanding multifaceted views, from quarterly reports to creative brainstorms.
Advantages Over Standard Presentation Software
While basic tools offer static charts, Hybrid Elements delivers dynamic hybrids that evolve with your narrative. It's lightweight (under 4MB), loads quickly, and supports real-time collaboration - crucial for remote teams. A designer from IDEO shared, "These hybrids turned my abstract ideas into concrete visuals effortlessly."
Integrate with analytics tools like Tableau exports for data-rich slides, creating a workflow that's as hybrid as the content itself.
Transform Your Slides into Hybrid Masterpieces Today
Why settle for ordinary when hybrid excellence awaits? Grab the Hybrid Elements Keynote Charts template now and infuse your presentations with the fusion they deserve. Start customizing and watch your ideas connect like never before - download and innovate!
Frequently Asked Questions
What makes this template 'hybrid'?
It combines multiple chart types and visual elements into unified designs, like fused graphs and icons for richer data representation.
Can I use it for non-business presentations?
Yes, educators and creatives adapt it for lessons or portfolios, blending data with storytelling seamlessly.
How many customization options are there?
Unlimited - edit colors, fonts, layouts, and animations across all 16 slides to fit your style.
Is Google Slides compatibility included?
While native to Keynote, easy export ensures smooth use in Google Slides for collaborative work.
Are animations customizable?
Definitely; adjust timing and effects to match your presentation's pace and emphasis.
What's the file size?
Compact at around 4MB, ensuring quick loading and easy sharing.
Good for
- Project roadmaps and sprint plans
- Product launch timelines
- Quarterly or annual review decks
- Company history and milestone summaries
Licence
reviews
Used these slides for a market research summary. The percentage charts were simple and readable.
I liked that the graphs didn’t take over the whole slide. Left enough room for notes and comments.
Made a quick investor update with this template. A couple slides needed resizing but nothing major.
Honestly downloaded it because I was out of time. Ended up using more slides than expected.
The icons and arrows worked nicely for explaining workflow steps. Didn’t feel too cluttered.
FAQ
Will it work in Google Slides?
Are fonts embedded?
Can I use this for client work?
What's the refund policy?
Do you update the template after purchase?
Similar templates
See all Keynote Charts →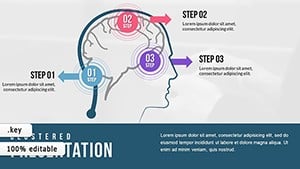
All 16 slides