 Click to zoom
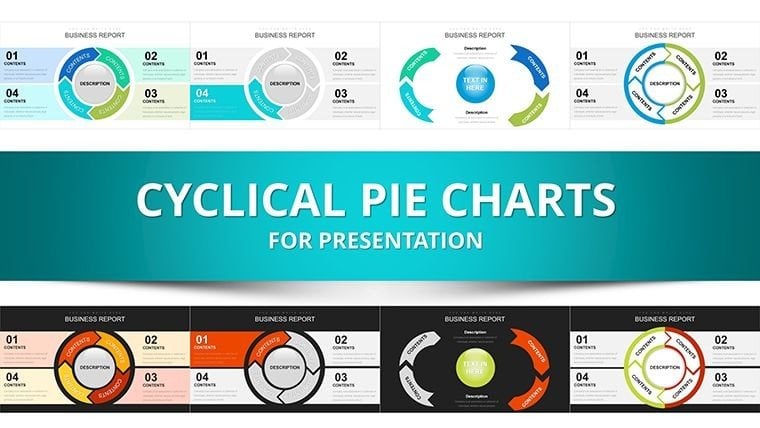
Cyclical Pie Charts Template for PowerPoint - 29 Editable Slides
| Format | .pptx |
| Slides | 29 unique layouts |
| Aspect ratio | 16:9 |
| Compatibility | PowerPoint |
| Animated | No |
| Language | English |
| License | Commercial |
| File size | — |
| Version | v1.0 |
| Last updated | December 2025 |
What's inside
When executives scan quarterly reports or investors evaluate subscription models, they need visuals that capture not just proportions, but the endless momentum of recurring elements. Traditional pies stop at division - this dynamic cyclical collection adds flowing arrows and volumetric spheres to turn proportional data into vivid, perpetual narratives that drive home continuity and impact.
Across 29 specialized slides, I've used these exact layouts in real client work to clarify resource recirculation in enterprise operations and renewal patterns in revenue forecasts, ensuring audiences instantly grasp the looping dynamics without lengthy explanations.
Breaking Down the Dynamic Cycle Designs
Each slide elevates standard segmentation with purposeful motion and depth elements tailored for recurring themes.
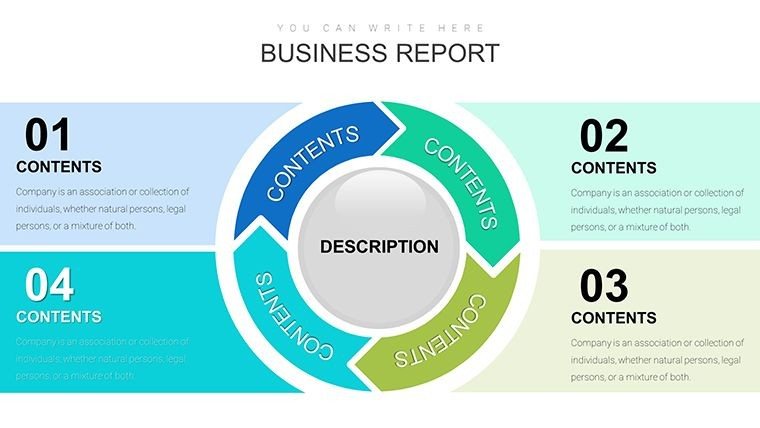
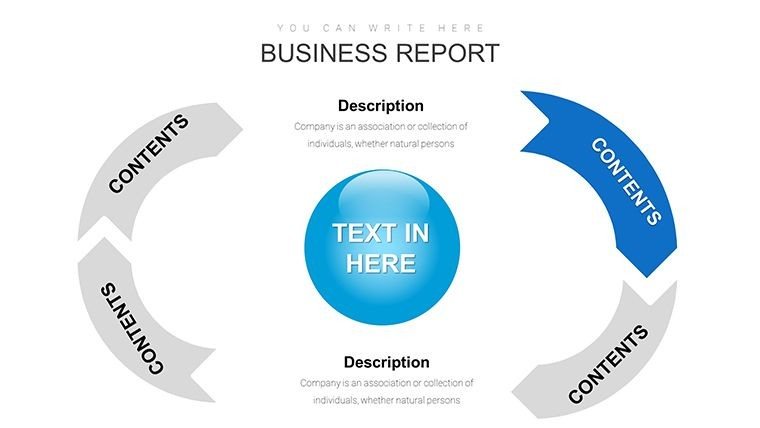
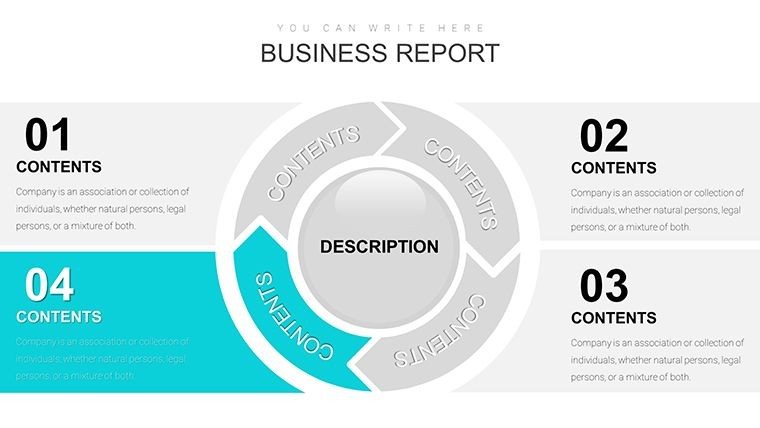
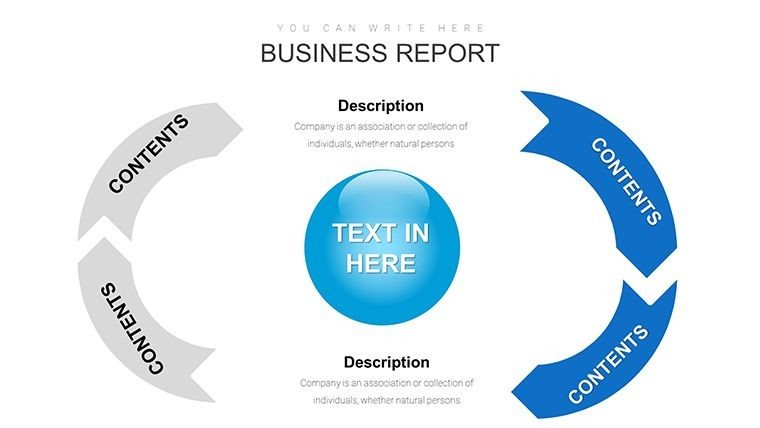
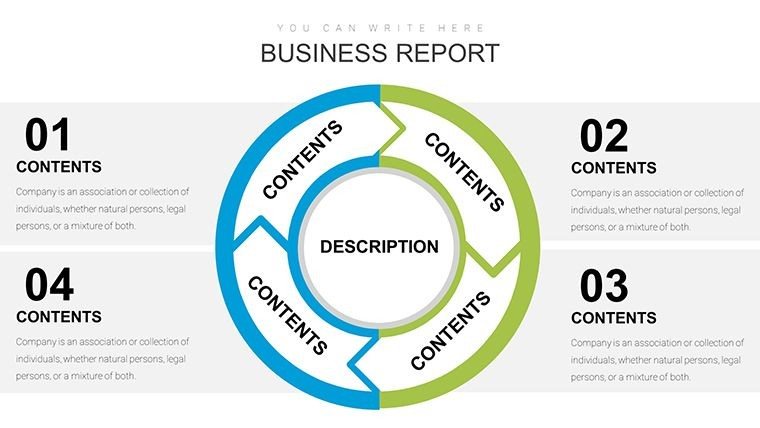
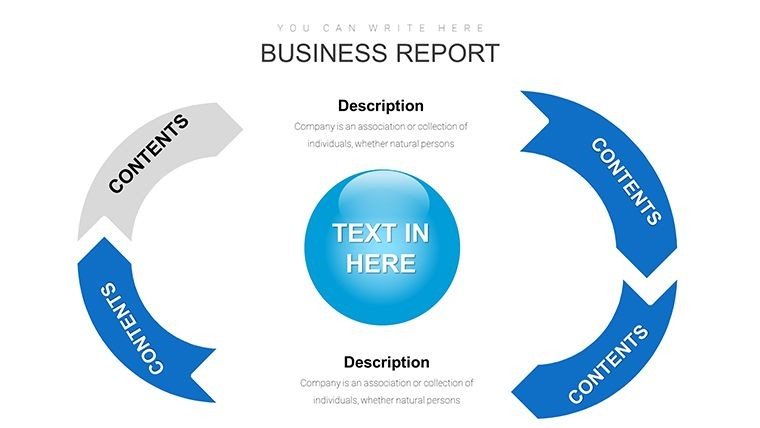
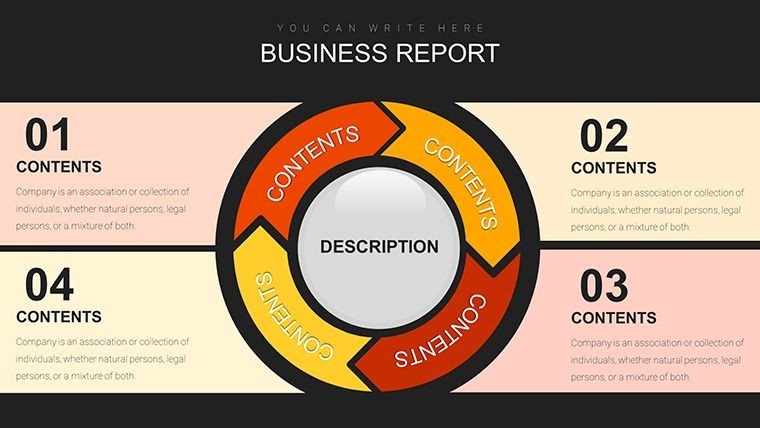
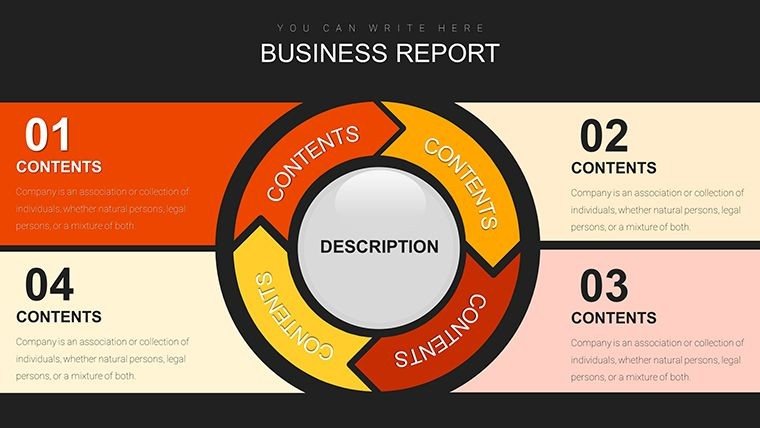
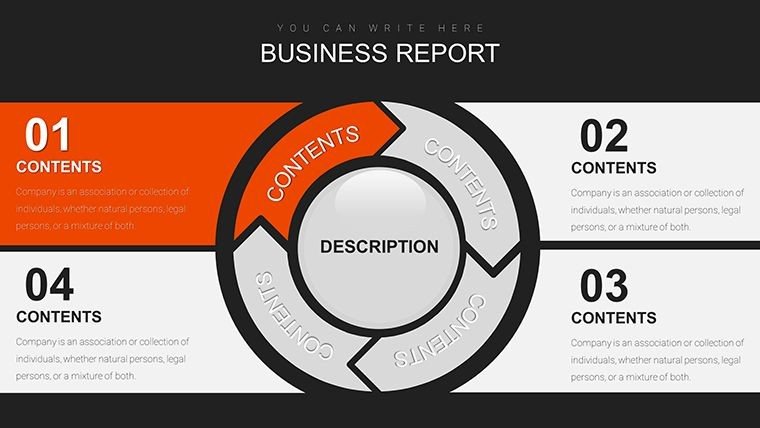
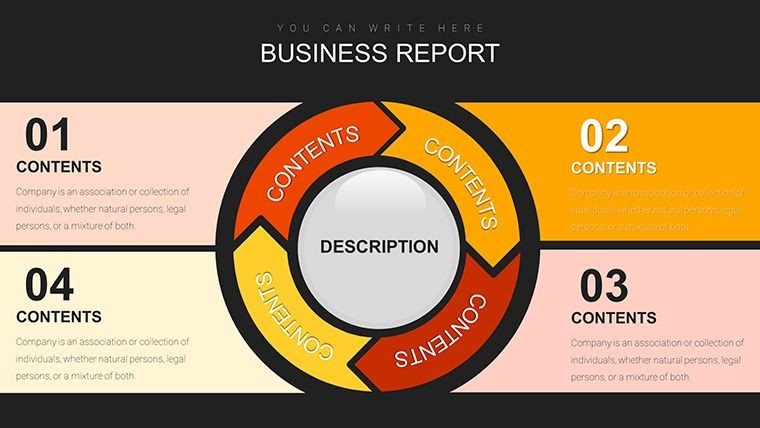
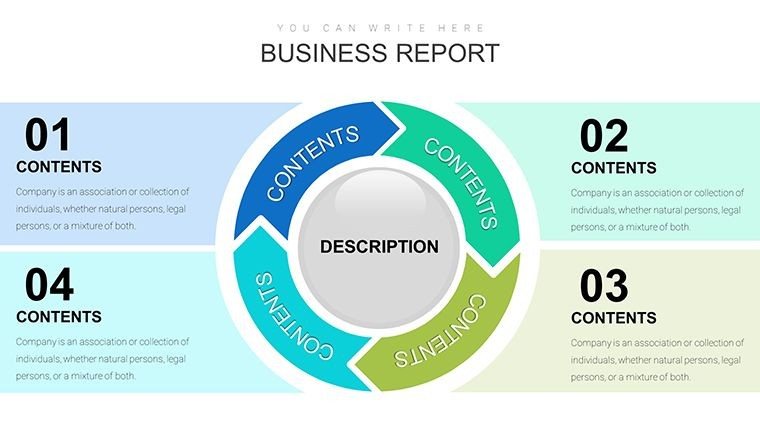
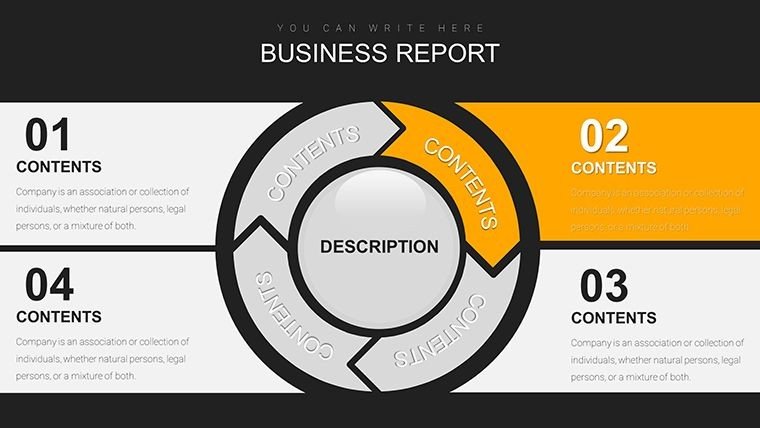
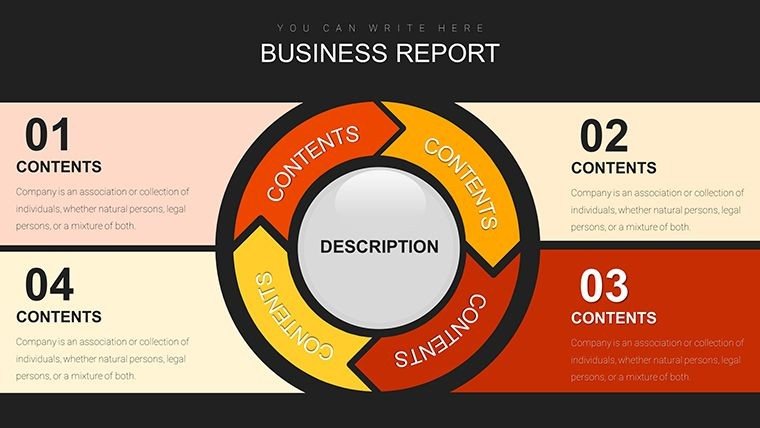
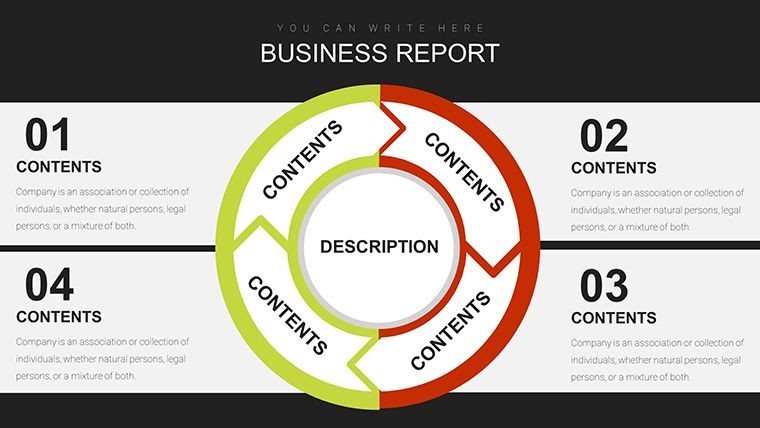
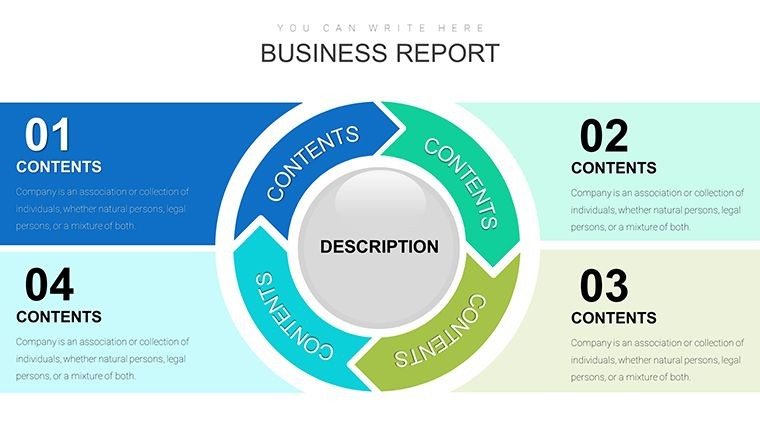
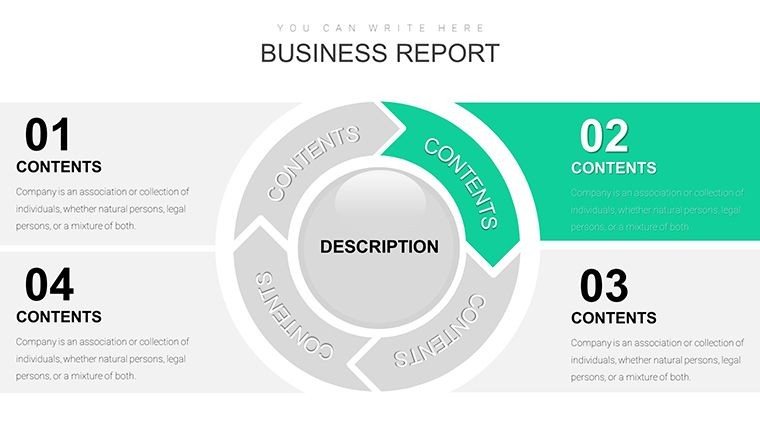
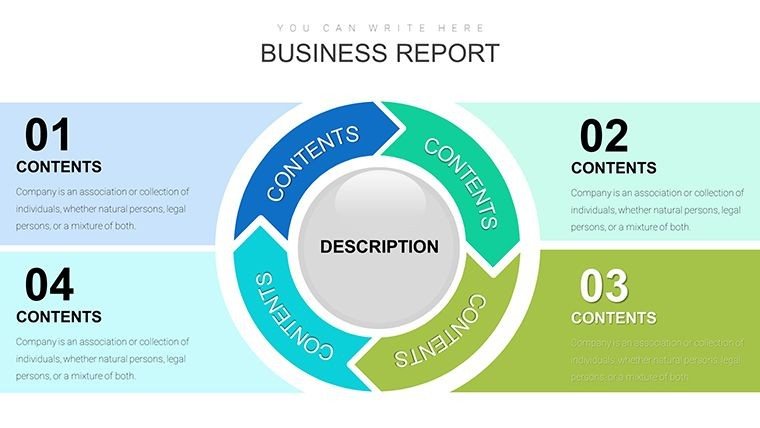
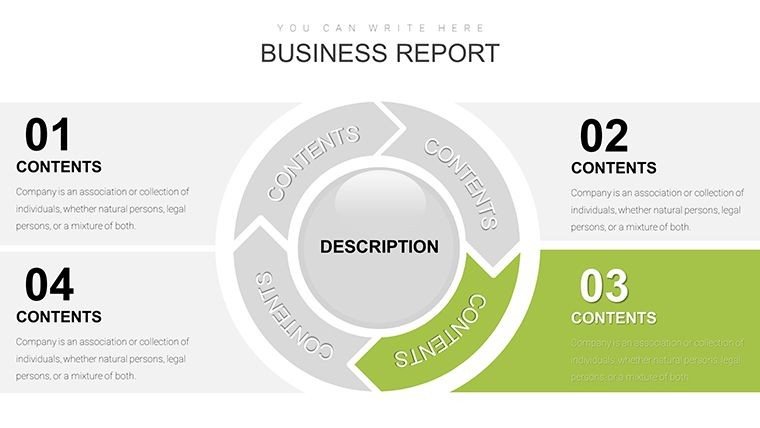
- Arrow-wrapped cores: Curved directional paths encircling pie divisions to illustrate outputs seamlessly re-entering inputs.
- Spherical emphasis variants: 3D orbs at key junctions highlighting volume shifts in repeated cycles.
- Layered loop structures: Concentric pies interconnected by flowing arrows for complex interdependent recurrences.
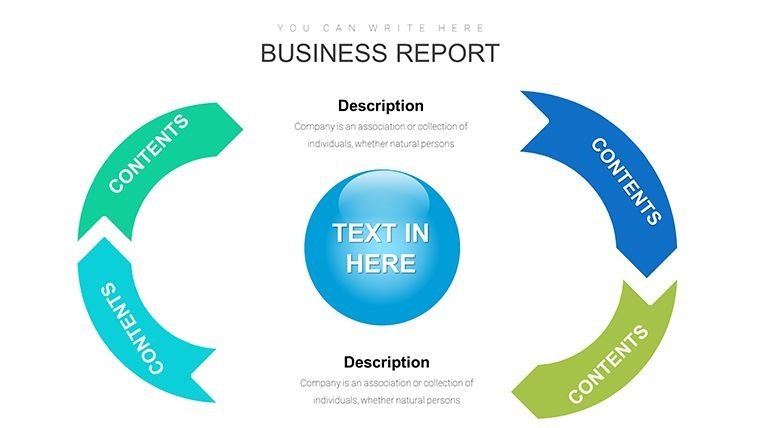
- Flow-dominant options: Bold arrow systems dominating the layout while anchoring proportional segments.
Fully responsive editing preserves the energetic cyclical feel as you input data and refine visuals.
Professional Contexts for Cyclical Data Storytelling
These designs shine when proportions evolve in loops, from operational efficiencies to market reinvestments.
In board-level strategy discussions, cyclical visuals have helped my clients depict customer lifecycle recirculations, making retention strategies visually intuitive. Government sustainability reports gain traction showing closed-material loops, while corporate trainers illustrate feedback mechanisms in process improvement programs.
Revenue and Subscription Management
Map renewal proportions feeding growth engines with clear directional flows.
Supply Chain and Logistics
Highlight inventory recirculation and waste-to-input conversions.
Innovation and R&D Cycles
Visualize idea-to-implementation loops with proportional impact markers.
Effortless Addition to Your Deck Building Process
Compatible with PowerPoint 2016 and newer, plus smooth Google Slides and Keynote imports. Select elements, update data ranges, and watch cycles adapt instantly - ideal for last-minute adjustments before high-pressure meetings.
The structured layers accelerate refinements, freeing you to perfect the story rather than wrestle with alignments.
Grab this collection instantly to infuse your next deck with dynamic cyclical energy.
Proven Scenarios from Client Presentations
In a SaaS funding round, arrow-guided cyclical pies demonstrated churn-to-loyalty loops, directly contributing to valuation discussions. Operational reviews for manufacturing clients used spherical accents to pinpoint bottleneck volumes in material reuse cycles.
Leadership workshops on continuous learning featured these slides to map skill application feedback loops, reinforcing key takeaways visually. Market analysts presented seasonal demand recirculations, guiding strategic resource planning.
Clear Benefits Versus Standard Methods
ElementThis Dynamic Cyclical TemplateBuilt-in Chart ToolsManual Custom CreationMotion and ContinuityBuilt-in arrows and spheres for inherent flowFlat, motionless segmentsTedious shape positioningDesign Consistency29 cohesive professional variationsLimited thematic optionsRisk of uneven aestheticsPreparation SpeedRapid data population and tweaksBasic functionality onlyExtensive time investmentVisual EngagementEnergetic loops that hold attentionStandard and quickly overlookedDependent on skill levelTailored Uses by Sector
Tech startups showcase user engagement loops. Finance departments detail capital reinvestment cycles.
Healthcare teams map care pathway recirculations. Marketing professionals illustrate brand reinforcement flows.
Consultants highlight client process optimization loops, and academics demonstrate environmental cycle proportions.
Elevate your recurring data presentations with this dynamic template - download today and create visuals that flow endlessly.
Frequently Asked Questions
How quickly can I adapt these cyclical designs to my brand colors?
Select any element group and apply your palette globally or per component in moments, with arrows and spheres updating cohesively.
Will the dynamic arrows stay aligned when I change segment sizes?
Yes, smart anchoring ensures arrows and flows adjust automatically to new proportions for flawless continuity.
Are there options for animating the cyclical reveal in live sessions?
Pre-built subtle animations sequence segments and arrows, fully editable for custom timing to build the loop narrative.
Can I combine multiple cyclical pies on a single slide for comparisons?
Dedicated layouts support side-by-side or overlaid cycles, ideal for before-after recurrence scenarios.
Do these export cleanly to PDF for stakeholder distribution?
Vector-based elements maintain sharpness and depth in exports, ensuring professional appearance in shared documents.
What data types work best with these dynamic cyclical charts?
Percentage breakdowns of recurring elements like renewals, reuses, or feedback volumes integrate seamlessly.
Good for
- Project roadmaps and sprint plans
- Product launch timelines
- Quarterly or annual review decks
- Company history and milestone summaries
Licence
reviews
Used this for a goal achievement.
The fill is blue like water.
The waterline chart for progress.
The bar with a water line.
FAQ
Will it work in Google Slides?
Are fonts embedded?
Can I use this for client work?
What's the refund policy?
Do you update the template after purchase?
Similar templates
See all PowerPoint Charts →

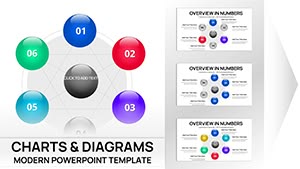

All 29 slides