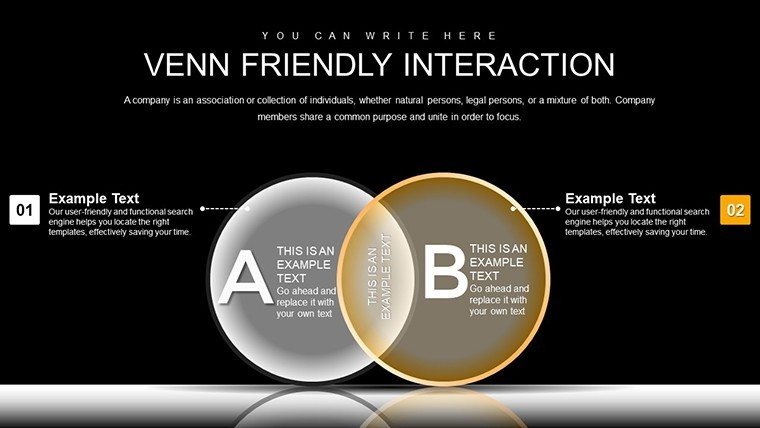
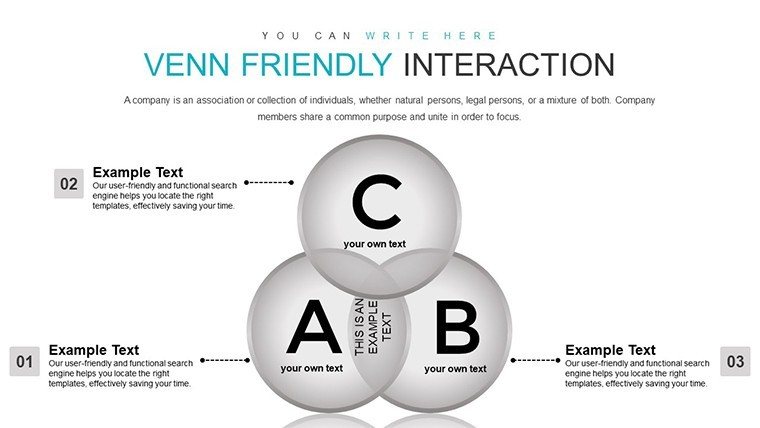
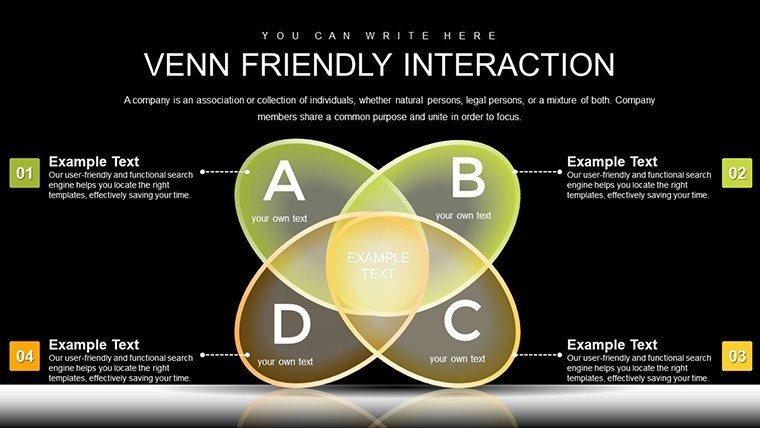
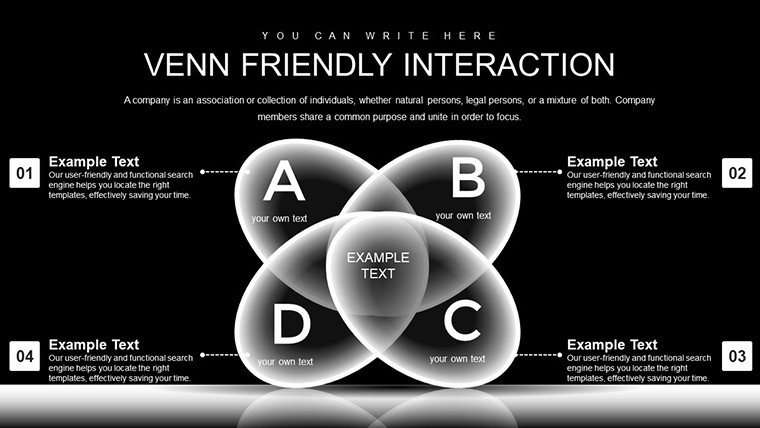
 Click to zoom
Graphic Venn PowerPoint Charts Template: Visualize Connections Effortlessly
| Format | .pptx |
| Slides | 39 unique layouts |
| Aspect ratio | 16:9 |
| Compatibility | PowerPoint |
| Animated | No |
| Language | English |
| License | Commercial |
| File size | — |
| Version | v1.0 |
| Last updated | August 2023 |
What's inside
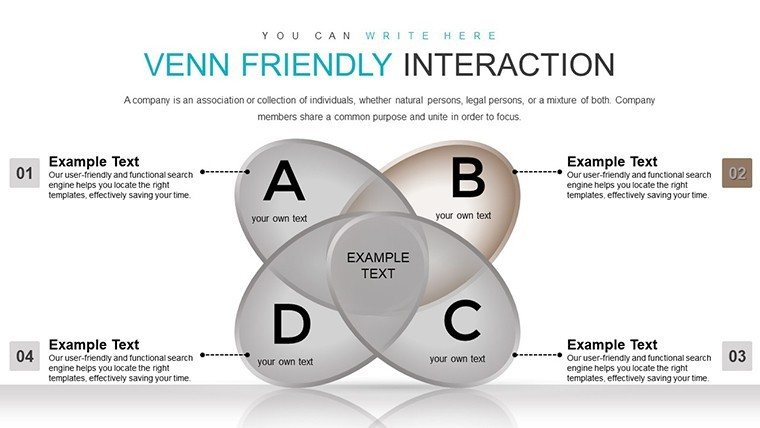
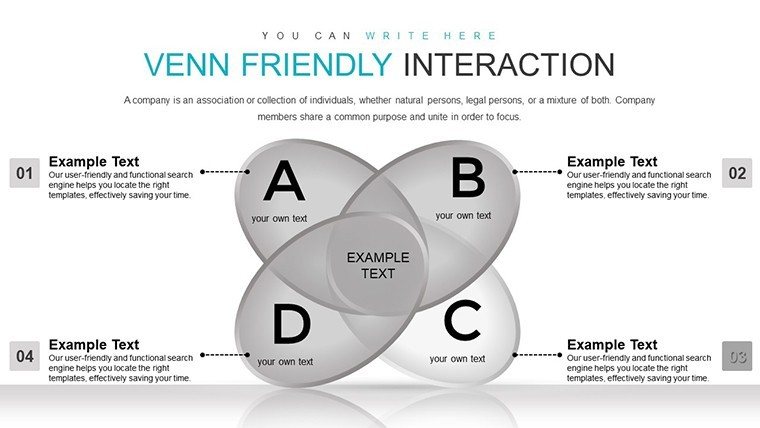
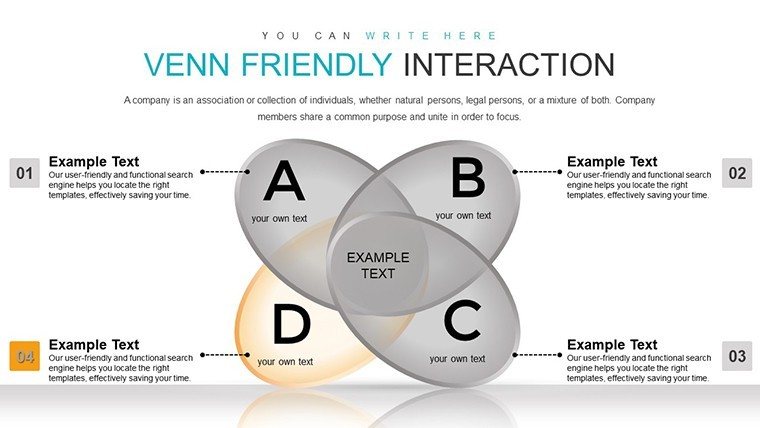
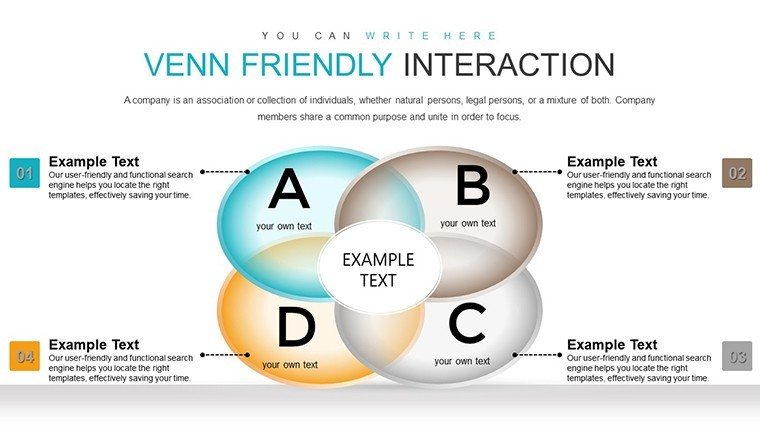
When it comes to illustrating relationships and intersections in data, nothing beats the clarity of a well-designed Venn diagram. Our Graphic Venn PowerPoint Charts Template brings this classic tool into the modern era with 39 editable slides tailored for professionals across industries. Whether you're a corporate executive mapping market overlaps, an educator explaining set theories, or a consultant highlighting synergies in client strategies, this template empowers you to create presentations that resonate. Featuring vibrant colors, sleek designs, and intuitive customization, it turns abstract concepts into tangible visuals. Compatible with PowerPoint and Google Slides, it's built on principles from data visualization experts like Edward Tufte, ensuring minimalism and maximum impact. Dive into a world where your ideas connect visually, saving you time while boosting audience engagement - perfect for those high-stakes moments where clarity wins the day.
Standout Features for Dynamic Presentations
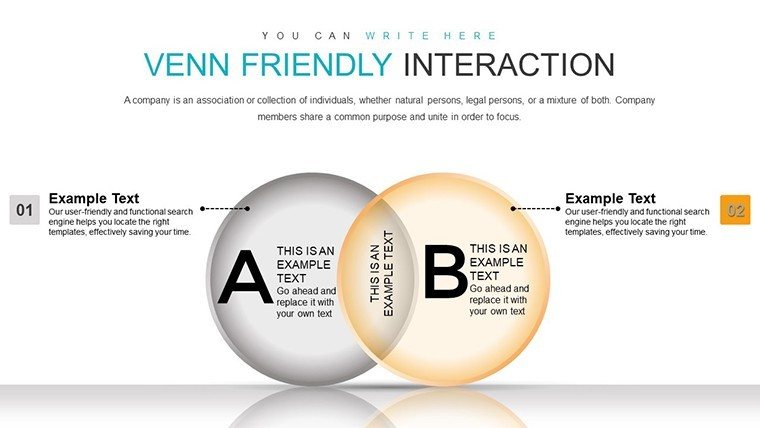
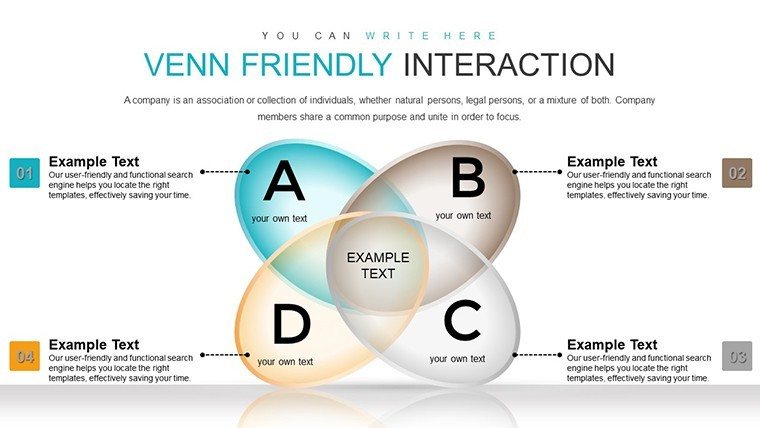
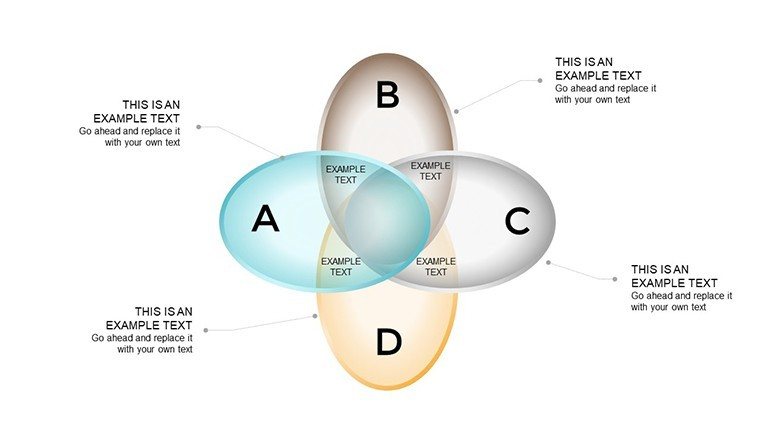
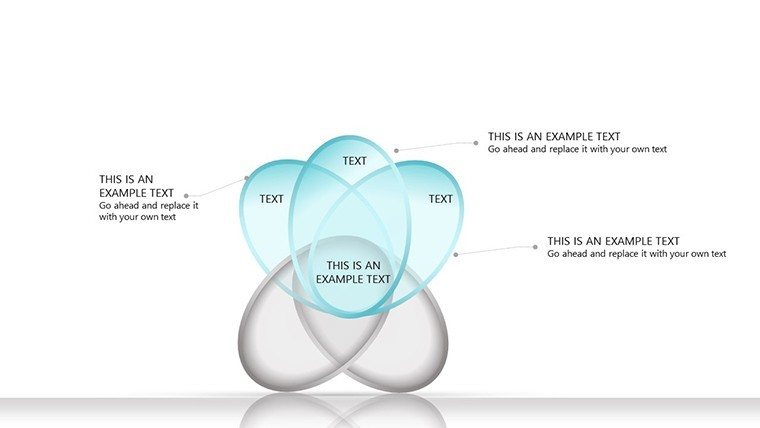
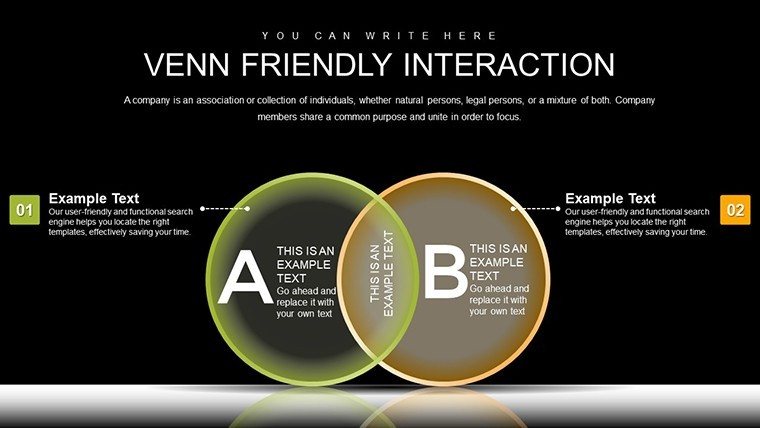
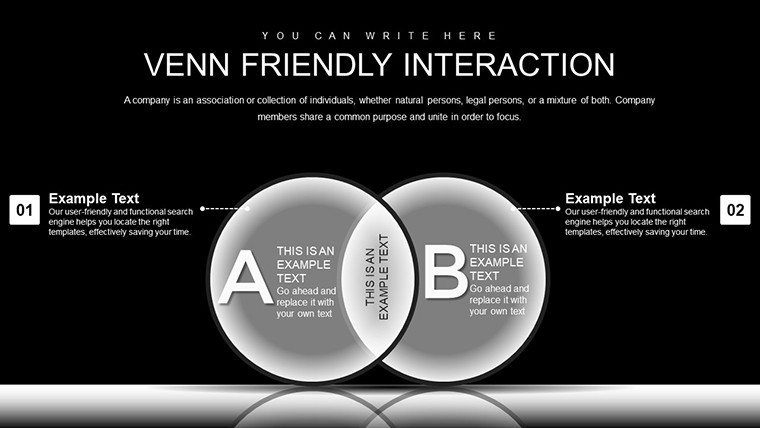
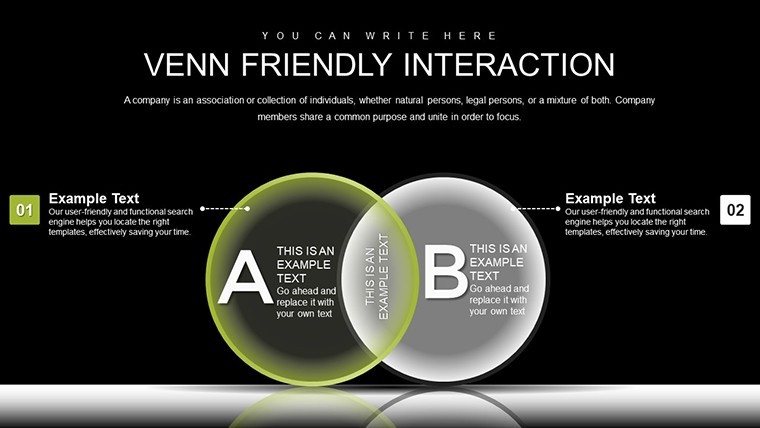
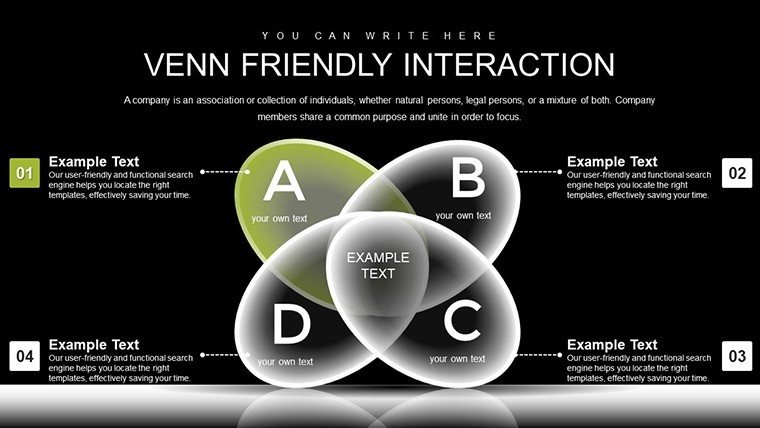
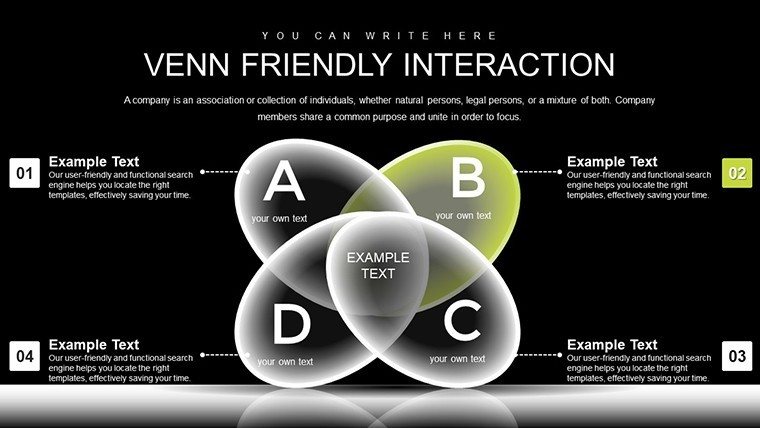
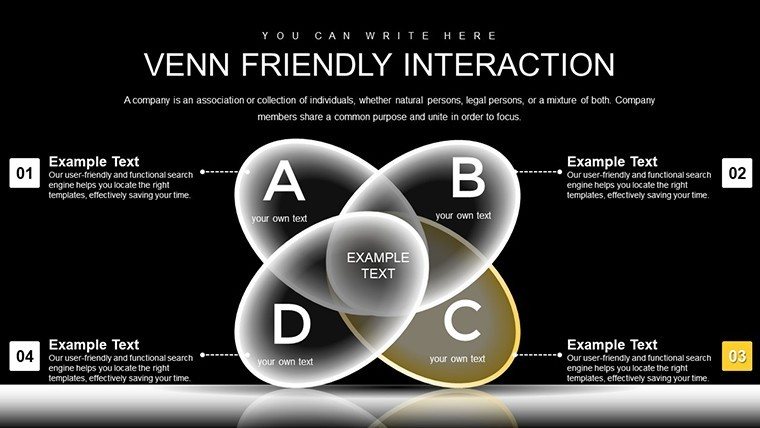
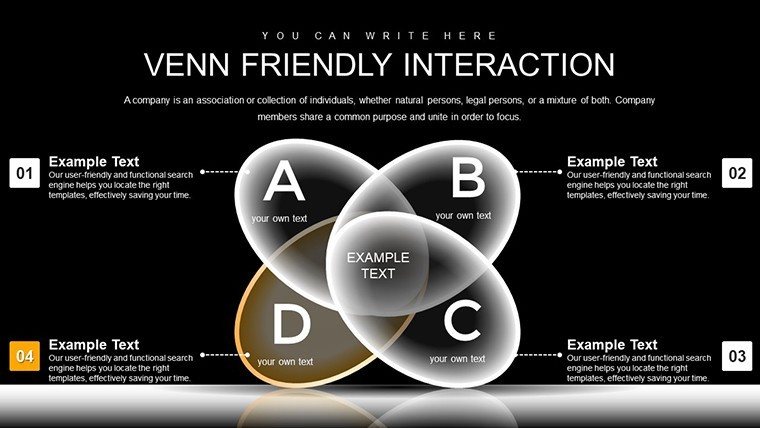
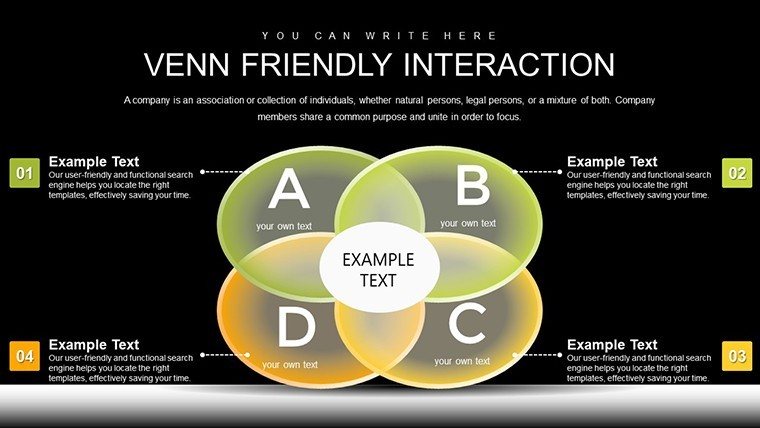
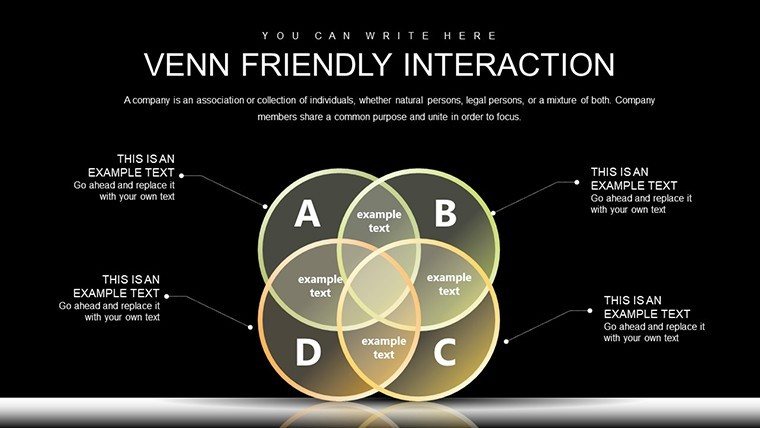
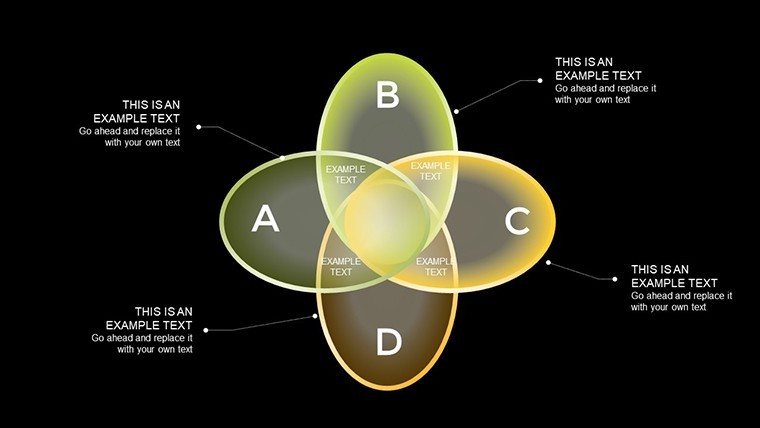
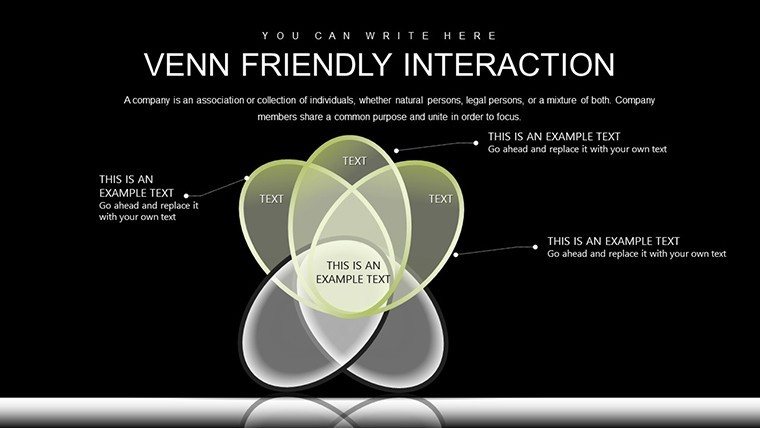
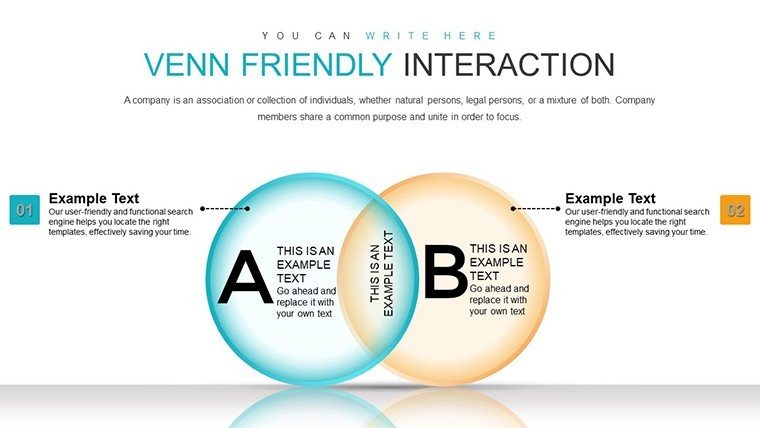
This template shines through its array of features designed to make your Venn charts pop. Each slide incorporates engaging visuals with overlapping circles in various configurations - from simple two-set diagrams to complex multi-set intersections. Customization is straightforward: adjust circle sizes, colors, and transparency to represent data proportions accurately. The user-friendly interface means no steep learning curve; drag-and-drop elements let you add text, icons, or even images within the overlaps. With a focus on versatility, it includes themed variations like gradient fills for modern appeal or outlined versions for print-friendly outputs. Professionals value how it aligns with branding guidelines, allowing seamless integration of logos and fonts. Compared to basic PowerPoint tools, this template offers pre-built animations that reveal intersections progressively, keeping viewers hooked without overwhelming them.
Exploring the Slide Breakdown
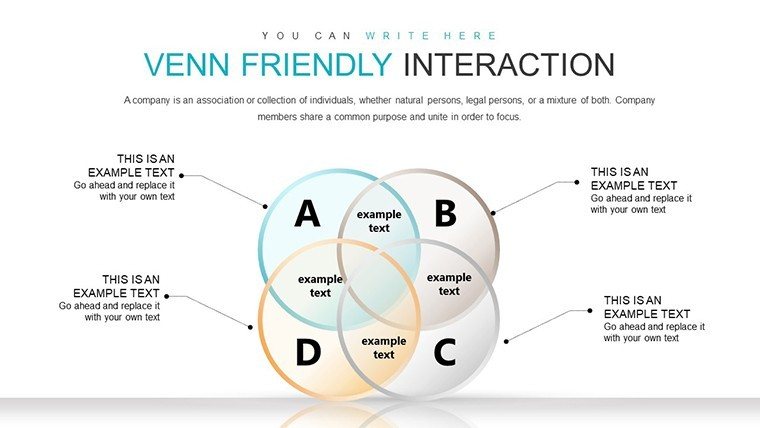
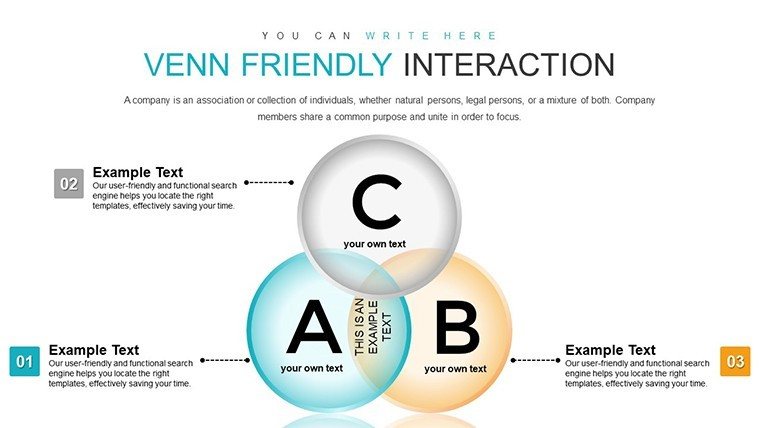
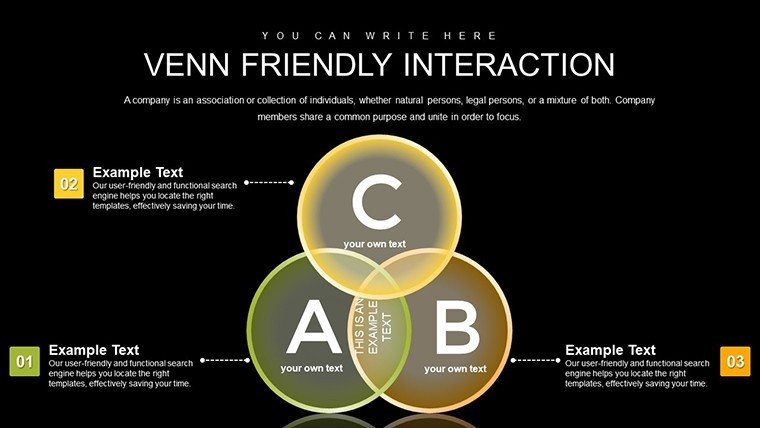
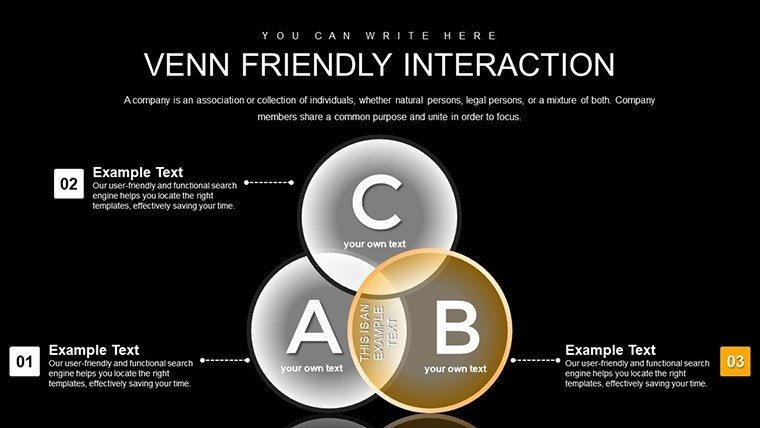
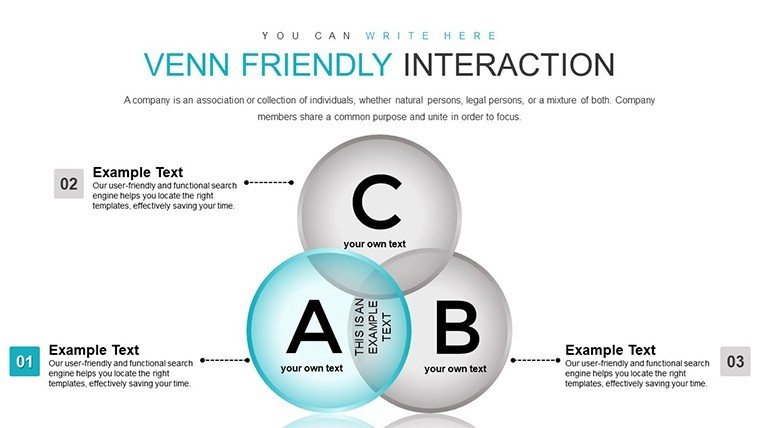
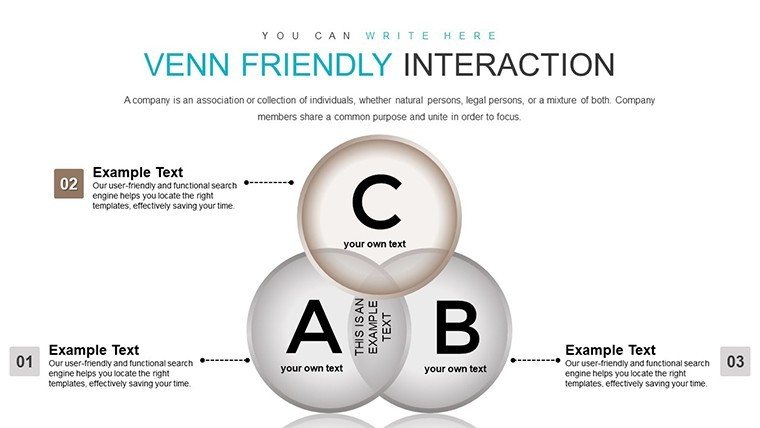
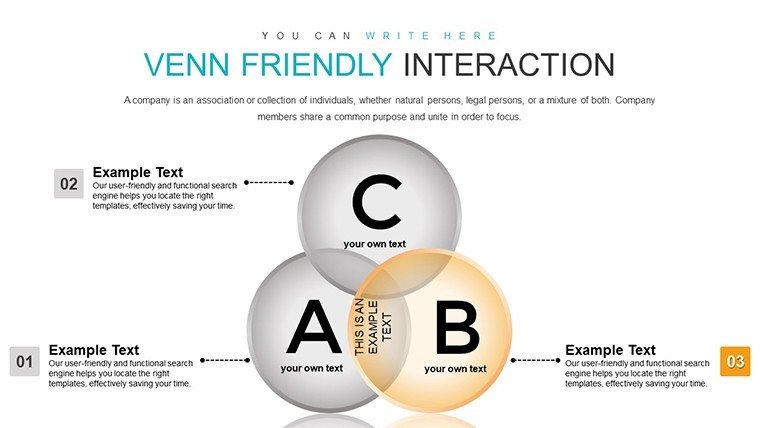
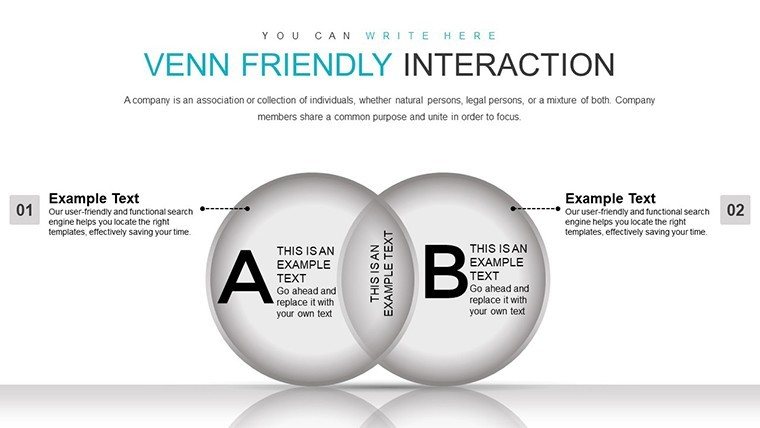
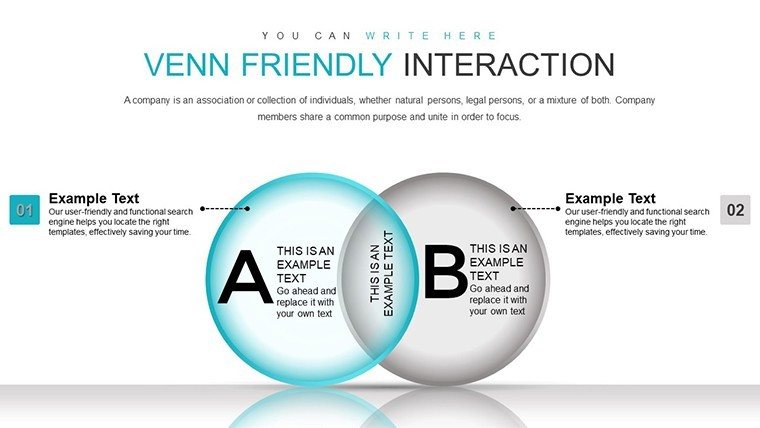
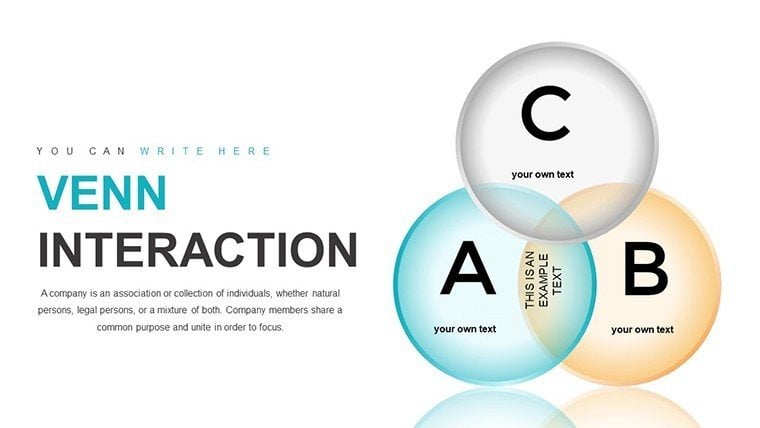
To appreciate the depth, consider the structured slide categories. Early slides ( #1-10) cover basic Venn setups, such as Slide #3's three-circle diagram ideal for comparing product features. Here, editable labels in each segment allow detailed annotations, like "Unique to Brand A" or "Shared Benefits." Mid-section slides (#11-25) introduce advanced interactions, including Slide #15's interactive Venn with clickable zones for drill-down data - great for virtual meetings. The final batch (#26-39) focuses on application-specific designs, like Slide #30's business merger Venn showing synergies in finance, operations, and marketing. All slides maintain a cohesive graphic style with high-resolution elements that scale perfectly on large screens. This organization ensures you can mix and match slides to build custom decks tailored to your narrative.
- Basic Venn Diagrams: Start with foundational overlaps for quick comparisons in reports or lessons.
- Advanced Intersections: Handle complex data with multi-layer circles and embedded charts.
- Themed Variations: Choose from color-coded or icon-enhanced versions to fit your story's tone.
Practical Use Cases and Value Propositions
Beyond features, the real magic lies in how this template solves real problems. In business reports, use it to visualize customer segment overlaps, as seen in marketing analyses from firms like Gartner, where Venns clarify targeted strategies. Educators can bring abstract math concepts to life, fostering better understanding among students through visual aids. For client presentations, consultants might employ it to demonstrate partnership potentials, turning data into compelling arguments that secure buy-in. The benefits are clear: enhanced retention, as visuals aid memory; time savings, with ready-made designs; and professionalism that elevates your brand. Users often note increased interaction during Q&A sessions, as clear diagrams spark thoughtful discussions. By incorporating LSI elements like relationship mapping and overlap analysis, this template not only meets but exceeds expectations in diverse scenarios.
Workflow Integration: From Concept to Delivery
- Select and Download: Choose this template and download the .pptx file for instant access.
- Map Your Data: Input specifics into Venn segments, using placeholders for efficiency.
- Customize Visually: Tweak hues, add animations, and align with your style guide.
- Enhance with Extras: Insert supporting graphs or text for a fuller picture.
- Present Confidently: Rehearse and share, knowing your visuals will captivate.
This streamlined process mirrors efficient workflows in top agencies, ensuring you deliver polished results every time.
Expert Tips for Venn Chart Mastery
Elevate your game with tips inspired by visualization pros. Balance circle sizes to reflect data accuracy - avoid equal sizing if proportions differ. Use color psychology: blues for trust in business contexts, greens for growth in educational slides. Limit text in overlaps to key phrases, preventing clutter and maintaining focus. For interactivity, add hyperlinks to external data sources, turning static charts into dynamic tools. Test audience comprehension by piloting presentations, adjusting based on feedback. Incorporate icons sparingly to reinforce themes, like puzzle pieces for collaborations. These nuances, drawn from successful case studies in TED Talks, can make your Venns not just informative but inspiring, fostering deeper connections with your audience.
Don't settle for ordinary - embrace the power of graphic Venns to connect ideas vividly. Grab this template now and watch your presentations transform into engaging experiences that drive understanding and action.
Frequently Asked Questions
How many sets can the Venn diagrams handle?
Up to five sets in advanced slides, with customizable overlaps for complex relationships.
Does it support animations?
Yes, pre-built animations reveal sections progressively for engaging storytelling.
Is it suitable for non-business uses?
Certainly, it's great for academic or personal projects needing clear visualizations.
What software do I need?
Compatible with PowerPoint and Google Slides - no additional tools required.
Can I add my own images?
Absolutely, insert images into diagrams for personalized, impactful designs.
Are updates included?
Purchases include access to future updates for ongoing improvements.
Good for
- Project roadmaps and sprint plans
- Product launch timelines
- Quarterly or annual review decks
- Company history and milestone summaries
Licence
reviews
I used these charts for a university presentation and they worked okay.
The colors stayed readable on the projector.
A couple layouts felt repetitive after a while.
The templates were still easier than building graphs manually.
Saved me some late night stress.
FAQ
Will it work in Google Slides?
Are fonts embedded?
Can I use this for client work?
What's the refund policy?
Do you update the template after purchase?
Similar templates
See all PowerPoint Charts →
All 39 slides