 Click to zoom
Graphic Venn Keynote Charts Template - 39 Editable Slides
| Format | .pptx |
| Slides | 39 unique layouts |
| Aspect ratio | 16:9 |
| Compatibility | PowerPoint |
| Animated | No |
| Language | English |
| License | Commercial |
| File size | — |
| Version | v1.0 |
| Last updated | October 2021 |
What's inside
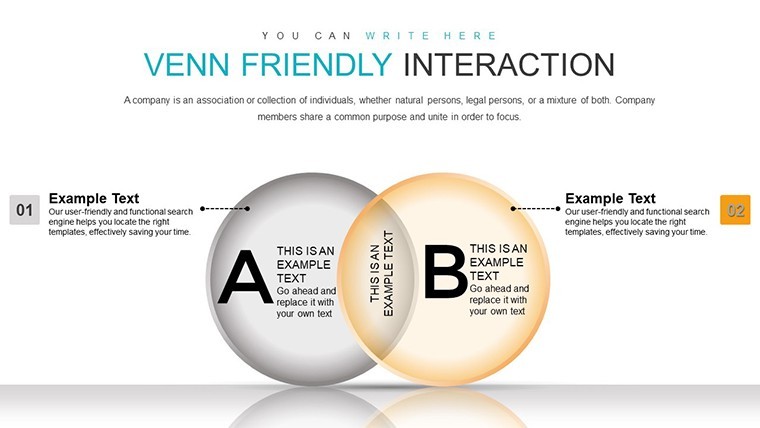
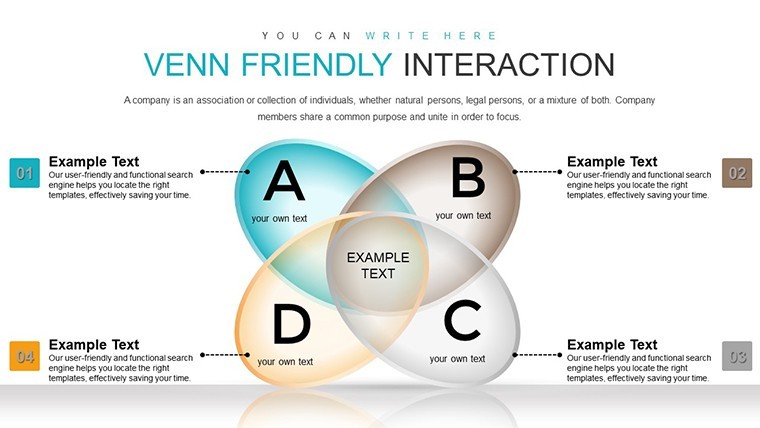
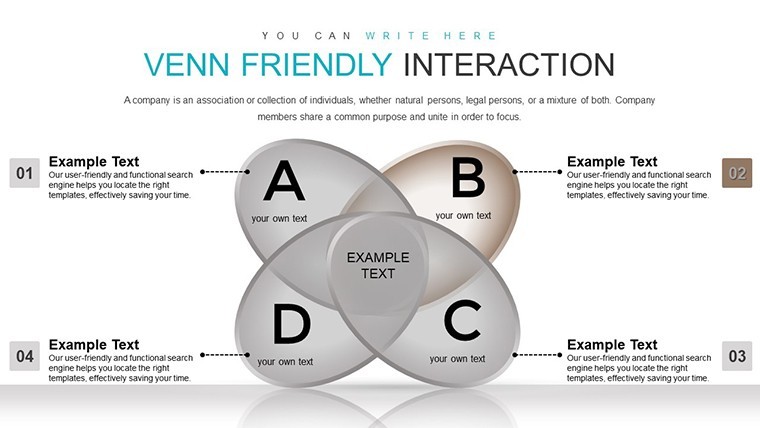
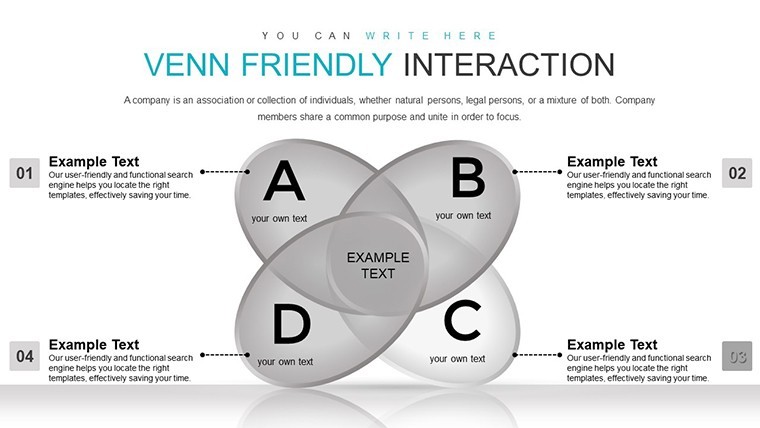
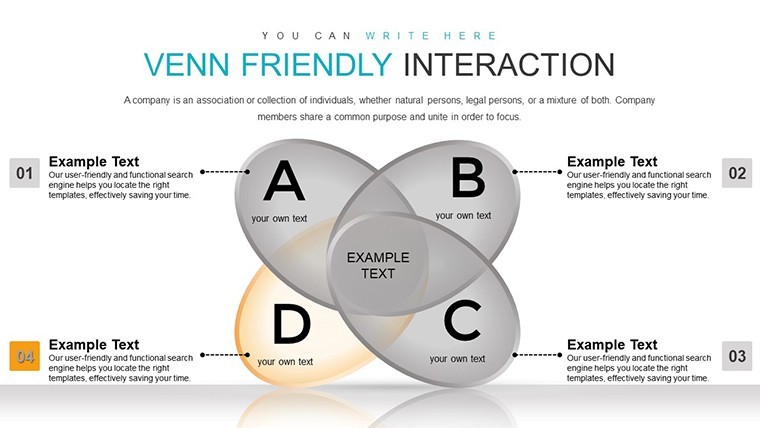
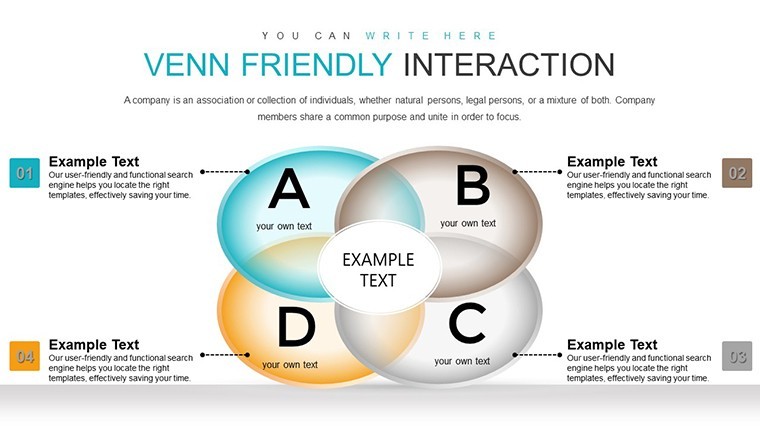
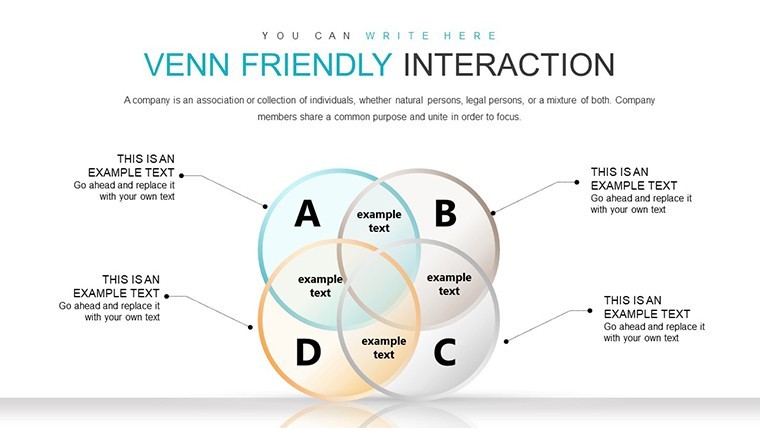
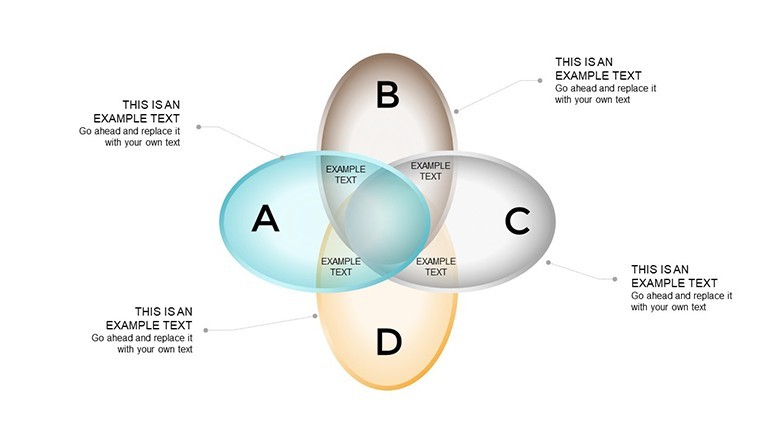
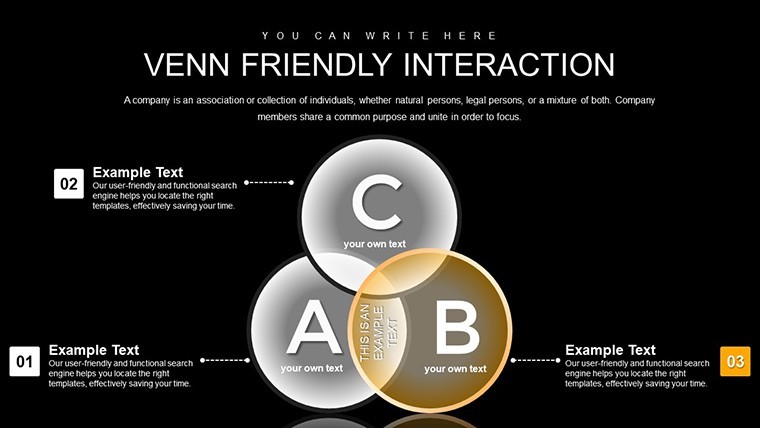
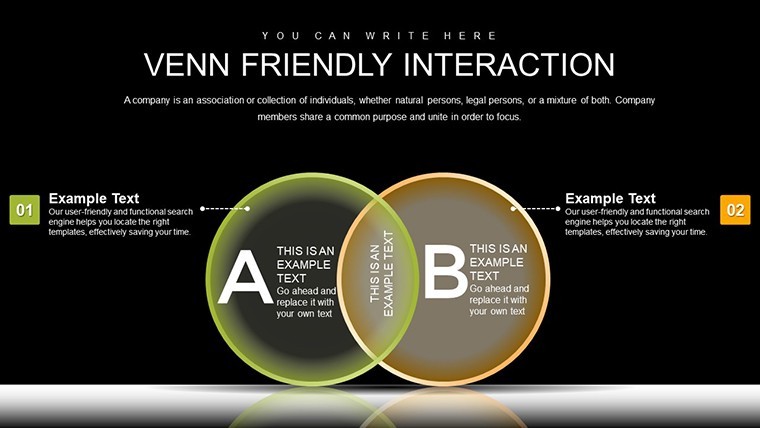
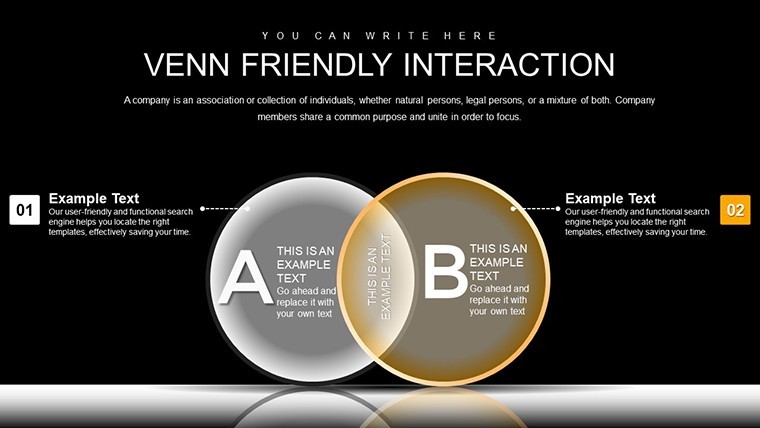
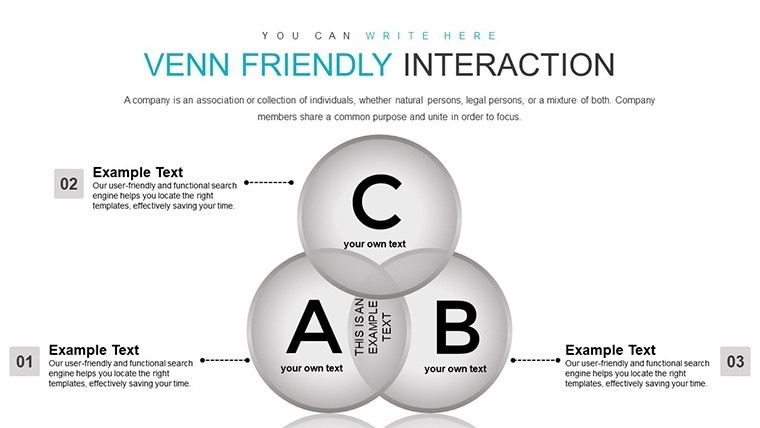
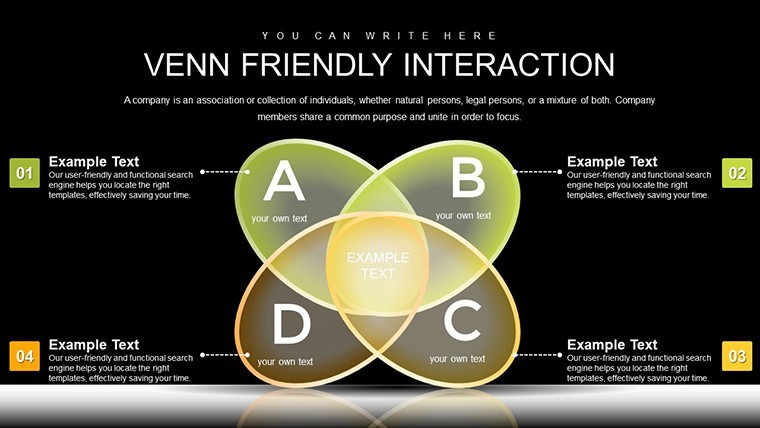
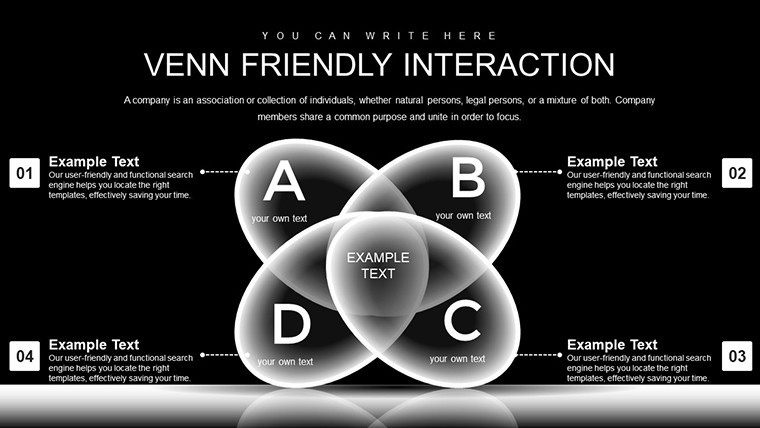
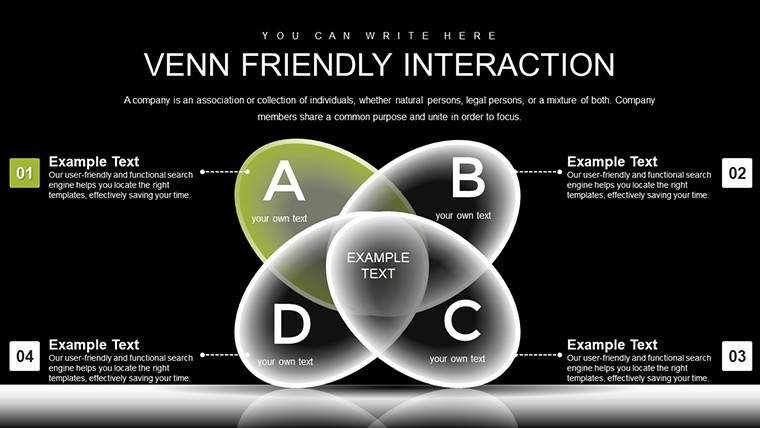
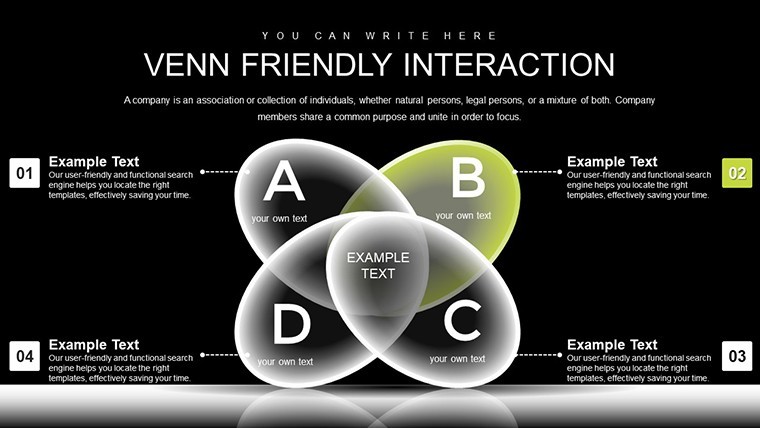
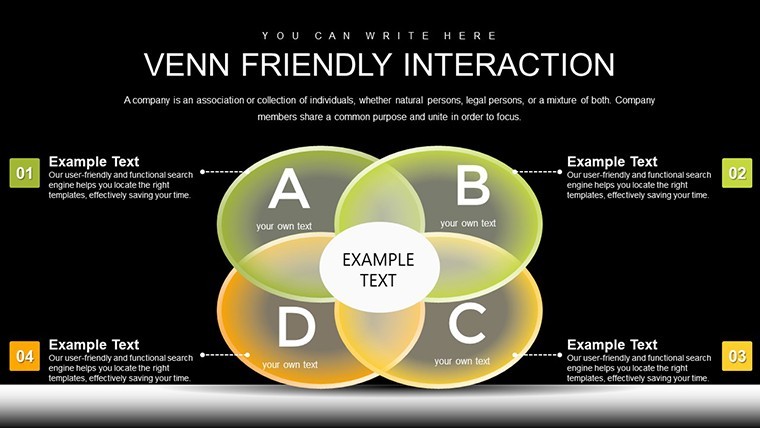
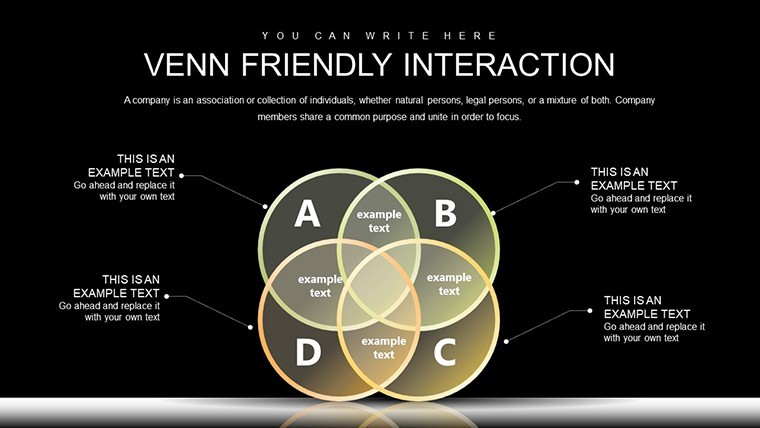
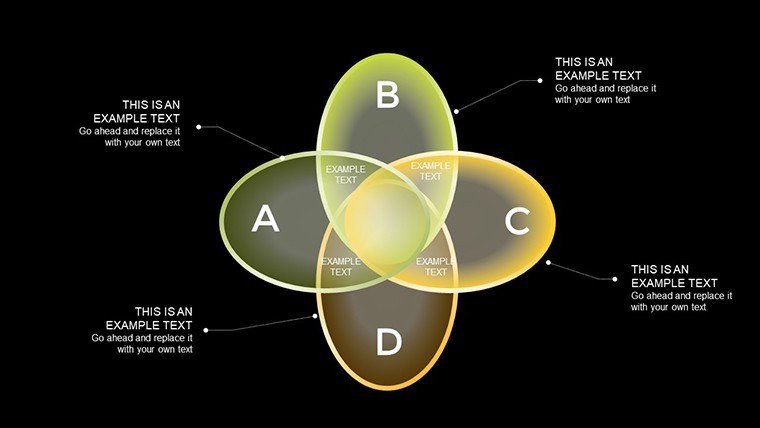
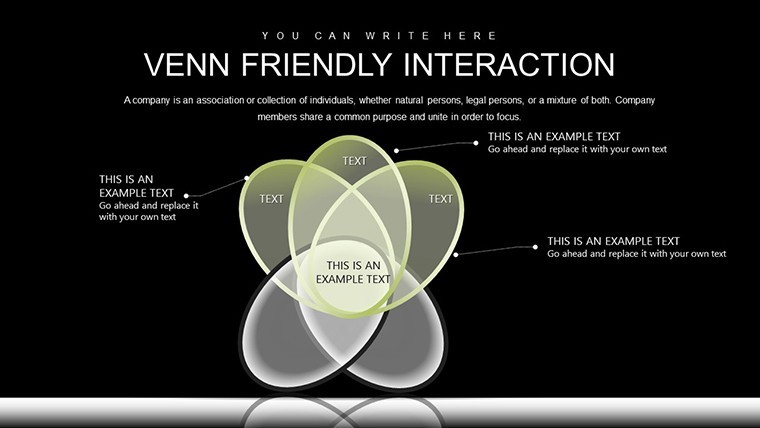
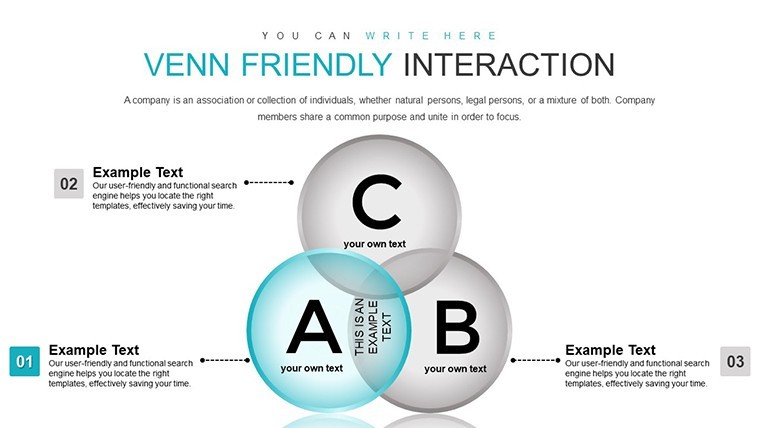
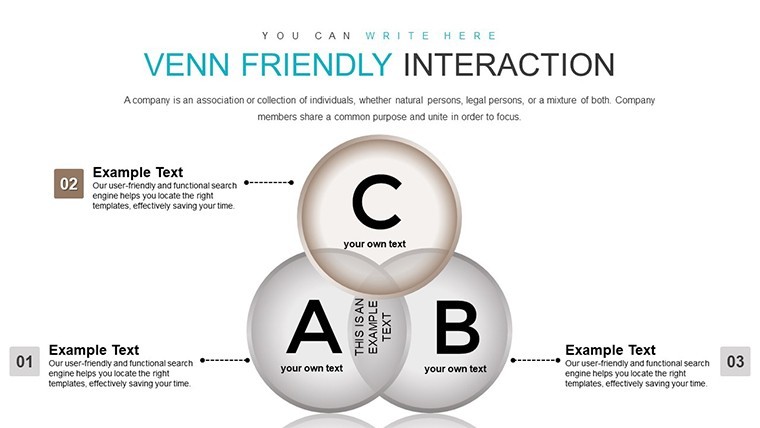
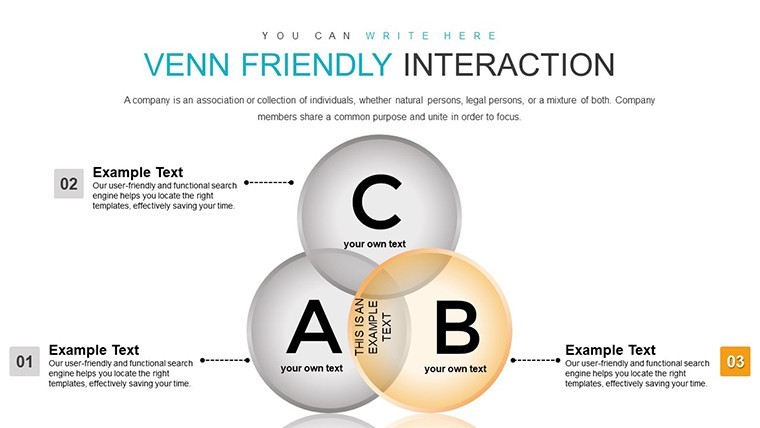
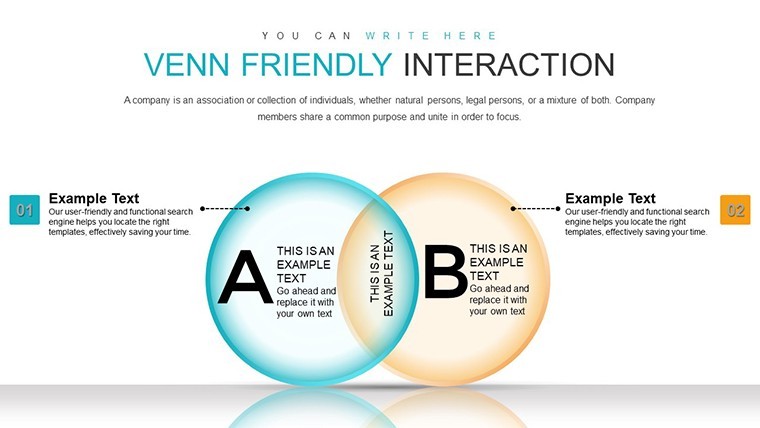
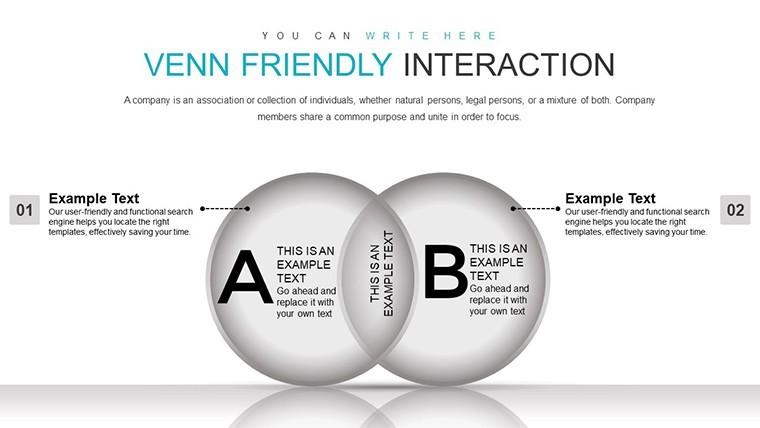
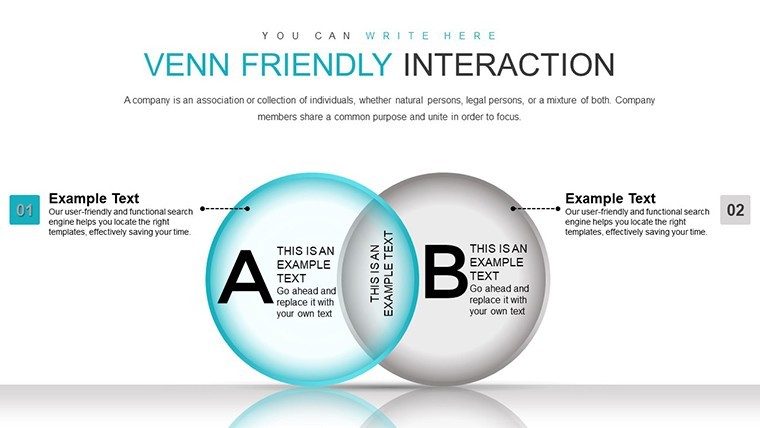
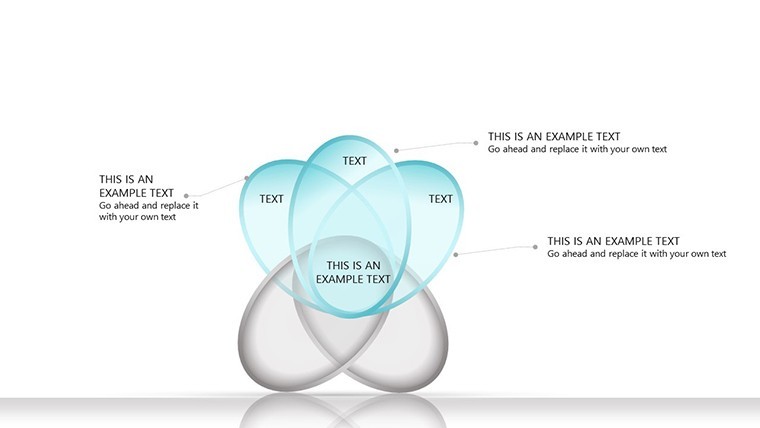
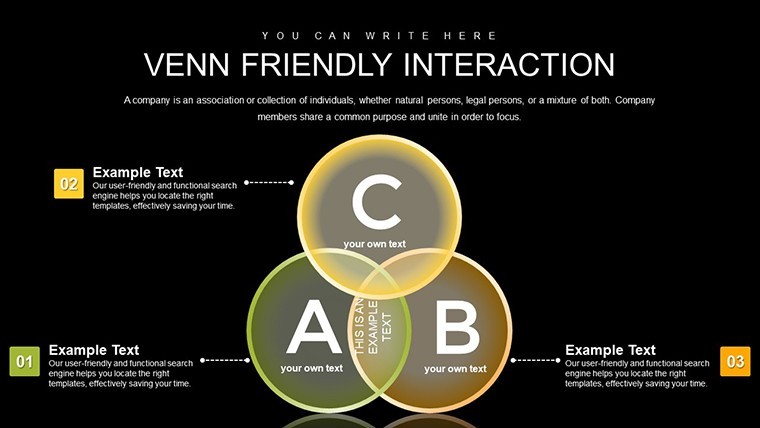
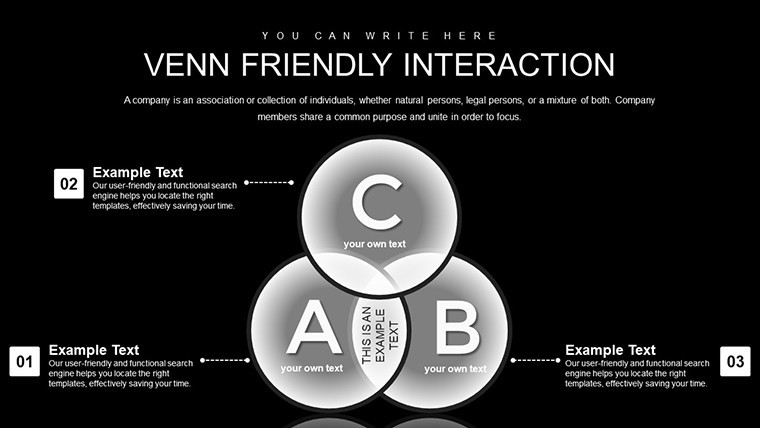
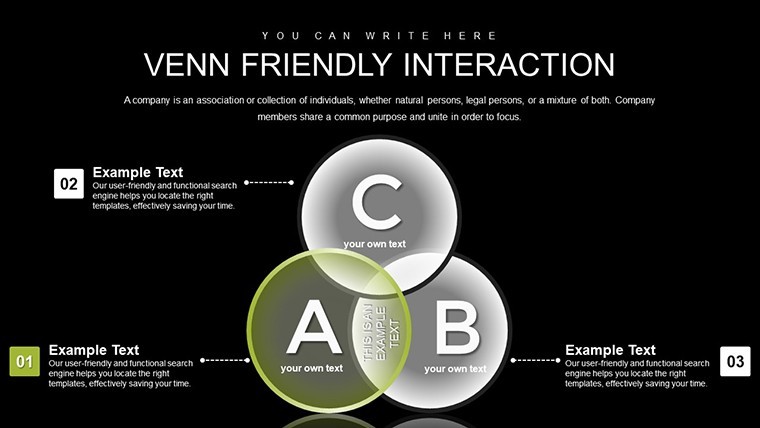
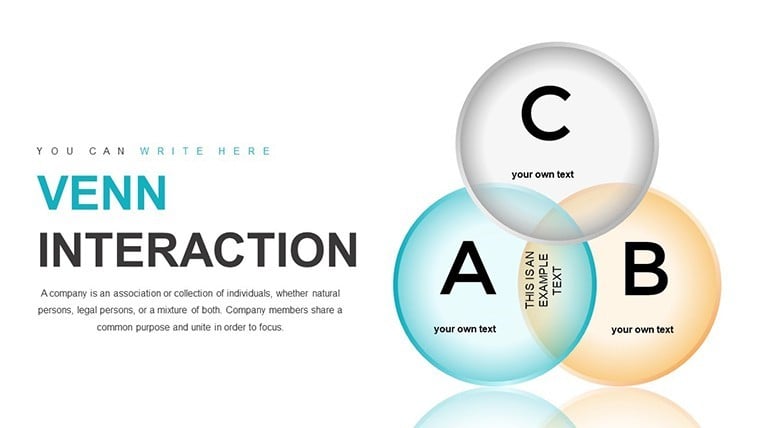
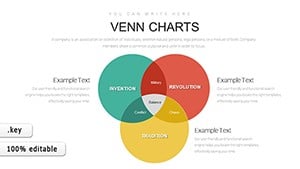
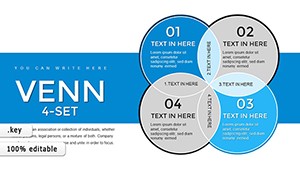
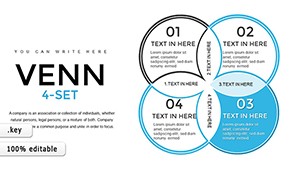
Harness the elegance of geometry to dissect and compare values with our Graphic Venn Keynote Charts Template, comprising 39 slides that blend artistic forms with analytical rigor. Suited for researchers comparing datasets, strategists evaluating options, or instructors demonstrating overlaps, this template uses circles, ellipses, and polygons to highlight similarities and differences. Inspired by graphic design principles and mathematical accuracy, it offers more than standard Venns - think stylized intersections that pop with meaning. Overcome the limitations of plain diagrams that fail to engage; here, vector graphics and customizable elements ensure your visuals command attention. Tailored for Keynote users, it facilitates quick edits on Apple devices, positioning you as an expert communicator in diverse arenas like market research or academic discourse.
Elevating Comparisons with Geometric Precision
Graphic Venn charts transcend basic overlaps by incorporating artistic elements like shaded gradients and patterned fills, making abstract comparisons vivid. In strategy sessions, depict merger synergies; in research, overlay variables for hypothesis testing, echoing methods from statistical texts. This template's authority comes from alignment with visualization standards, avoiding clutter for better . Unlike free alternatives that lack polish, these slides provide professional-grade assets that enhance trustworthiness.
Key Features for Visual Mastery
- Geometric Variety: Beyond circles - use squares or hexagons for unique representations.
- Editable Graphics: Resize, recolor, and rotate elements with precision tools.
- Pattern Overlays: Add textures to sections for thematic emphasis.
- Label Flexibility: Position text dynamically within or outside shapes.
- Export Readiness: High-res for print or digital, maintaining integrity.
Built on feedback from designers, these ensure seamless adaptation to your content needs.
Versatile Uses in Real Scenarios
A market analyst might use Slide 12 to compare consumer behaviors across demographics, with geometric overlaps revealing trends. In academia, illustrate literary themes intersecting in novels. For product development, map feature comparisons against competitors, informed by UX principles from Nielsen Norman Group. Enhance with hyperlinks to sources, creating interactive hubs.
Step-by-Step Creation Process
- Select Shape Base: Pick from pre-sets and duplicate for multi-comparisons.
- Define Sections: Fill with data, adjusting overlaps visually.
- Apply Styles: Choose patterns or colors to code categories.
- Test Interactivity: Add actions for clickable reveals.
- Finalize Output: Review in slideshow mode for flow.
This mirrors creative workflows, yielding polished results efficiently.
Tips to Amplify Your Graphics
Balance symmetry for aesthetic appeal, per Gestalt principles. Use subtle animations to draw eyes to key intersections. Ensure color harmony with tools like Adobe Color, integrating external inspirations.
Targeted Benefits for Users
Analysts gain clarity, educators engagement, designers inspiration - all underpinned by Keynote's robust platform.
Shape your insights geometrically - acquire this template and redefine comparisons. Act now for sharper visuals.
Frequently Asked Questions
Can I alter the geometric shapes?Yes, fully customizable to fit your vision.Supports how many comparison points?Up to six, with focus on 2-4 for best visibility.Compatible with Keynote on Mac only?Works on macOS and iOS seamlessly.Include patterns or just solids?Both, with options to import custom textures.Usage rights?Unlimited post-purchase for any purpose.Animation integration?Pre-configured for smooth transitions.Good for
- Project roadmaps and sprint plans
- Product launch timelines
- Quarterly or annual review decks
- Company history and milestone summaries
Licence
reviews
Prepared my annual department report using several charts from this pack. The process was much quicker than previous years.
Clean structure with logical grouping of elements makes customization feel natural even for non-designers.
Solid option that delivers on expectations for most standard business needs with room for personalization.
Expected more 3D style options but the 2D designs actually communicate better in most meeting rooms.
The presentation received compliments on its visual clarity from senior management.
Used it successfully in an online workshop series. Participants found the diagrams helpful for following along.
Color scheme adapts well to different corporate identities without losing its elegant character.
Some slides felt repetitive in style but the variety available still covered my requirements.
FAQ
Will it work in Google Slides?
Are fonts embedded?
Can I use this for client work?
What's the refund policy?
Do you update the template after purchase?
Similar templates
See all Keynote Charts →
All 39 slides