 Click to zoom
Essential 2D Pie Keynote Charts: Slicing Architectural Data with Precision
| Format | .pptx |
| Slides | 13 unique layouts |
| Aspect ratio | 16:9 |
| Compatibility | PowerPoint |
| Animated | No |
| Language | English |
| License | Commercial |
| File size | — |
| Version | v1.0 |
| Last updated | February 2023 |
What's inside
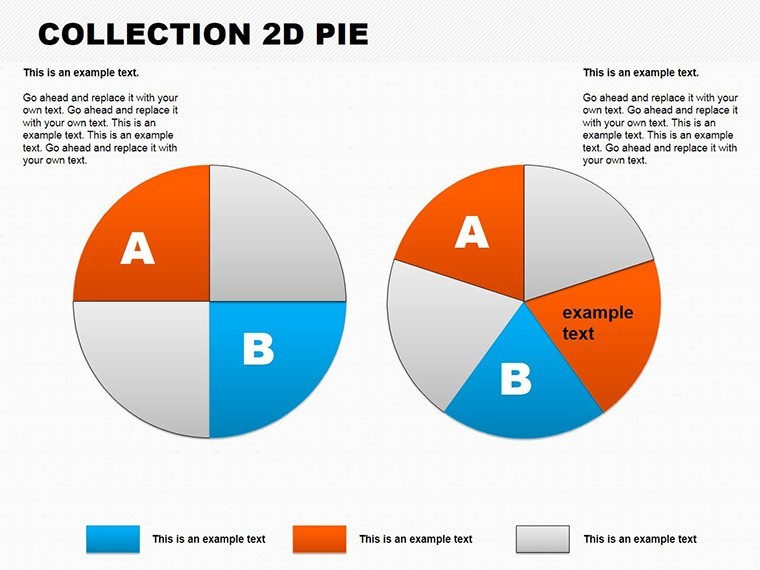
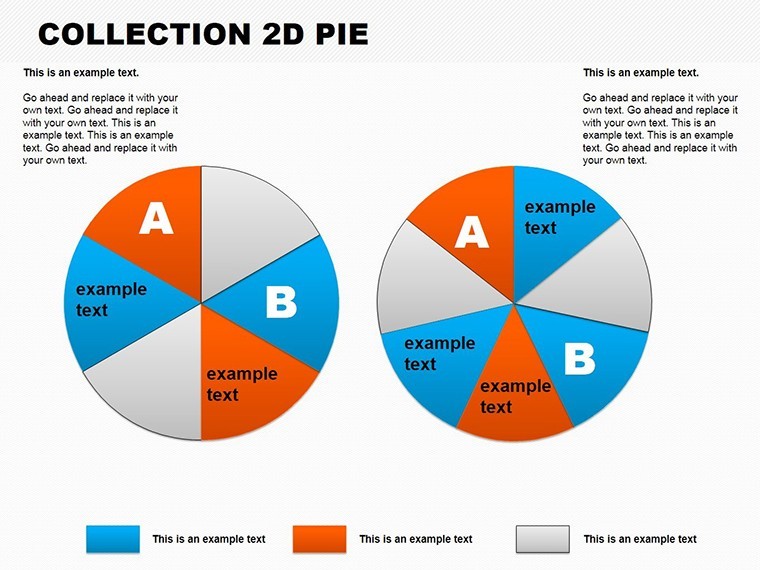
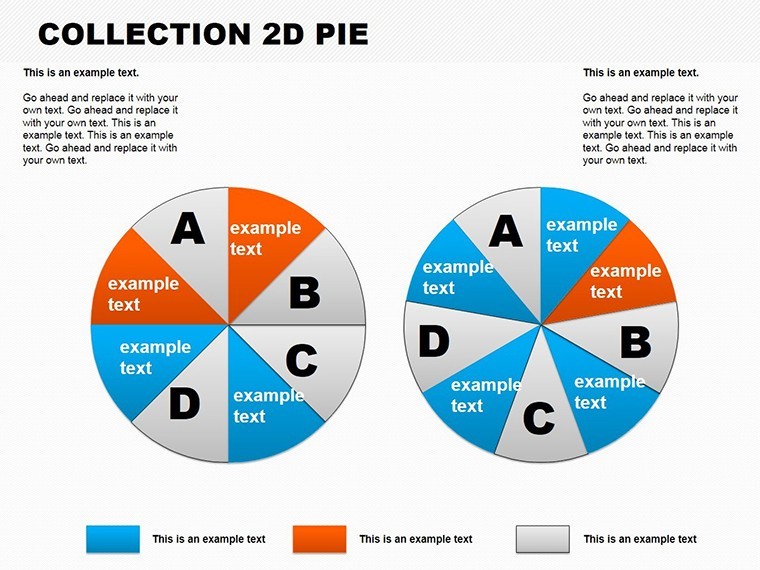
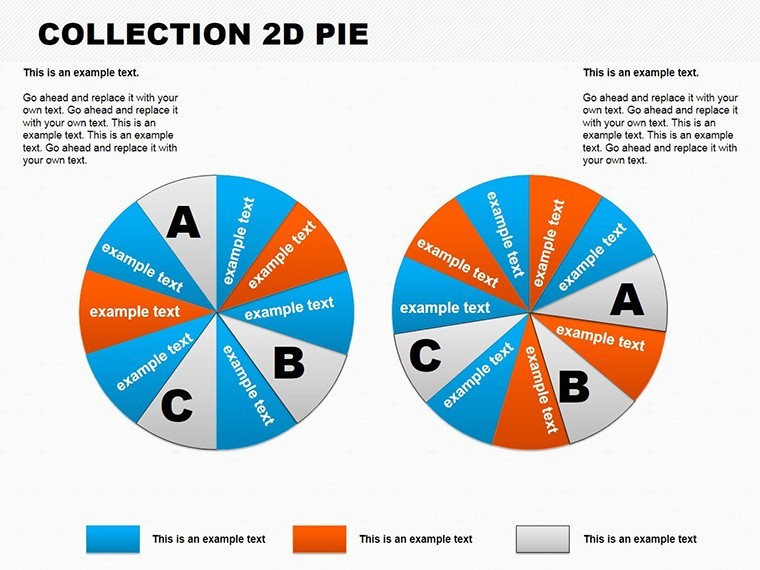
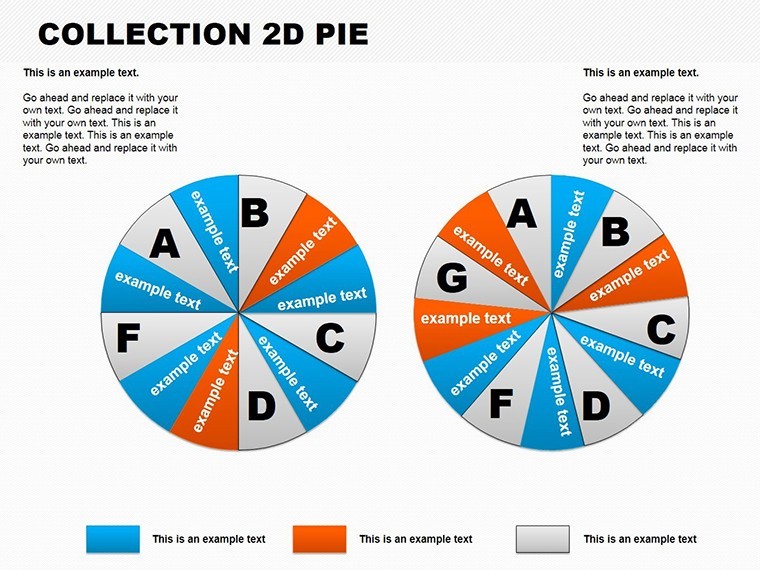
In architecture, success hinges on smart allocations - be it dividing budgets across steel skeletons or demographics in community masterplans. Our Collection 2D Pie Keynote Charts template delivers exactly that in 13 editable slides, a vital tool for discerning architects, interior specialists, and policy influencers who demand data that divides neatly yet dazzles wholly. Visualize a heritage district revitalization: Pie slices segment funding sources, from grants to grants, animated to expand like unfolding elevations, all powered by Keynote's robust ecosystem for Mac mastery.
Echoing data visualization best practices from Edward Tufte's canon, this template distills percentages into persuasive portions, helping you argue for balanced distributions in volatile markets. Studios mirroring SOM's global portfolios have sliced stakeholder analyses this way, often tipping scales in international tenders by quantifying inclusivity. With fluid data imports and thematic tweaks, you're slicing through obscurity to serve up insights that stick.
Portioned Power: Core Features for Pie-Chart Proficiency
The template's strength is its slice-and-dice simplicity, where each of the 13 slides offers 2D pies primed for partitioning. Customize colors to brand your firm's ethos - crisp whites for minimalist mods, textured gradients for artisanal accents - and fonts for legibility that rivals blueprint clarity.
- Slice Sovereignty: Independent editing for each segment, perfect for apportioning square footage in mixed-use allotments.
- Data Dynamics: Direct spreadsheet pulls or manual entries, with auto-updates keeping pies proportional as figures flux.
- Animation Allure: Effects like sequential wedges or explosive pops, turning static stats into story starters.
Versatile across industries yet architecture-attuned, it integrates seamlessly with Keynote's (.key) toolkit - no fuss, full focus on your fiscal or functional fractions.
Pie Breakdown: Exploring the 13 Slides of Segmented Storytelling
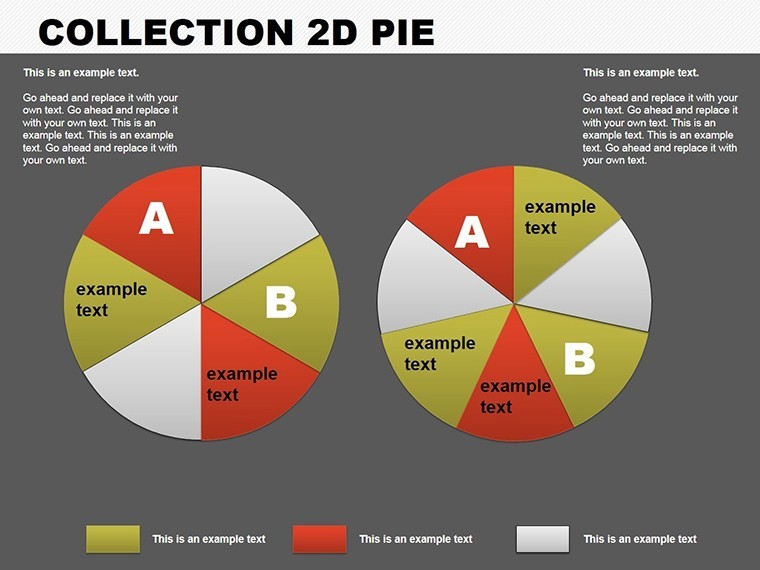
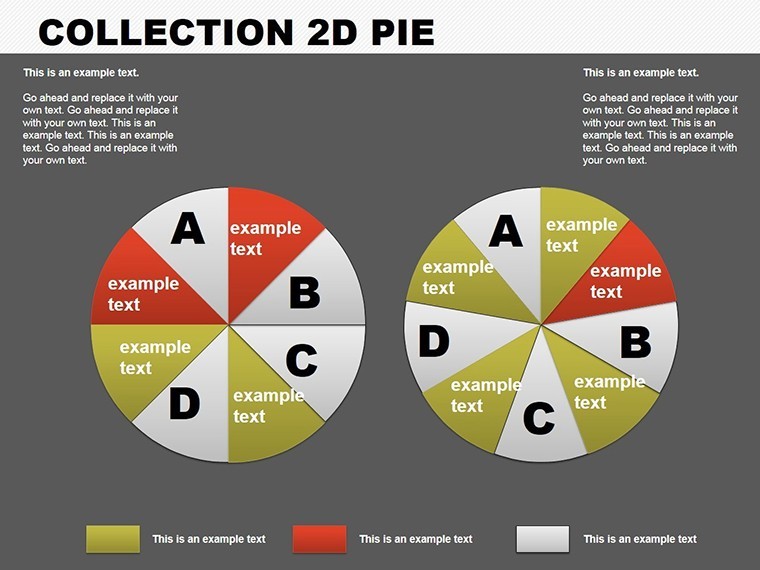
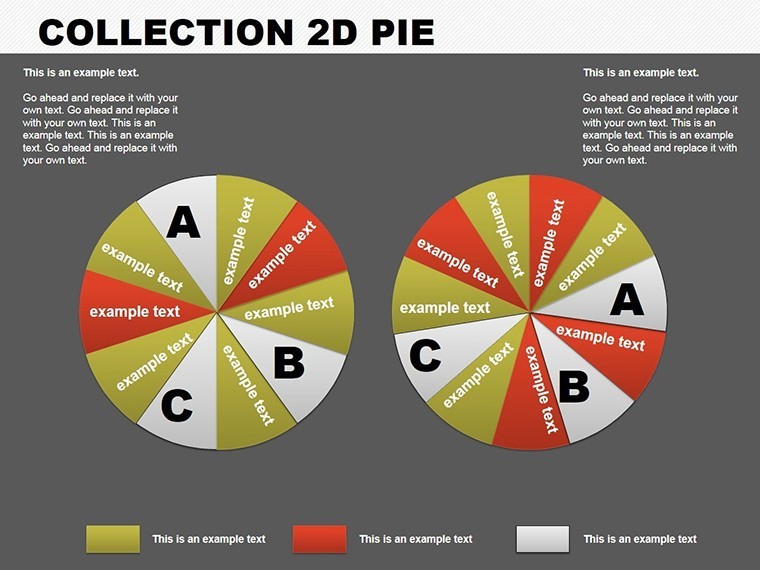
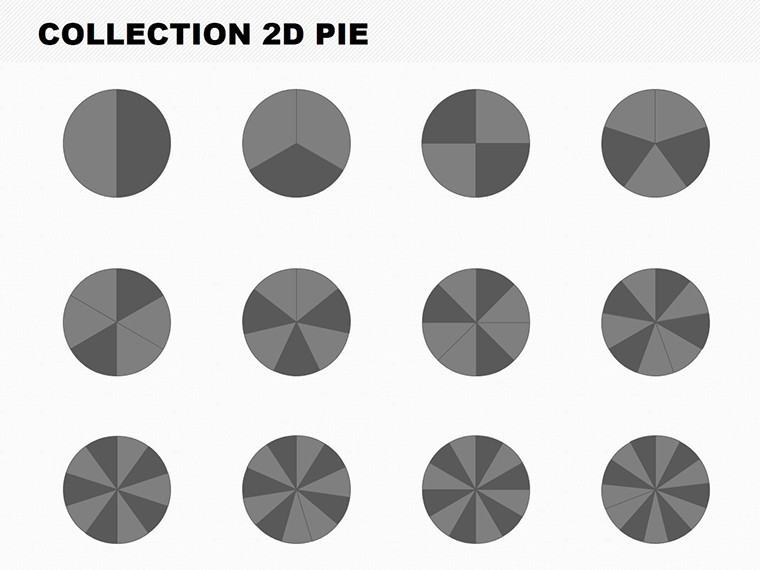
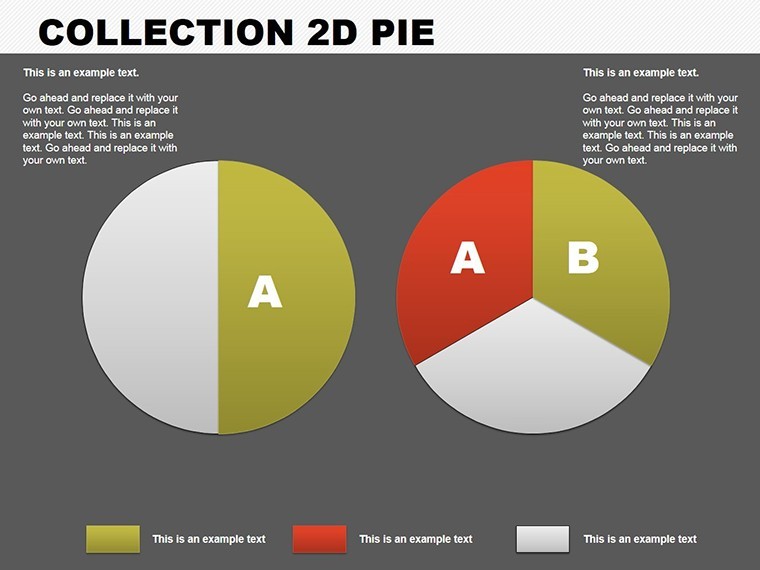
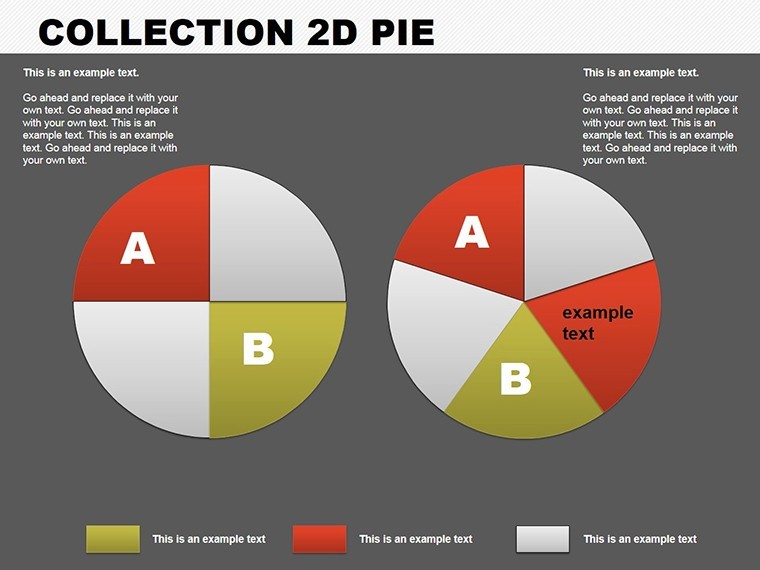
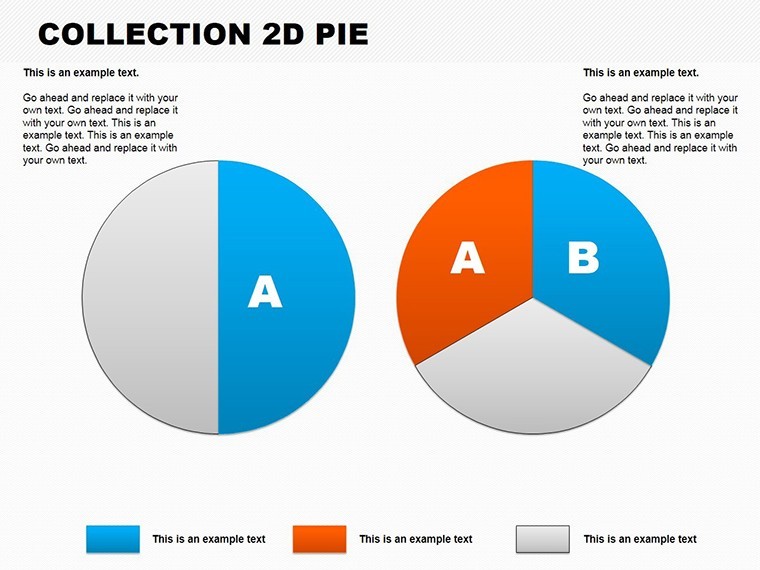
Slide 0 lays a clean baseline pie for elemental breakdowns, like material mixes in eco-facades. Slides 3-6 segment demographics - piecing population cohorts for plaza programming, with labels that orbit elegantly.
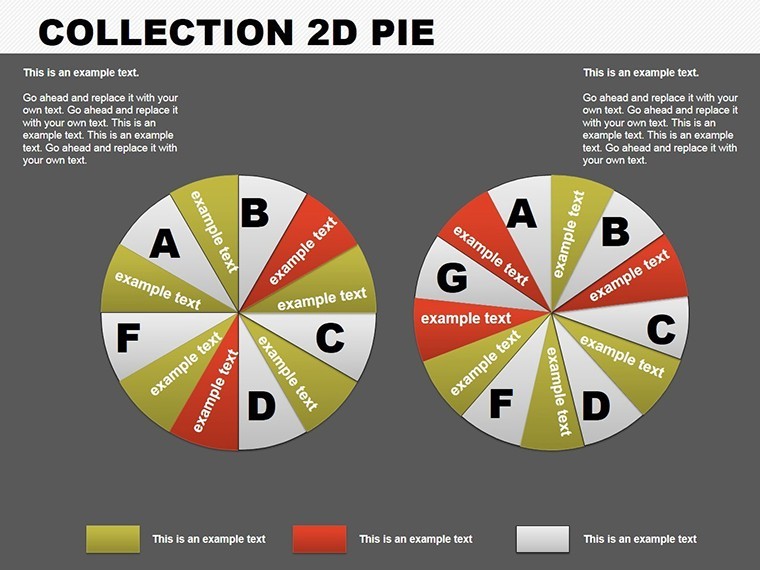
Slide 7 ventures into exploded views for emphasis, bursting risk allocations in seismic assessments. The ensemble peaks at Slide 12: A comparative duo of pies, juxtaposing pre- and post-renovation utilities, animated to morph for metric magic.
Every slice, tweakable in seconds, ensures your data divides dividends.
Slicing Scenarios: From Finance to Facades in Architectural Arenas
This template portions perfectly for pitch parity. In finance-forward forums, slice sales projections for developer decks, apportioning revenues by revenue streams. Healthcare hybrids? Pie patient profiles for clinic layouts, ensuring equitable access visuals.
From the trenches: A Miami firm sliced demographic data for a resilient reef-side resort, portioning cultural inputs that secured community grants. Or in sales symposia, allocate feature benefits, making your smart-building suite slice through skepticism.
- Budget Balancers: Portion capex across categories, highlighting value in value engineering.
- Demo Dividers: Slice user personas for UX in public spaces, prioritizing pedestrian preferences.
- Trend Trackers: Animate temporal pies for market shifts, forecasting facade futures.
Superior to scattershot spreadsheets, these 2D pies portion punch, packaging parts into persuasive wholes.
Slicing Savvy: Best Practices for Pie-Chart Panache
Rule: Limit slices to seven for scannability - merge minors into 'other' with footnotes. Choose contrasting colors for adjacency avoidance, per color theory tomes. Contextualize with legends that link to legends of design lore.
Channeling the proportional poetry of Palladio, portion your presentations with poise.
Ready to slice sharper? Download the 2D Pie Keynote Charts collection today and portion your path to acclaim. Link up with cycle templates for rounded routines.
Frequently Asked Questions
How intuitive is data entry for these pie charts?
Seamless - import from Excel or type directly; pies recalibrate instantly for accuracy.
Best for which architectural data types?
Proportions like budgets, demographics, or material ratios shine brightest.
Can animations be toned down for formal settings?
Yes - dial from dramatic to discreet via Keynote's inspector for tailored tempo.
Supports multi-pie comparisons?
Affirmative; duplicate and align for side-by-side slicing insights.
Font and color matching to brand guidelines?
Precisely - global swaps ensure every slice aligns with your aesthetic.
Good for
- Project roadmaps and sprint plans
- Product launch timelines
- Quarterly or annual review decks
- Company history and milestone summaries
Licence
reviews
I needed graphs fast for class and this did the job.
The layout looked clean after changing a few colors.
Some slides felt repetitive but there were enough usable ones.
The charts printed clearly which surprised me.
Simple and practical template overall.
FAQ
Will it work in Google Slides?
Are fonts embedded?
Can I use this for client work?
What's the refund policy?
Do you update the template after purchase?
Similar templates
See all Keynote Charts →
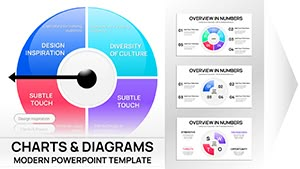
All 13 slides