 Click to zoom
Cycle Periods PowerPoint Diagrams Template
| Format | .pptx |
| Slides | 12 unique layouts |
| Aspect ratio | 16:9 |
| Compatibility | PowerPoint |
| Animated | No |
| Language | English |
| License | Commercial |
| File size | — |
| Version | v1.0 |
| Last updated | May 2024 |
What's inside
Every great strategy has its rhythms - the ebb and flow of market demands, the pulse of seasonal trends, or the steady churn of operational loops. Capturing that cadence visually can mean the difference between a forgotten forecast and a forward-thinking plan. The Cycle Periods PowerPoint Diagrams template delivers just that: 12 meticulously designed editable slides that loop complex repetitions into intuitive flows, ideal for analysts, planners, and educators who need to convey continuity without confusion.
Struggling with slides that treat cycles as flat lists? This template reimagines them as dynamic ovals and spirals, where arrows curve back on themselves to underscore recurrence. Whether charting economic upswings or product lifecycle renewals, it equips you to layer in details like peak periods or pivot points, turning data dumps into directional guides. For teams racing against fiscal quarters, it's the visual anchor that aligns everyone on the repeat.
Delving into the Template's Cyclical Designs
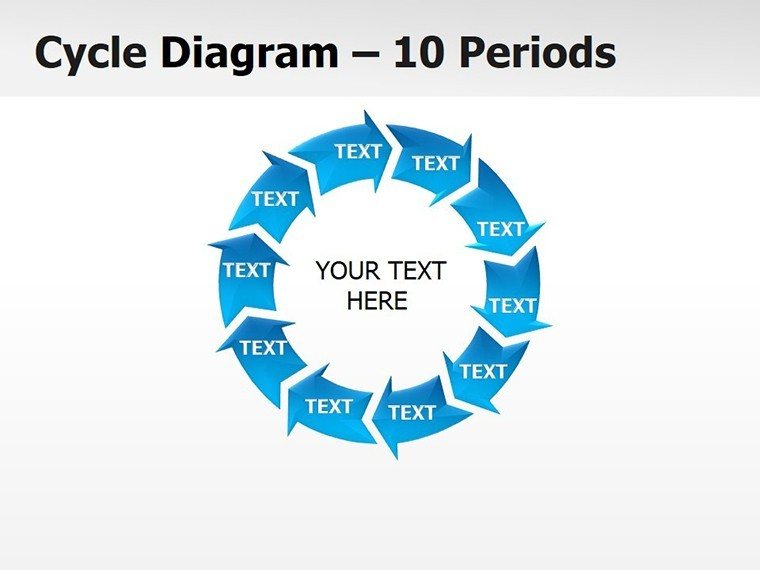
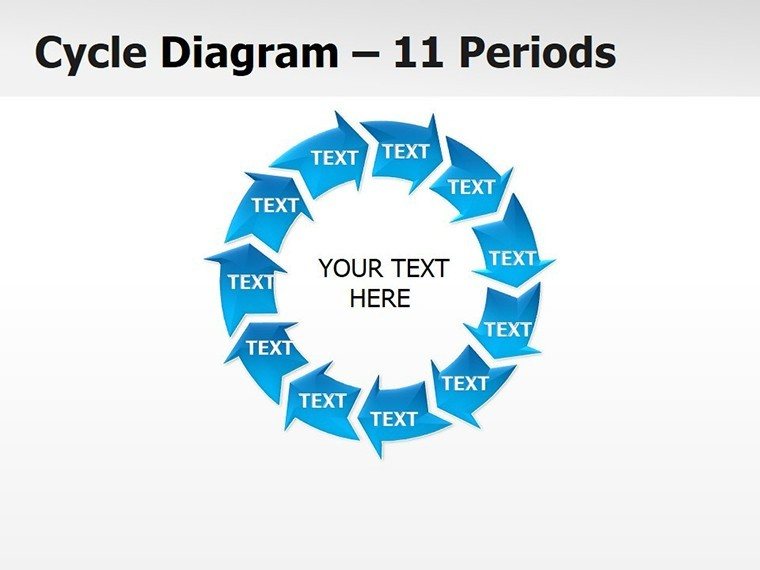
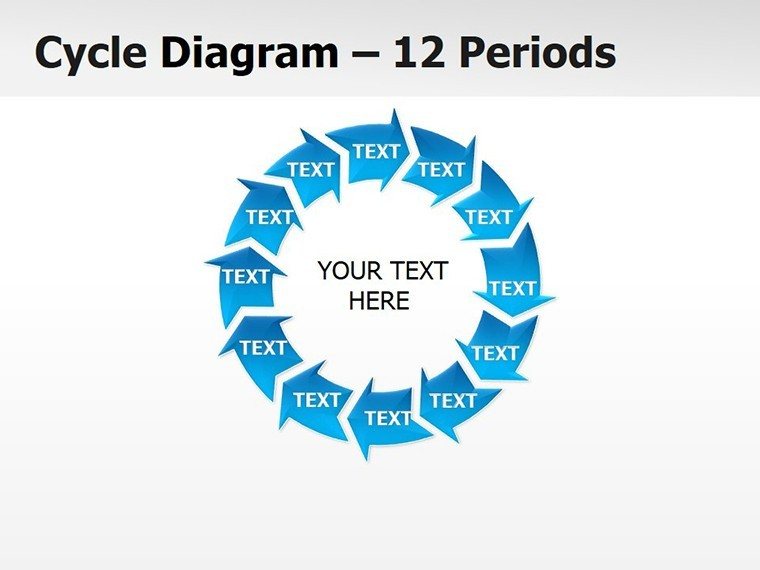
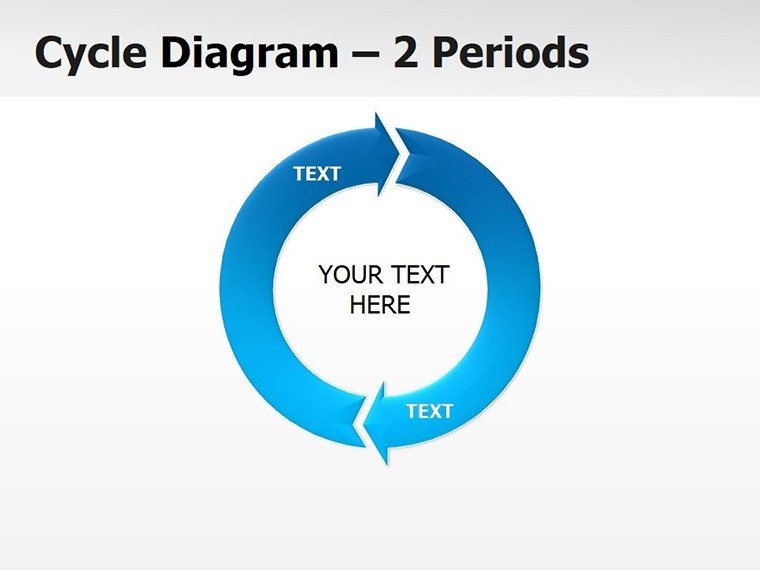
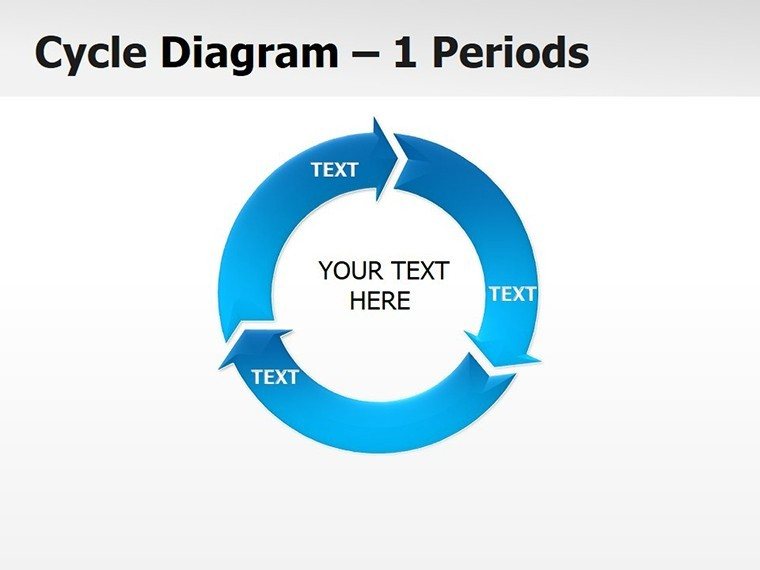
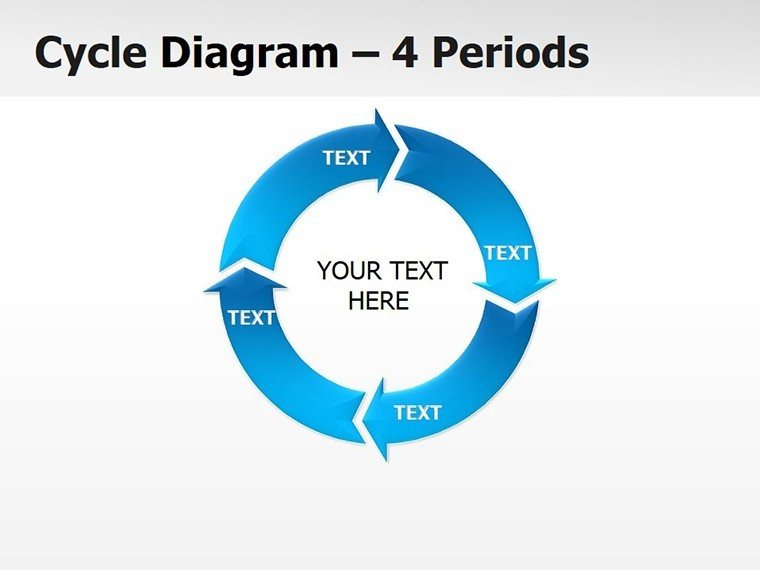
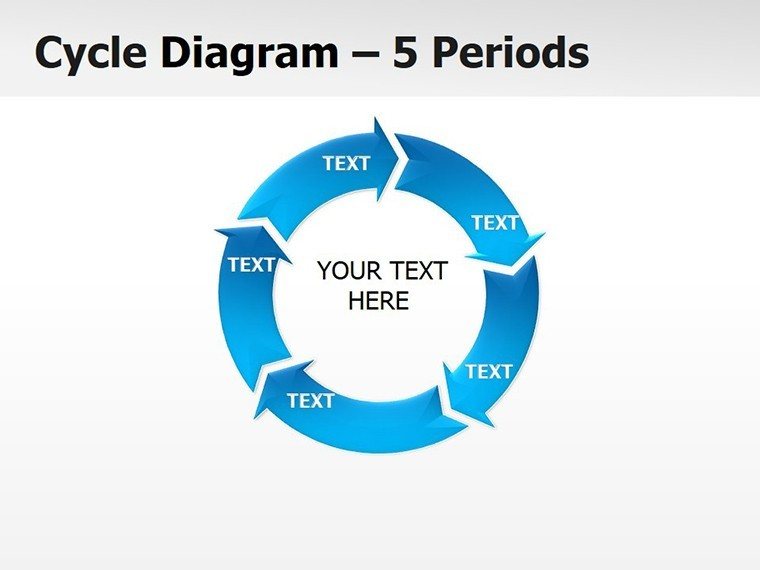
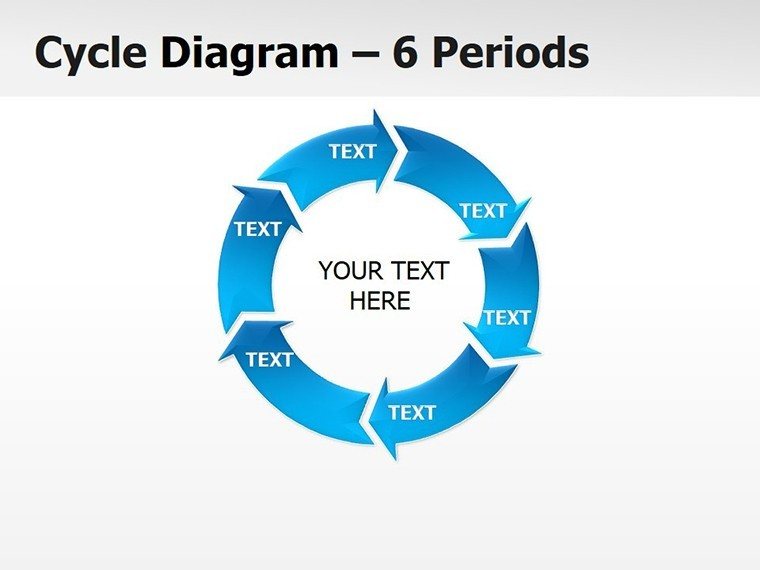
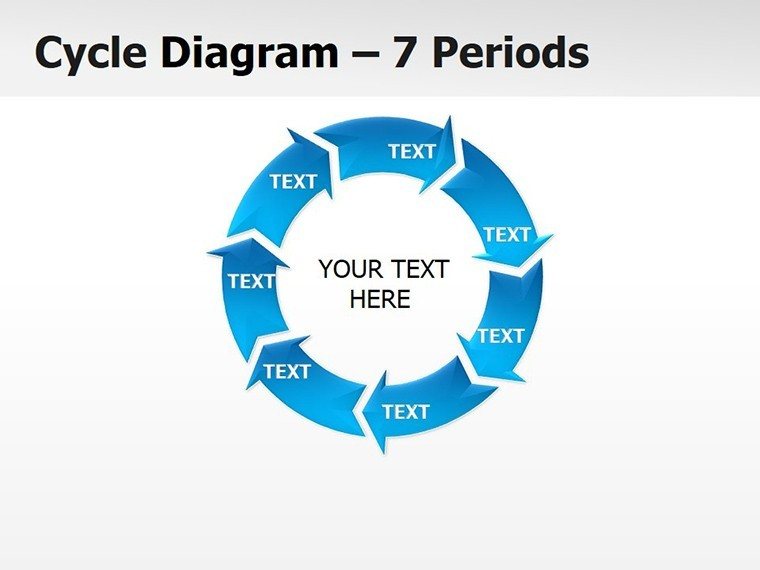
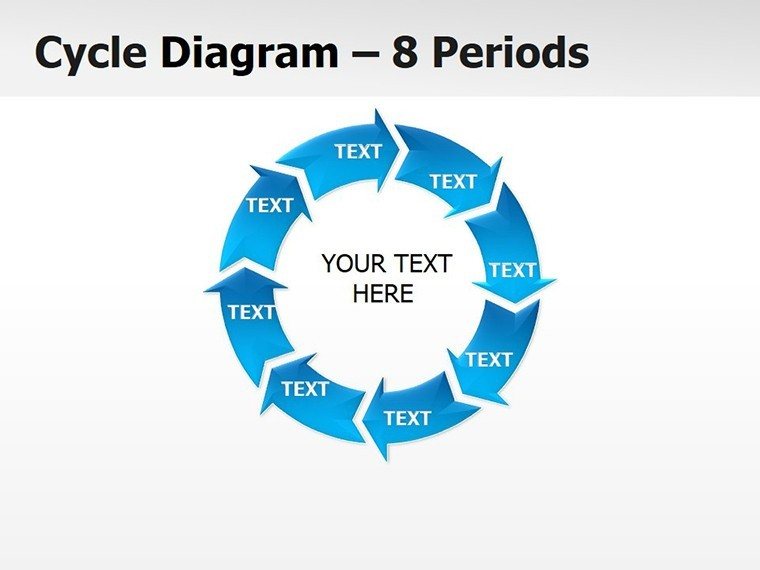
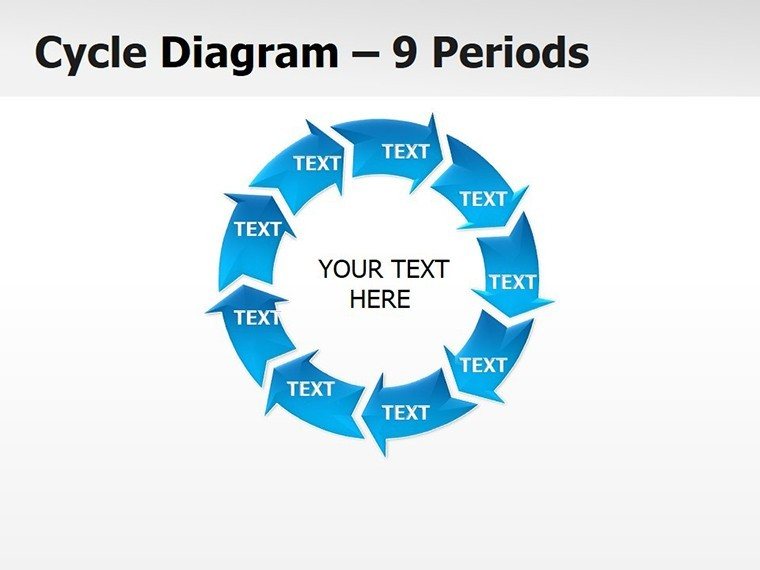
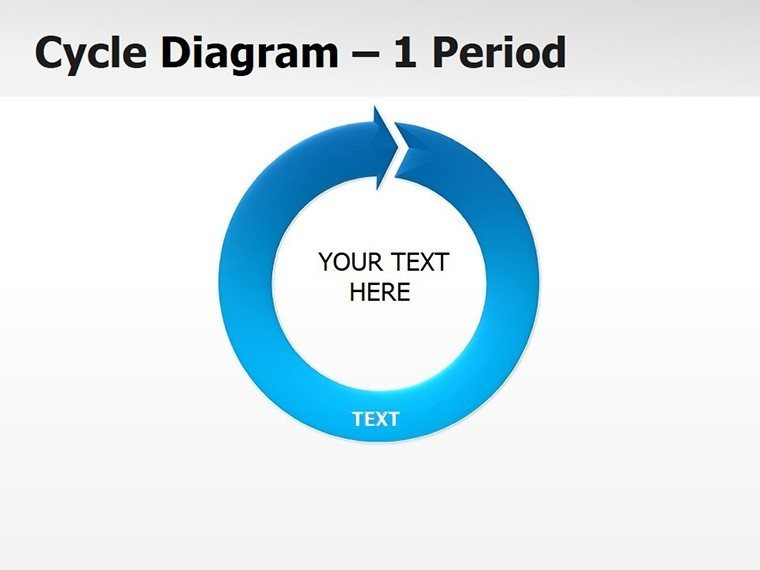
The opening slide sets the stage with a classic circular flowchart, segmented for phases like inception, growth, maturity, and decline - each wedge primed for your inputs, from sales spikes to resource reallocations. Resize arcs to weight importance, or embed mini-charts within for sub-cycles, creating nested narratives that unfold layer by layer.
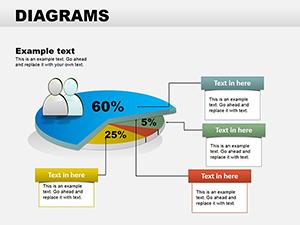
Progress to timeline hybrids: Straight arrows bend into loops at renewal junctures, marking durations with tick markers. Ideal for project recaps, these allow stacking multiple cycles side-by-side, comparing, say, annual budgets against biennial audits. Pie integrations add proportional slices for allocation breakdowns, with exploded views to zoom on outliers.
Icons evoke motion - clocks for time-bound loops, waves for fluctuating patterns - all scalable and recolorable. PowerPoint 2016+ compatibility ensures hassle-free use, with .potx format preserving themes across sessions.
Practical Integrations for Cyclical Narratives
Envision a financial advisor prepping a client review. Slide four's spiral diagram winds through investment cycles, coiling tighter at high-yield phases to emphasize compounding effects. By sequencing fades, the presentation mimics the build, making abstract returns feel tangible and timely.
For a marketing lead mapping campaign cadences, adapt the oval series: Curve stages from awareness to retention, looping back with retention metrics. A light touch of humor in labeling - "the endless chase" - keeps it relatable, while data placeholders pull from your CRM for live accuracy.
- Prep Your Data: Outline cycle stages and durations in a notepad for easy transfer.
- Theme the Flow: Choose a palette that mirrors your cycle - blues for steady, reds for peaks.
- Animate the Loop: Set entrance effects to trace the path, revealing connections progressively.
In educational settings, teachers use these for historical eras, circling events in repeating patterns like election cycles, engaging students with visuals that echo real-world repetitions.
- Process Loops: Depict workflows that circle back, highlighting feedback mechanisms.
- Trend Spirals: Illustrate escalating or contracting patterns over periods.
- Comparative Ovals: Juxtapose multiple cycles for variance analysis.
Versatility shines in consulting gigs, where these diagrams simplify client audits, curving through compliance renewals with clarity.
Seamless Workflow and Lasting Appeal
High-quality vectors keep edges crisp on any canvas, from notebooks to billboards, while the intuitive layout means minimal learning curve - tweak and present in under an hour. For global teams, multilingual text boxes accommodate translations without reformatting.
Geared toward strategists and instructors, it transforms periodic puzzles into persuasive patterns, much like a well-tuned metronome guiding an orchestra. Step up your cyclical storytelling - download for $24 and let the loops lead.
Frequently Asked Questions
What types of cycles does this template cover?
From business and economic to natural and project-based, with adaptable shapes for any repeating process.
Can I overlay data labels on the diagrams?
Yes, each segment includes editable text boxes for figures, percentages, or annotations.
How do I handle multi-year cycles?
Extend arrows or add concentric rings to represent extended timelines without crowding.
Are animations pre-set or customizable?
Fully customizable; start with none and add paths or spins via the Animations tab.
Does it work with older PowerPoint versions?
Optimized for 2016+, but backward-compatible features ensure basics function in earlier editions.
Good for
- Project roadmaps and sprint plans
- Product launch timelines
- Quarterly or annual review decks
- Company history and milestone summaries
Licence
reviews
My project needed a hierarchy chart and this template had several org chart styles.
The icons are modern but there aren't enough of them for my specific industry.
Used the connector lines for a network diagram and they snapped into place perfectly.
It's okay I guess but I wish the slide backgrounds were plain white instead of textured.
Good enough for a team meeting my boss didn't complain so that's a win.
FAQ
Will it work in Google Slides?
Are fonts embedded?
Can I use this for client work?
What's the refund policy?
Do you update the template after purchase?
Similar templates
See all Powerpoint Diagrams →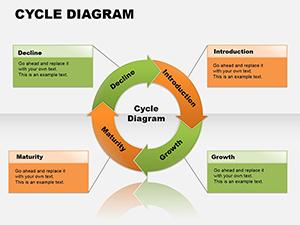
All 12 slides