 Click to zoom
Apple PowerPoint Diagrams: Spotlight Data Peaks and Valleys with Ease
| Format | .pptx |
| Slides | 14 unique layouts |
| Aspect ratio | 16:9 |
| Compatibility | PowerPoint |
| Animated | No |
| Language | English |
| License | Commercial |
| File size | — |
| Version | v1.0 |
| Last updated | February 2026 |
What's inside
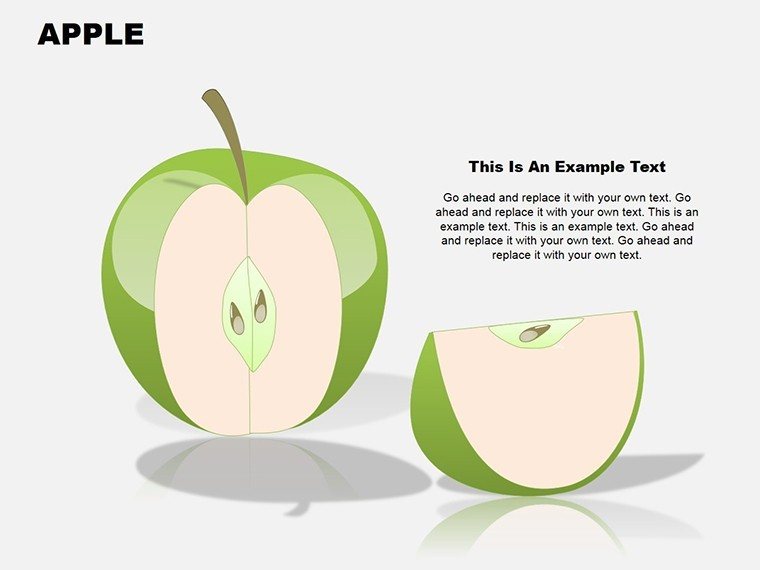
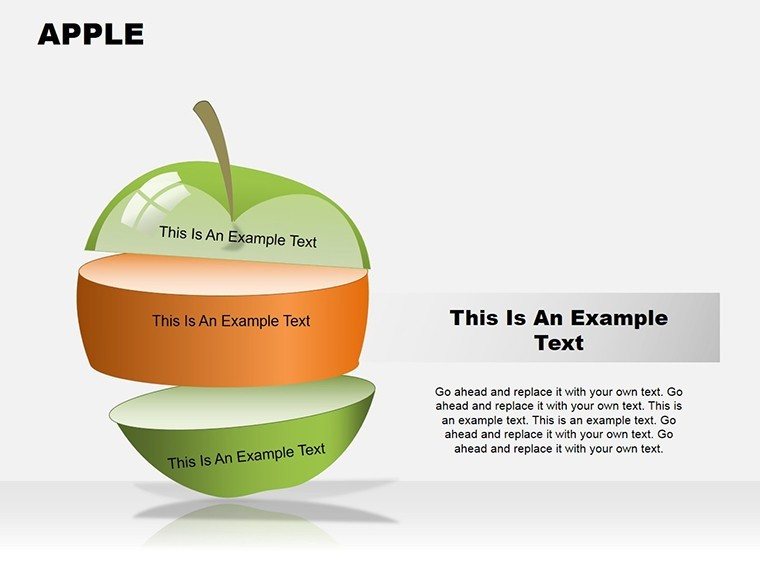
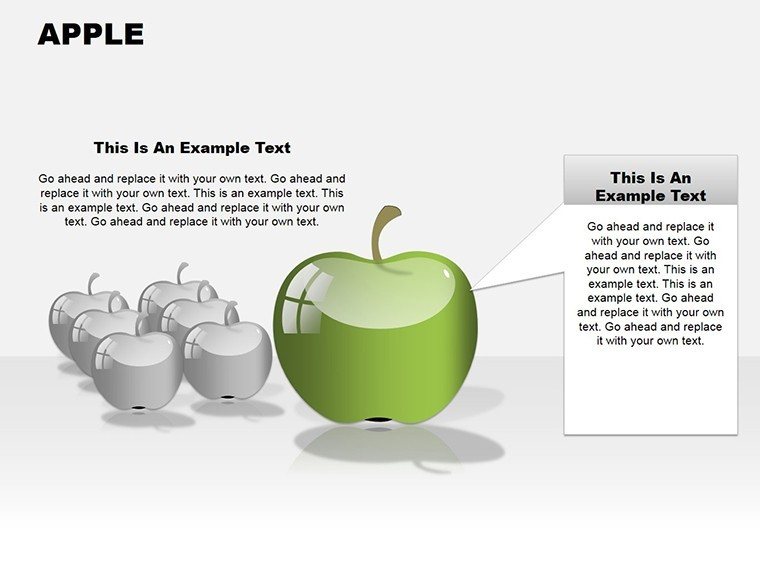
Ever stared at a dataset feeling like you're comparing apples to oranges? Our Apple PowerPoint Diagrams template flips that script - 14 editable slides shaped like crisp, iconic apples to intuitively compare variables, pinpoint max and min values, and showcase performance metrics. Geared toward project managers, sales teams, and analysts in dynamic industries like tech and retail, this tool makes data dissection deliciously straightforward in Microsoft PowerPoint.
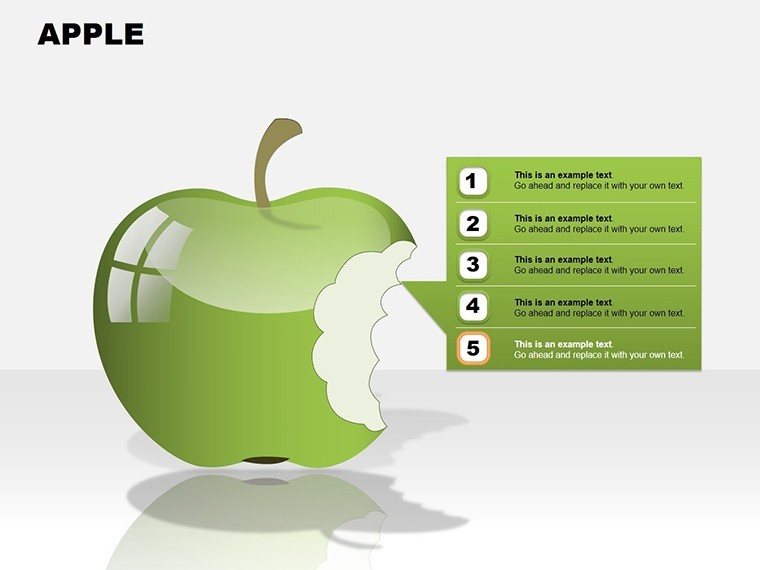
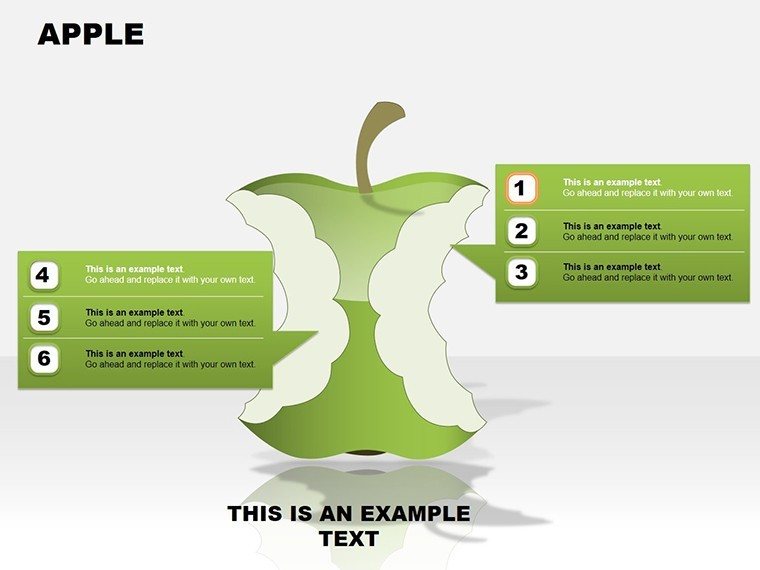
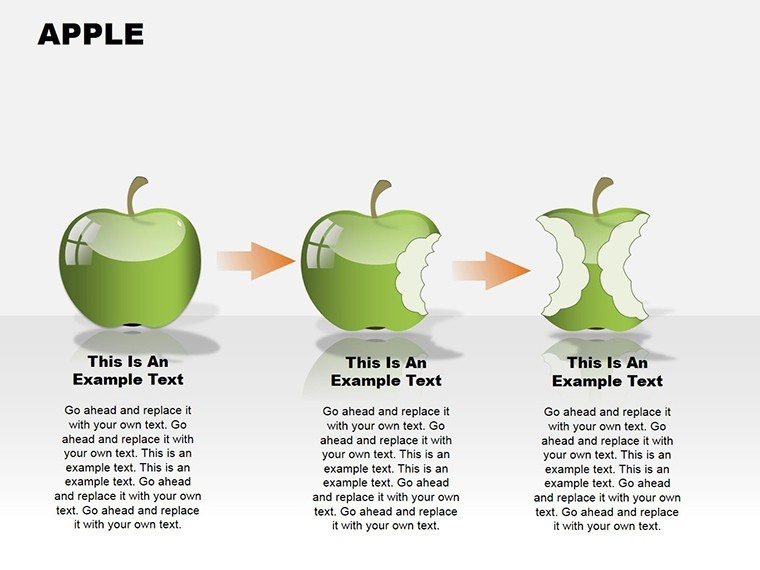
The genius lies in its metaphorical charm: Each apple represents a category, with bites or slices illustrating variances - bigger bites for highs, smaller for lows. No wonder teams at companies like Apple Inc. (ironically) use analogous visuals in quarterly reviews to drive home growth stories. This template tackles the drudgery of raw numbers, turning them into scannable, memorable graphics that foster quicker decisions and deeper discussions. Fully vector-based for sharp prints or screens, it's your go-to for reports that resonate.
Beyond aesthetics, it's built for action: Easy drag-to-edit functionality means updating quarterly sales figures takes minutes, not hours. In a world overloaded with info, these diagrams cut through, helping you not just present data, but provoke insights - like why Q3 dipped or how to scale wins.
Essential Features: Slicing Through Data Complexity
Packed into 14 slides, the template offers a variety of apple configurations - from single fruits for solo metrics to orchards for multi-category showdowns. Core strengths include layered editing for depth and compatibility with PowerPoint's animation suite for phased reveals.
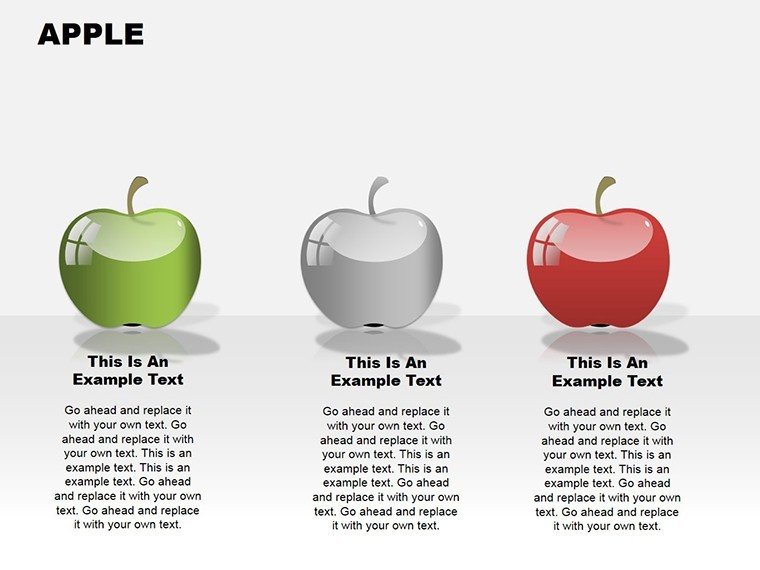
- Comparative Apples: Side-by-side fruits for head-to-head analysis, with shaded segments for percentage diffs.
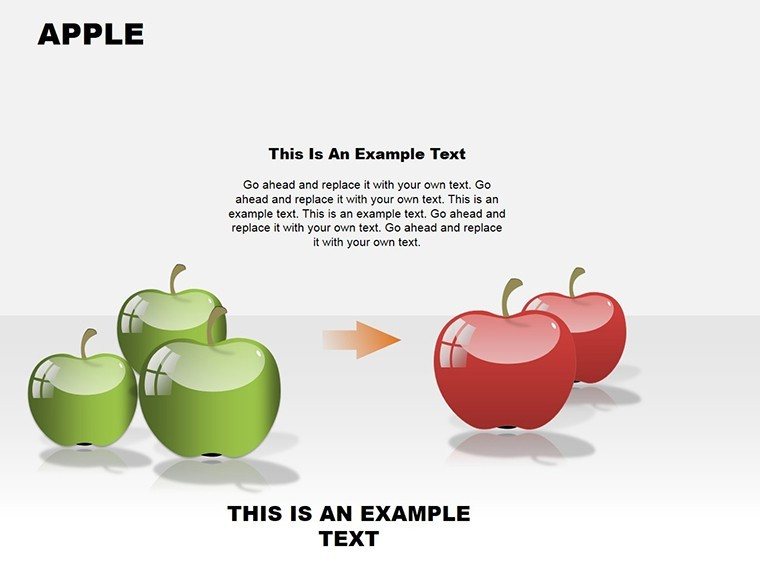
- Performance Orchards: Grid layouts clustering apples by team or region, ideal for KPI dashboards.
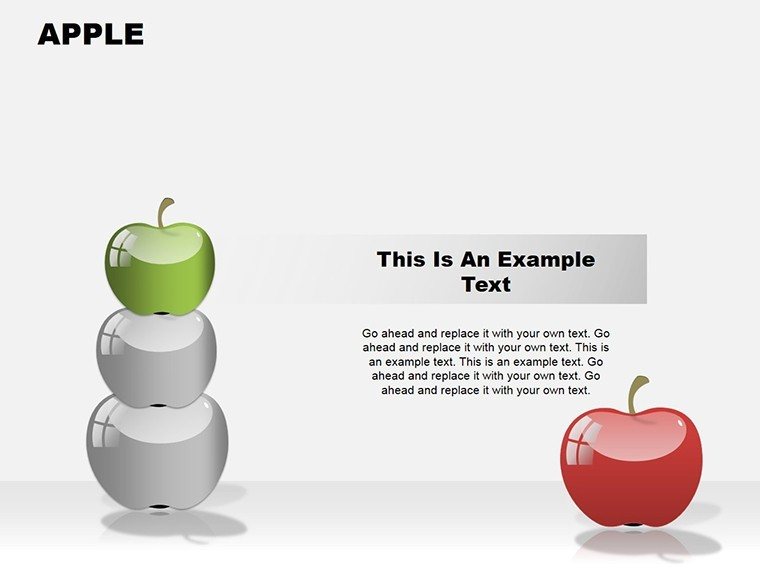
- Min/Max Markers: Highlighted cores or stems to flag extremes, with callout text for context.
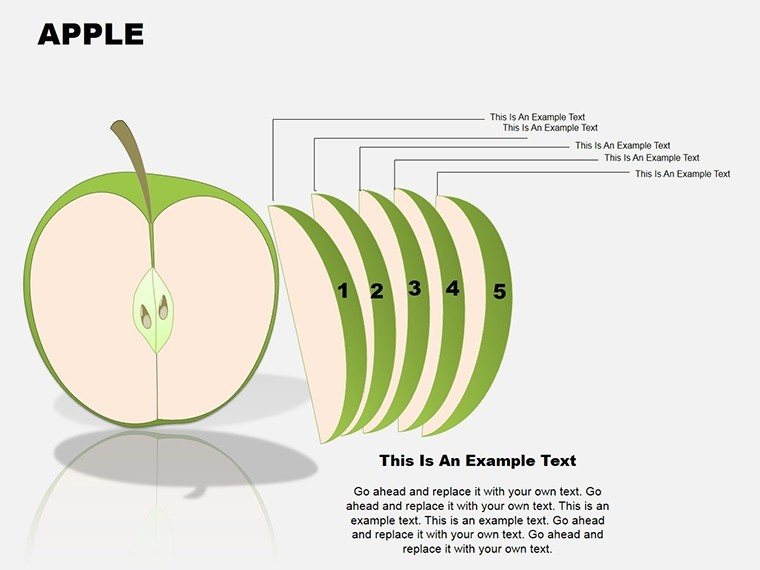
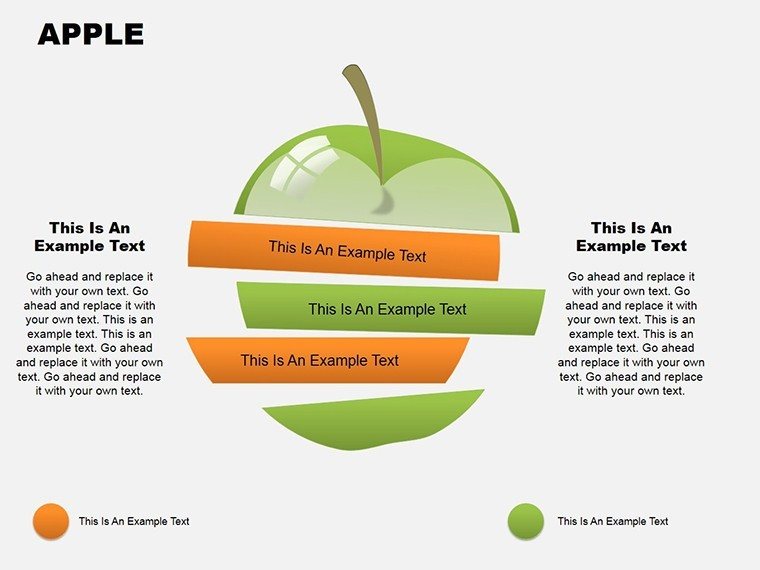
- Custom Slices: Pie-like divisions within apples for sub-metrics, all resizable without distortion.
Customization flows naturally: Recolor apples to seasonal themes (red for alerts, green for growth), swap icons for industry flair, or embed hyperlinks to source files. Versus basic PowerPoint shapes, this delivers 3D-like depth with 2D simplicity, saving pros hours on polish. Field-tested in sales huddles, where it clarified pipeline variances, leading to 25% faster strategy pivots.
Practical Applications: From Sales Scores to Project Pulse
Sales pros, envision quarterly targets as apple baskets - ripe ones for hits, bruised for misses - driving coaching convos with visual punch. Project managers? Map timelines with apple trees, branches for milestones, fruits for deliverables, spotting delays early. Analysts in retail use orchard views for inventory turns, comparing store performances to optimize stock.
Even in education, adapt for grade distributions, making report cards engaging. Real-world nod: A Forrester report highlights how metaphorical diagrams like these boost retention by 35% in business intel sessions. For remote teams, the clean exports to OneDrive ensure collaborative tweaks without version chaos.
Layer in trends with animated growth - apples ripening over slides - to narrate progress arcs. It's versatile, scaling from solo freelancer gigs to enterprise dashboards.
Harvesting Insights: Your Step-by-Step Guide
- Acquire and Activate: Download .pptx and launch in PowerPoint - immediate edit mode.
- Populate Produce: Fill data fields; auto-scales keep proportions true.
- Flavor with Custom: Adjust hues, add labels, integrate charts via insert.
- Animate Harvest: Sequence reveals to build suspense, like unveiling a full orchard.
- Distribute Delights: Share via email or cloud, with alt-text for accessibility.
This process meshes with Excel pulls for live data, streamlining recurring reports. Insider tip: Use contrasting stems for baselines, grounding comparisons in reality.
Design Hacks: Making Apples Irresistible
For max impact, limit to 5-7 apples per slide - clarity over quantity. Incorporate subtle shadows for 3D pop, and always align with brand fruits (no oranges here!). In high-stakes reviews, pair with executive summaries for a one-two punch. Accessibility? High-contrast outlines ensure color-blind friendly views.
Drawing from UX principles, these diagrams embody intuitive cognition - humans process shapes faster than grids. Trusted by metrics mavens, it's authoritative for standards like ISO data viz guidelines.
Bite Into Better Presentations: Download Now
Stop juggling disparate data - core your comparisons with the Apple PowerPoint Diagrams template. Instant access, endless edits: It's the fresh take your reports need. Harvest clearer insights today!
Frequently Asked Questions
What makes these diagrams unique for comparisons?
Apple shapes intuitively highlight mins/maxes, turning abstract data into relatable visuals.
Are the slides fully editable?
Yes - drag, resize, recolor everything in PowerPoint with ease.
Compatible with Mac PowerPoint?
Perfectly, across Windows and Mac versions.
Best for what data types?
Performance metrics, sales comparisons, project variances - any variable showdown.
Can I add more apples?
Duplicate slides and extend orchards limitlessly.
Export options?
PDF, image, or video for versatile sharing.
Good for
- Project roadmaps and sprint plans
- Product launch timelines
- Quarterly or annual review decks
- Company history and milestone summaries
Licence
reviews
I Put together a process diagram for work and this saved me from drawing arrows manually.
The Circle layouts actually looked cleaner after I added my own icons.
Used this during a last minute university presentation and it held up fine.
Some text placeholders were too small for longer notes.
Not exciting but useful if you need simple flow diagrams.
FAQ
Will it work in Google Slides?
Are fonts embedded?
Can I use this for client work?
What's the refund policy?
Do you update the template after purchase?
Similar templates
See all Powerpoint Diagrams →
All 14 slides