 Click to zoom
Ansoff Growth Matrix PowerPoint Charts Template
| Format | .pptx |
| Slides | 39 unique layouts |
| Aspect ratio | 16:9 |
| Compatibility | PowerPoint |
| Animated | No |
| Language | English |
| License | Commercial |
| File size | — |
| Version | v1.0 |
| Last updated | December 2025 |
What's inside
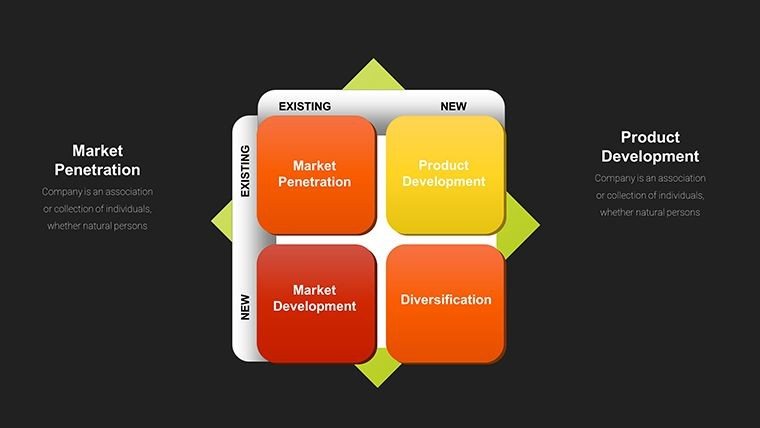
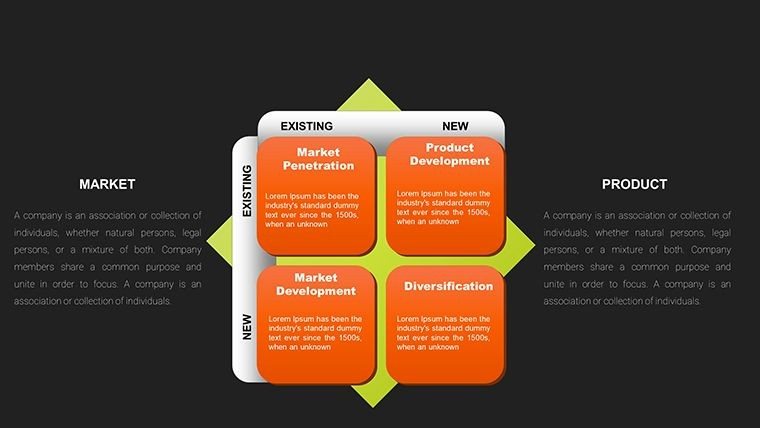
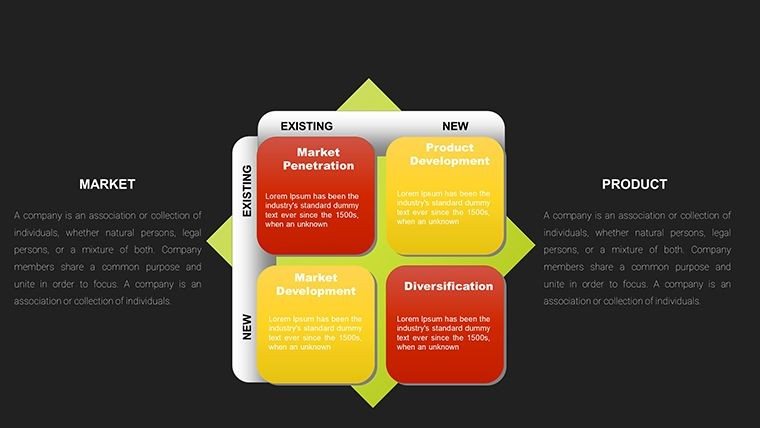
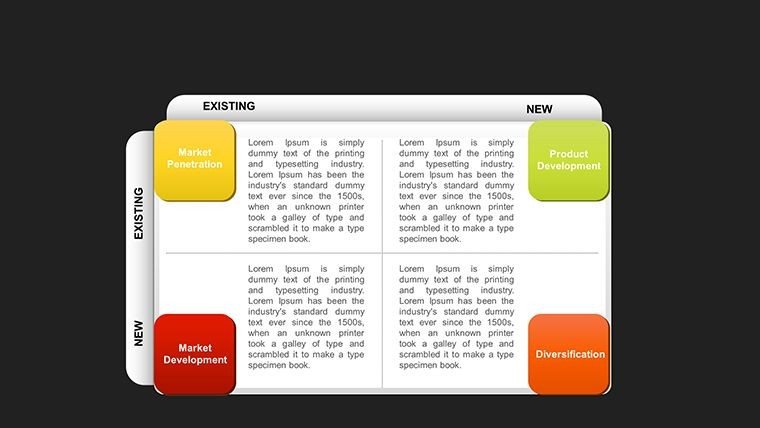
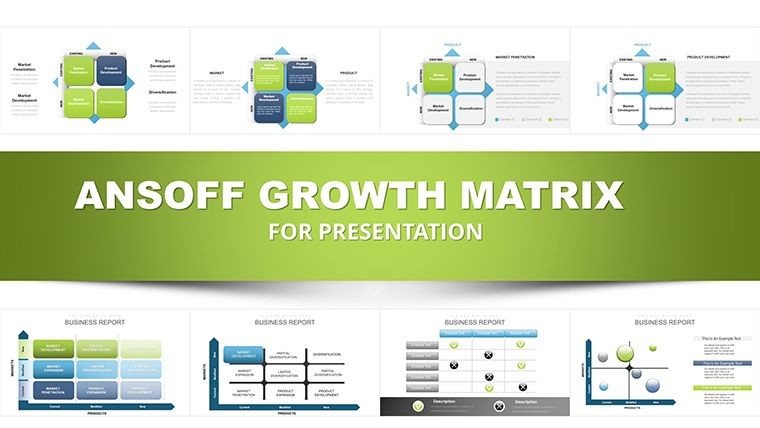
In high-stakes strategy sessions with C-level executives, I've seen how a clear visual framework can turn abstract growth discussions into focused action plans. The Ansoff Growth Matrix PowerPoint template delivers exactly that - a comprehensive set of 39 fully editable slides that bring the classic Ansoff Matrix to life with integrated charts, helping you outline market penetration, market development, product development, and diversification pathways with precision.
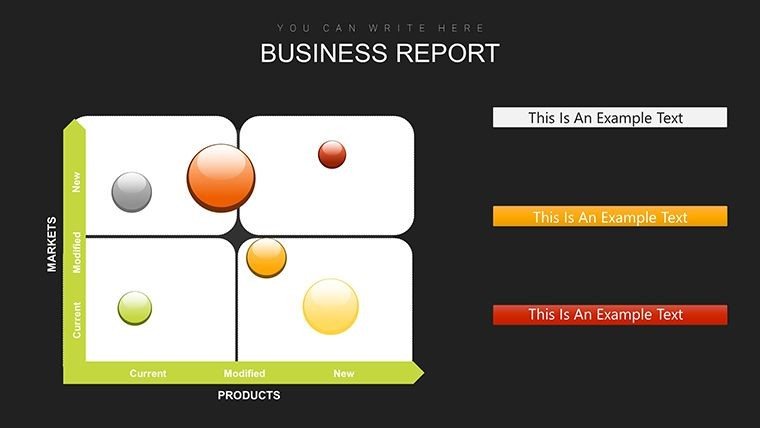
This template stands out by combining the traditional 2x2 matrix grid with advanced data visualizations like radar charts for risk profiling and bubble charts for sizing opportunities. Professionals rely on it to transform raw strategic data into compelling narratives that resonate in boardrooms and investor meetings.
Whether you're guiding a Fortune 500 leadership team through expansion options or advising a scale-up on balanced growth, these slides provide the structure needed to highlight risks, rewards, and recommended paths forward without overwhelming the audience.
Exploring the Core Layouts and Visual Elements
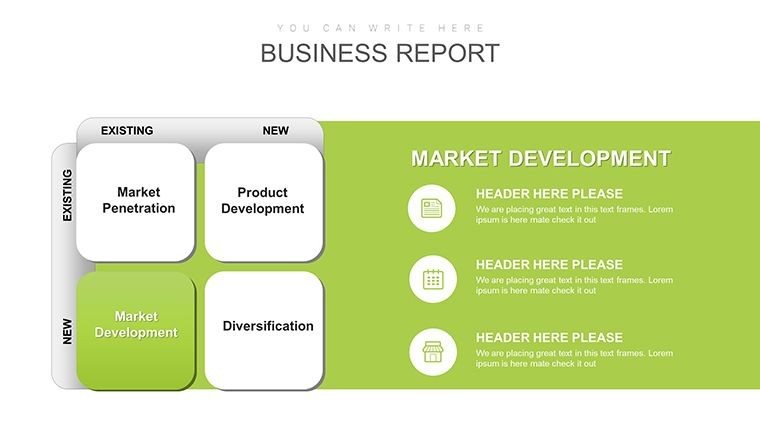
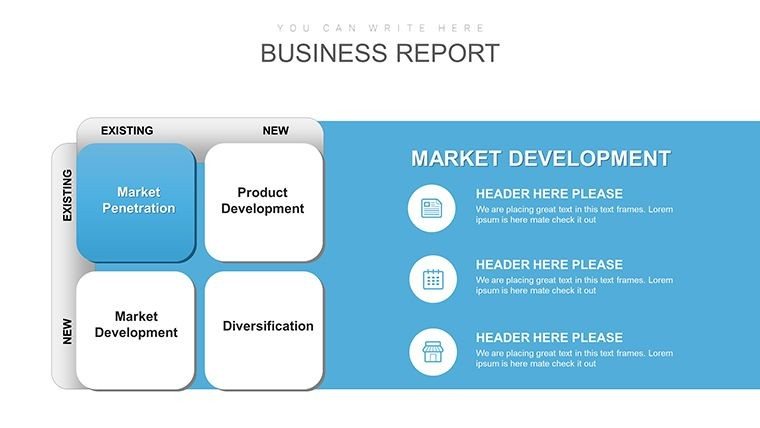
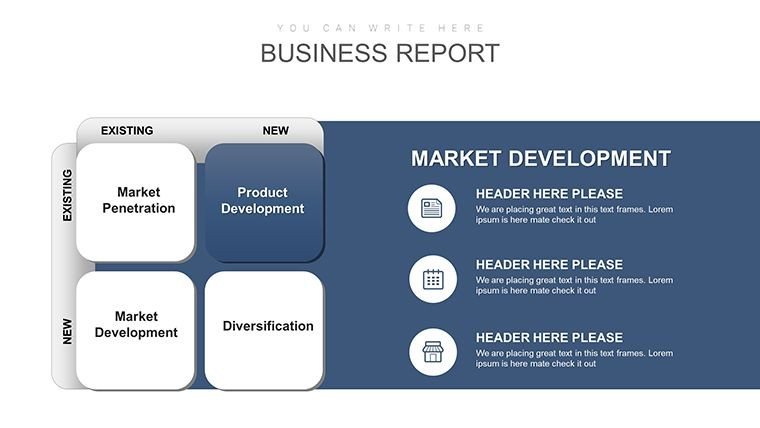
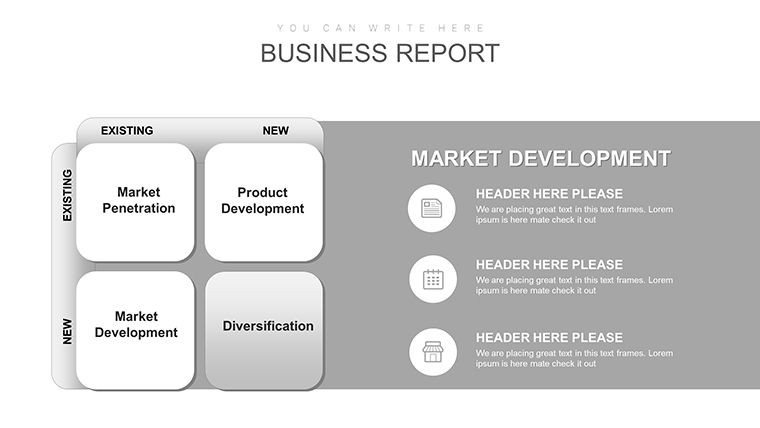
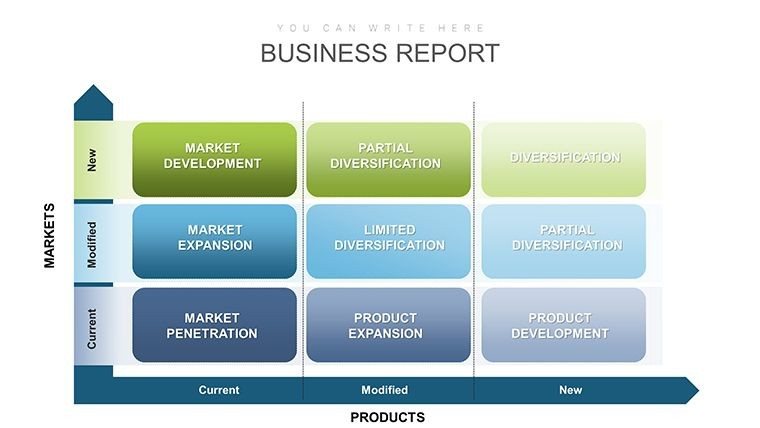
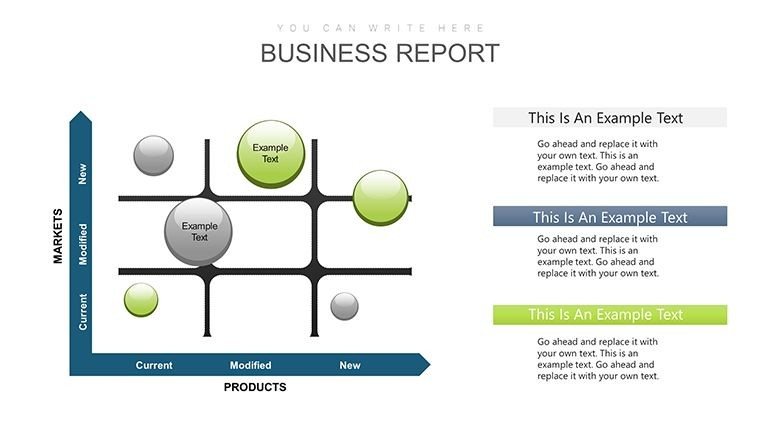
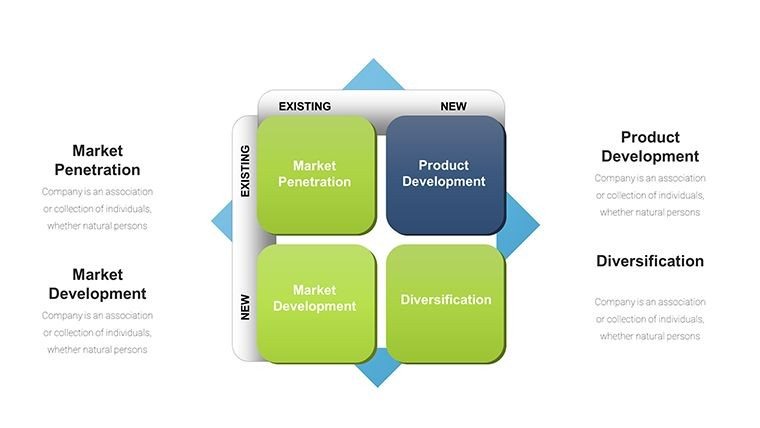
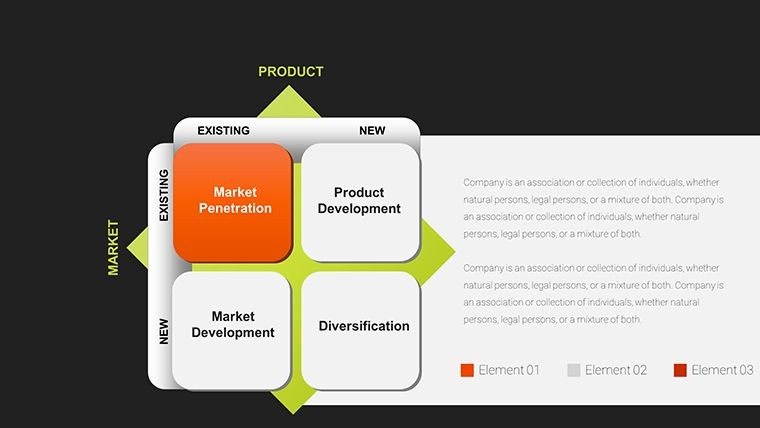
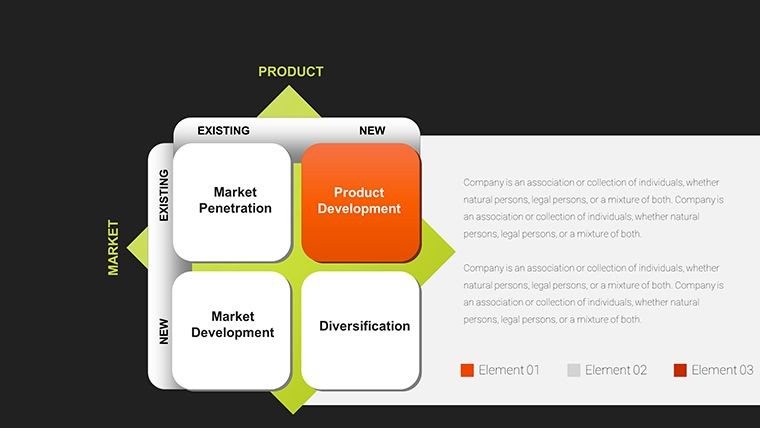
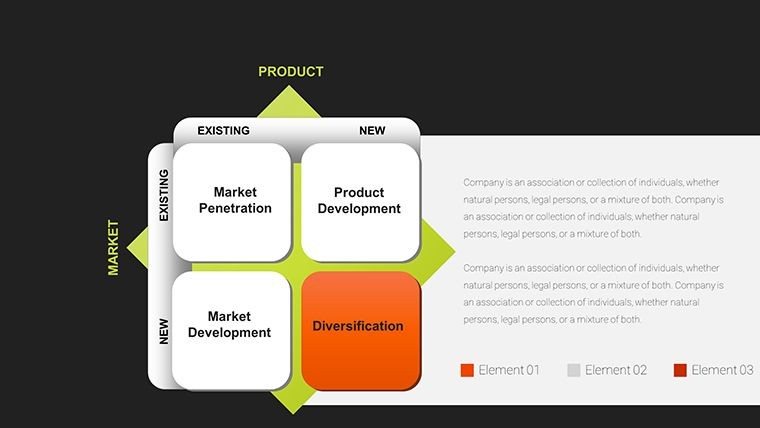
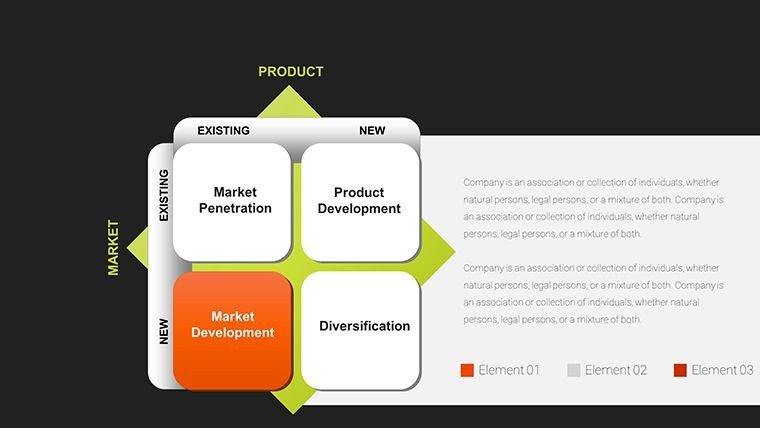
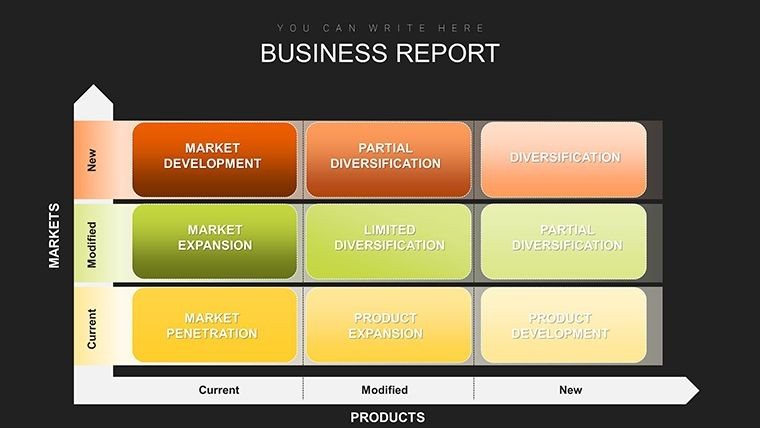
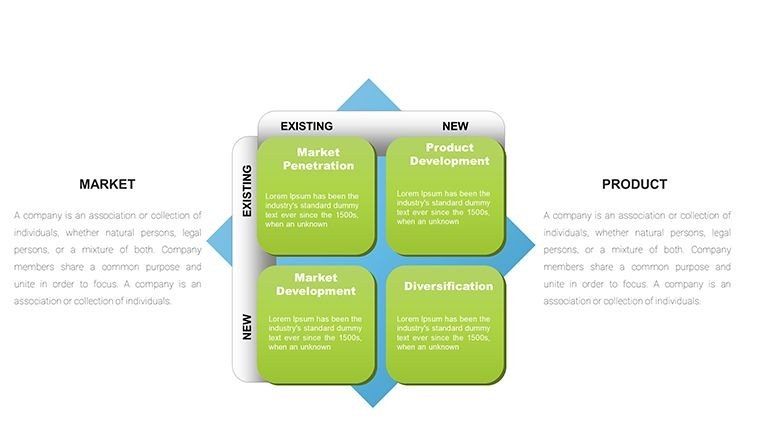
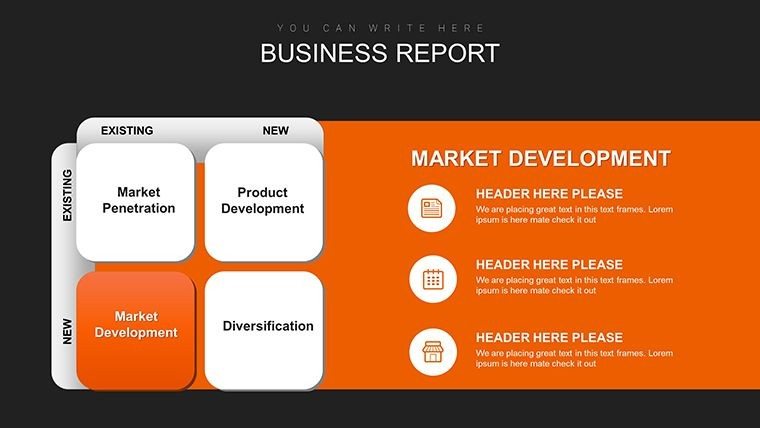
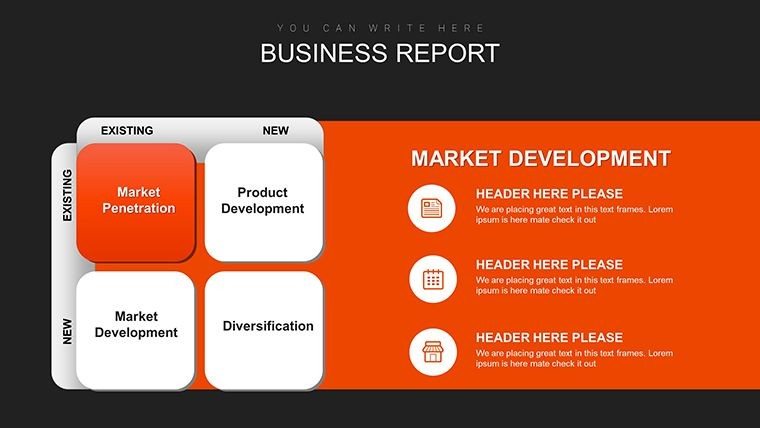
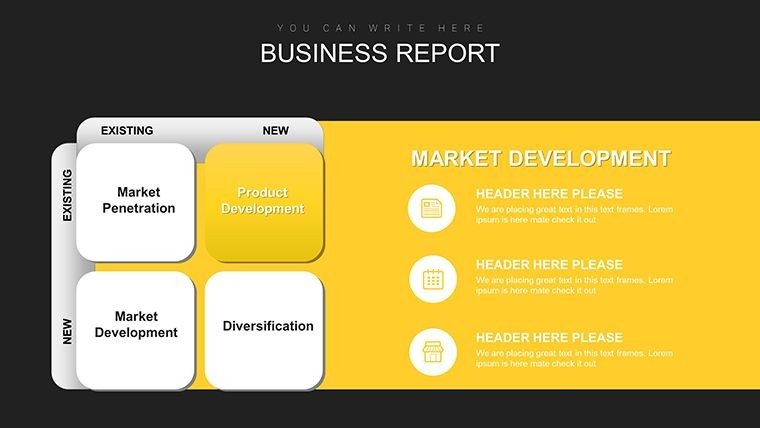
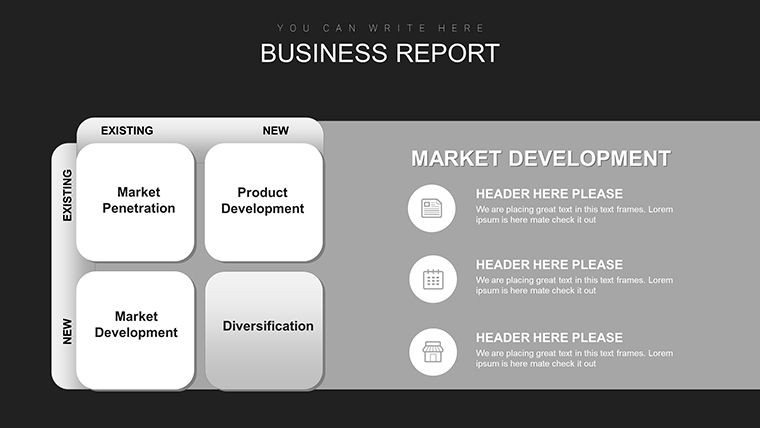
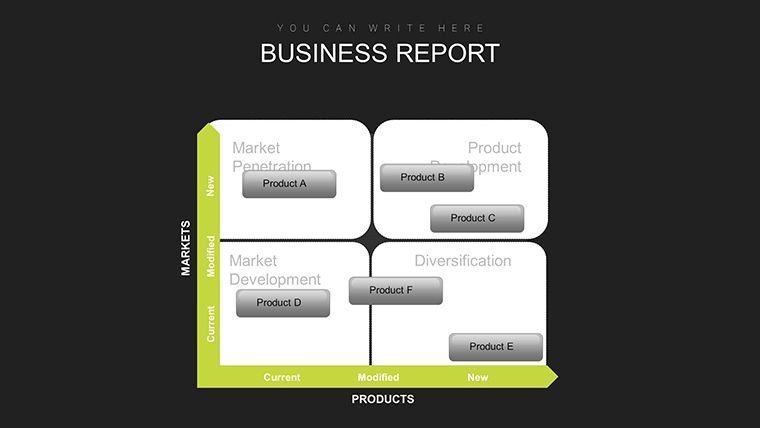
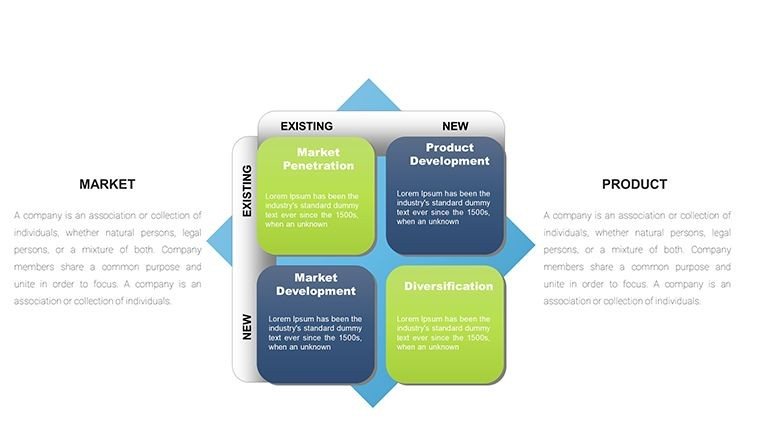
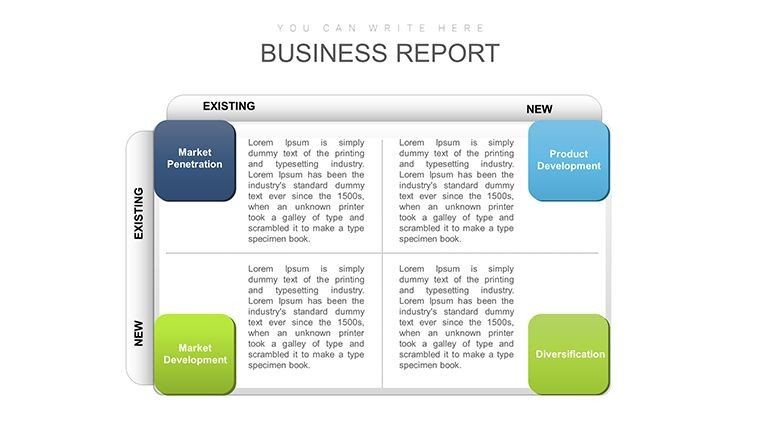
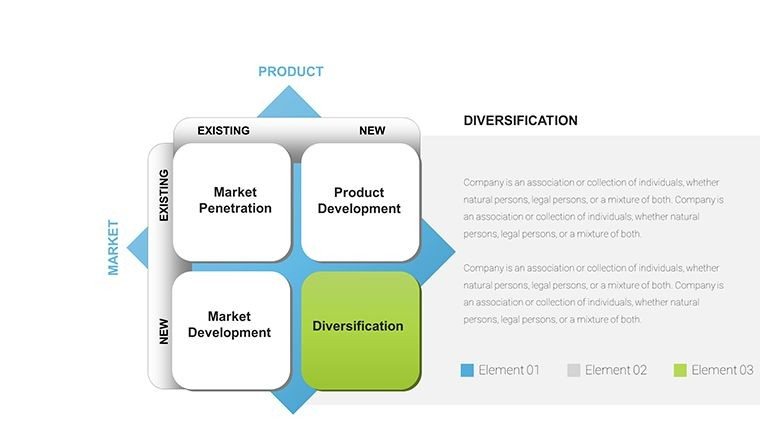
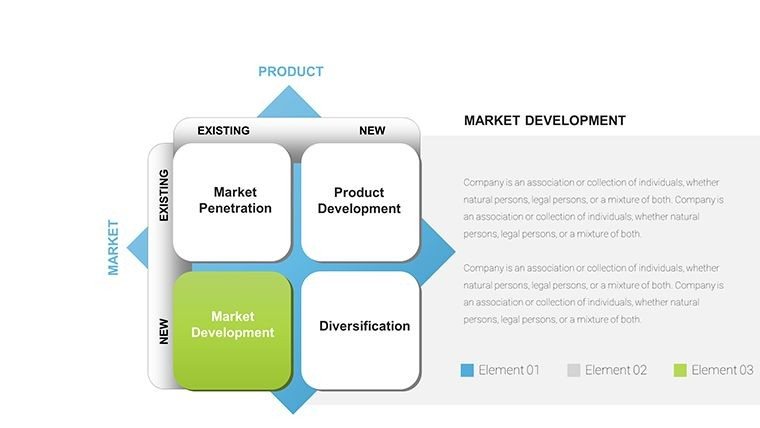
The template opens with foundational slides introducing the Ansoff Matrix framework, setting the context with clean grids divided into the four strategic quadrants. Each quadrant receives dedicated deep-dive sections, featuring layered visuals that allow you to plot specific initiatives.
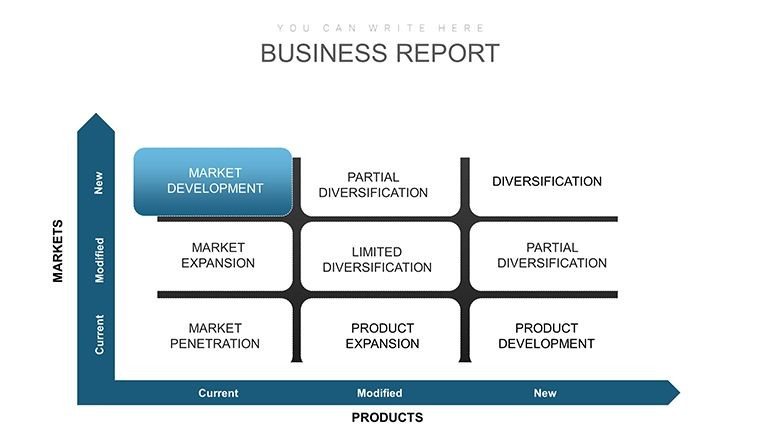
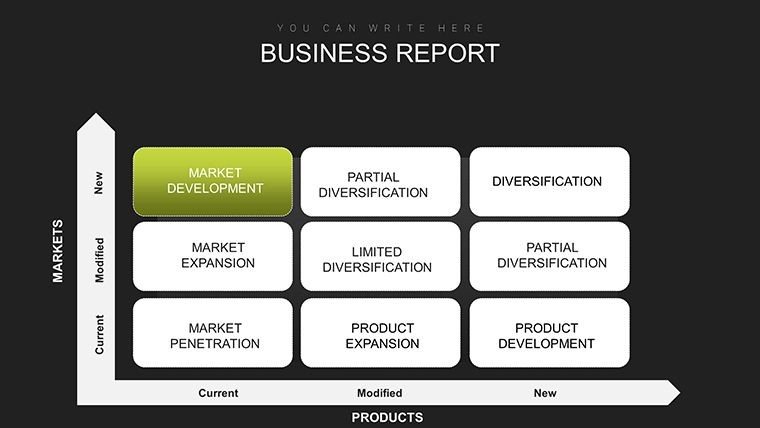
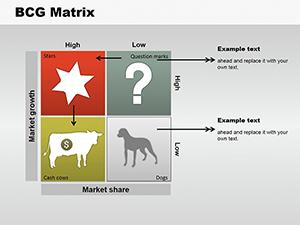
- Matrix Overview Slides: High-level 2x2 grids with color-coded sections for quick strategic scanning, ideal for placing your company's current position and proposed moves.
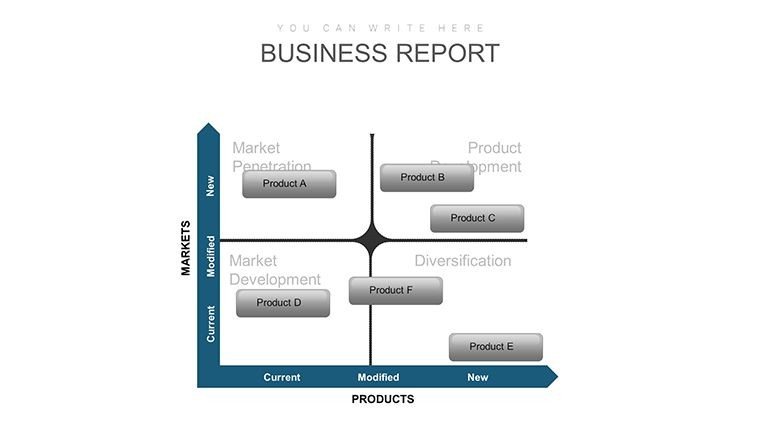
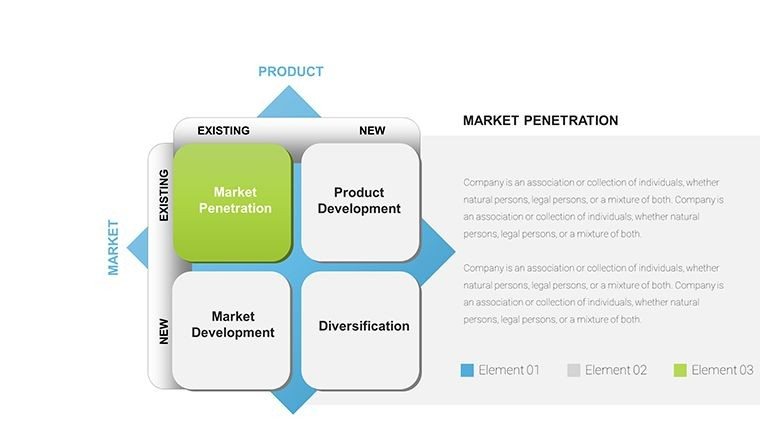
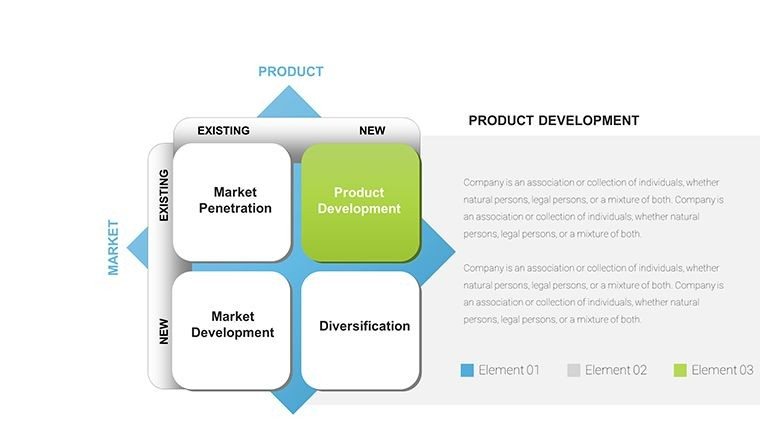
- Quadrant-Specific Breakdowns: Individual slides expand on each strategy - market penetration with sales funnel integrations, market development with geographic maps, product development with innovation timelines, and diversification with portfolio overviews.
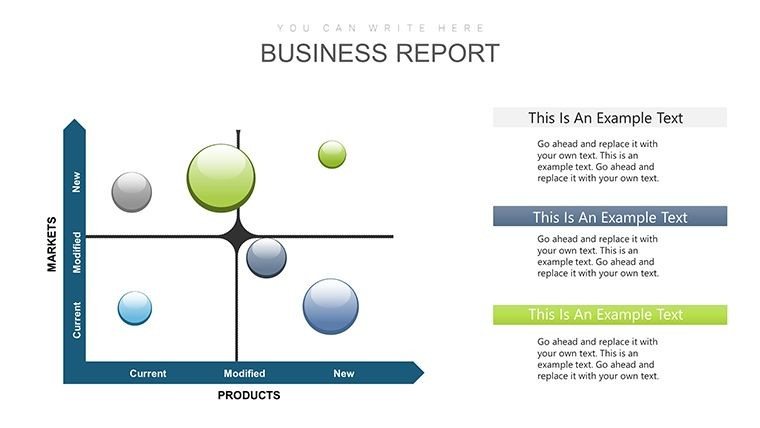
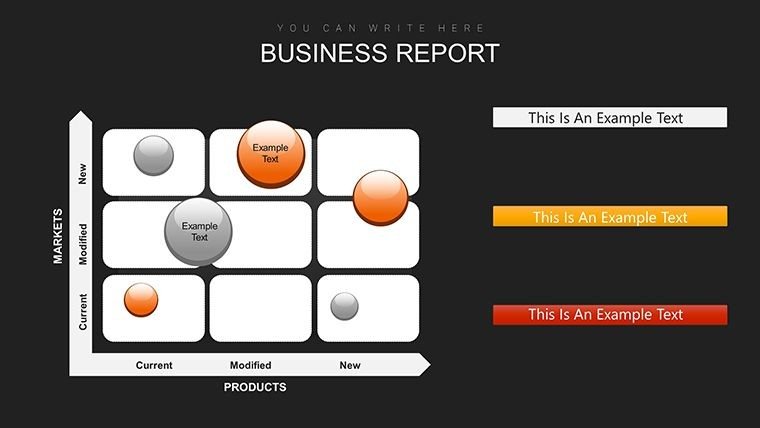
- Data-Driven Chart Integrations: Radar charts to compare risk levels across options, bubble charts to visualize potential revenue impact versus effort required, and supporting bar elements for metric comparisons.
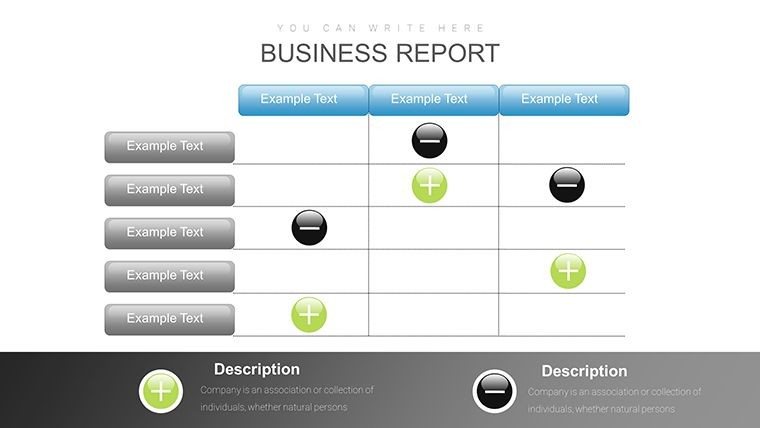
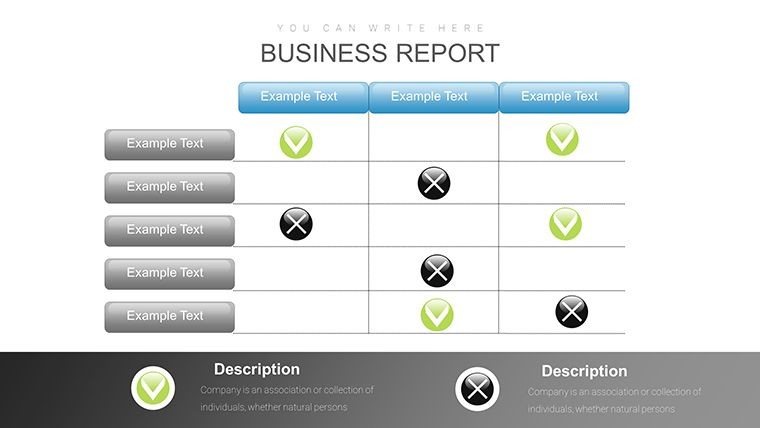
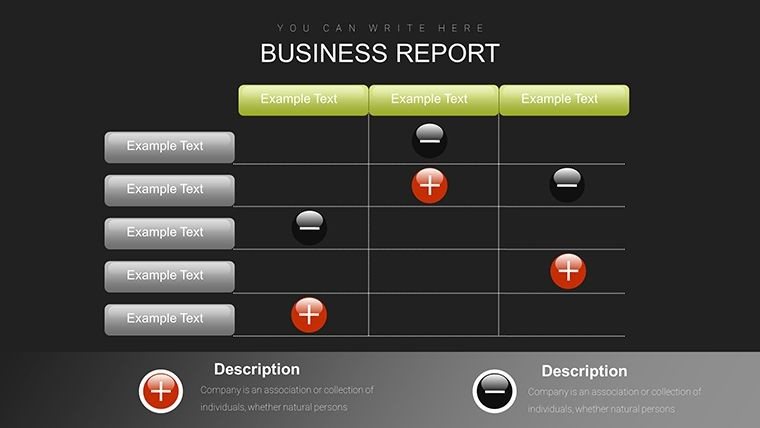
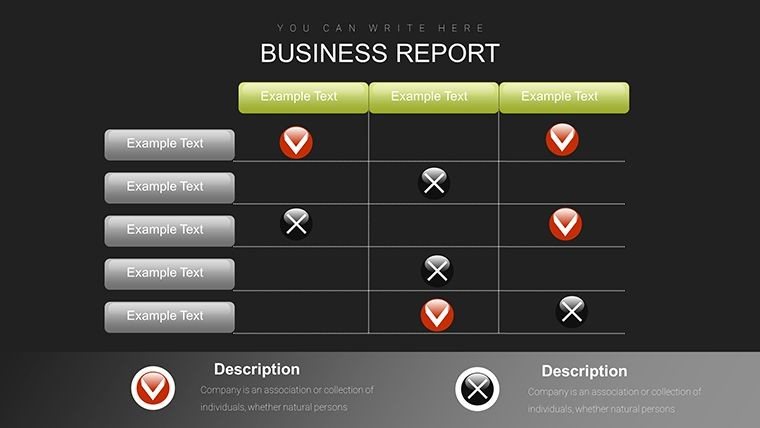
- Risk and Opportunity Assessments: Dedicated layouts for weighing pros, cons, and key metrics in each quadrant, ensuring balanced discussions.
Every element is built for easy customization - adjust colors to match corporate branding, resize charts, or input your data directly for instant updates.
Strategic Applications in Executive Environments
During quarterly strategy reviews for enterprise clients, this Ansoff Growth Matrix template proves invaluable for framing expansion debates. Executives appreciate how it structures conversations around existing versus new markets and products, preventing scattered ideas.
In investor pitch sessions, founders use the diversification quadrant slides to justify bold moves, backed by bubble charts showing projected returns. Government agencies apply it for policy planning, mapping program extensions into new regions.
Consultants deploy the full deck in workshops, guiding teams through interactive quadrant population to build consensus on priority strategies.
Seamless Integration into Your Presentation Workflow
As someone who builds multiple strategy decks weekly, I value tools that slot effortlessly into existing processes. This template opens directly in PowerPoint 2016 and later, or Google Slides, allowing quick imports of Excel data into charts for dynamic linking.
Customization takes minutes: select a slide, update text placeholders with your initiatives, drag data points on charts, and refine colors. The one-time purchase grants lifetime access, meaning you can reuse and adapt it across countless projects without recurring costs.
Instant download means you can start refining your next strategy presentation today, saving hours compared to designing from blank slides.
Real-World Strategy Scenarios I've Delivered
For a tech enterprise client, we used the market development slides to outline entry into emerging regions, with radar charts highlighting competitive risks - securing board approval for the expansion budget.
A manufacturing executive team leveraged product development layouts during annual planning, plotting R&D pipelines against market needs to prioritize investments.
In consulting engagements, I've facilitated offsites where teams populate diversification bubbles live, revealing hidden synergies and avoiding high-risk leaps.
Educators in business programs use the template for case study breakdowns, helping students visualize real-company applications like a retailer's shift to e-commerce penetration.
Analysts in financial services apply the full matrix to merger evaluations, using quadrant comparisons to recommend acquisition targets.
Advantages Over Alternative Approaches
AspectThis Ansoff Matrix TemplateDefault PowerPoint ChartsBuilding from ScratchFree Online OptionsSlide Variety and Depth39 specialized layouts with integrated advanced chartsBasic grids and simple charts onlyTime-intensive custom designLimited to 5-10 generic slidesVisual ProfessionalismPolished, color-rich designs ready for executivesPlain and outdated appearancesInconsistent stylingAmateur-level graphicsCustomization SpeedMinutes to brand and populateHours for basic enhancementsDays of layout workRestricted editing optionsStrategic FocusBuilt-in risk/opportunity visualsNo framework guidanceManual structure buildingMissing quadrant depthIndustry-Specific Strategic Mapping
In finance, teams map portfolio diversification against market penetration in core assets. Technology firms visualize product line extensions into adjacent markets. Healthcare organizations assess service development in existing patient bases versus new demographics.
Marketing departments plot campaign strategies across quadrants for brand growth. Consulting practices use it universally for client roadmap deliverables.
Frequently Asked Questions
How do I populate the radar charts with my own risk data?
Select the radar chart on the risk assessment slide, right-click to edit data, and input your scores for factors like competition or execution complexity. The axes update automatically, providing an instant visual comparison across the four growth strategies.
Can I link these slides to live Excel data for updates?
Yes - copy charts from Excel and paste as linked objects in PowerPoint, or edit the embedded data sheets directly. This keeps your bubble and radar visuals current as underlying assumptions change during strategy iterations.
Is this template suitable for Google Slides presentations?
Absolutely; upload the .pptx file to Google Slides for full editing compatibility. All layouts, colors, and chart functionalities transfer seamlessly, making it ideal for collaborative remote strategy sessions.
What if I need to focus only on one quadrant, like diversification?
Duplicate the dedicated diversification slides and delete others for a streamlined deck. The modular design allows easy extraction of quadrant-specific sections with their supporting charts for targeted discussions.
Does the template include examples for each growth strategy?
Yes, placeholder text and sample data illustrate real-world applications in each quadrant, which you can replace with your specifics. This accelerates setup while demonstrating effective matrix usage.
Good for
- Project roadmaps and sprint plans
- Product launch timelines
- Quarterly or annual review decks
- Company history and milestone summaries
Licence
reviews
The gauge chart with needle is classic.
Used this for a KPI dashboard.
The needle rotates easily in editing.
FAQ
Will it work in Google Slides?
Are fonts embedded?
Can I use this for client work?
What's the refund policy?
Do you update the template after purchase?
Similar templates
See all PowerPoint Charts →
All 39 slides