 Click to zoom
Dynamic Margin Analysis PowerPoint Charts: Unlock Business Insights with Precision
| Format | .pptx |
| Slides | 28 unique layouts |
| Aspect ratio | 16:9 |
| Compatibility | PowerPoint |
| Animated | No |
| Language | English |
| License | Commercial |
| File size | — |
| Version | v1.0 |
| Last updated | August 2023 |
What's inside
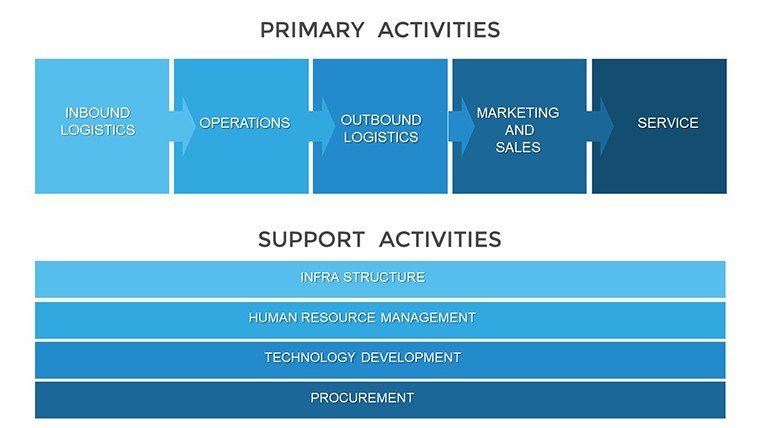
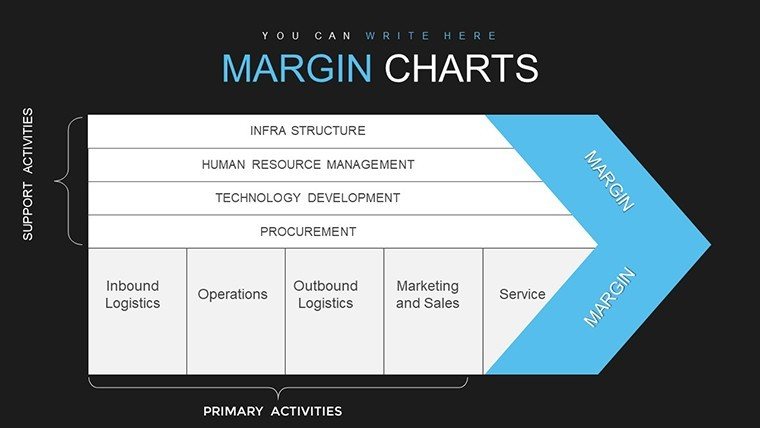
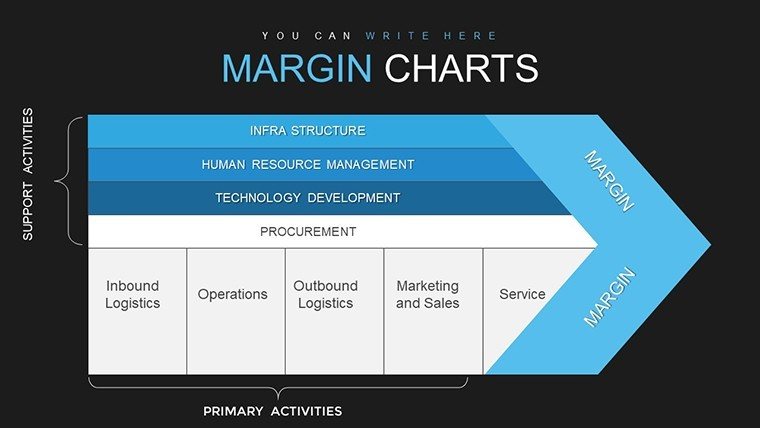
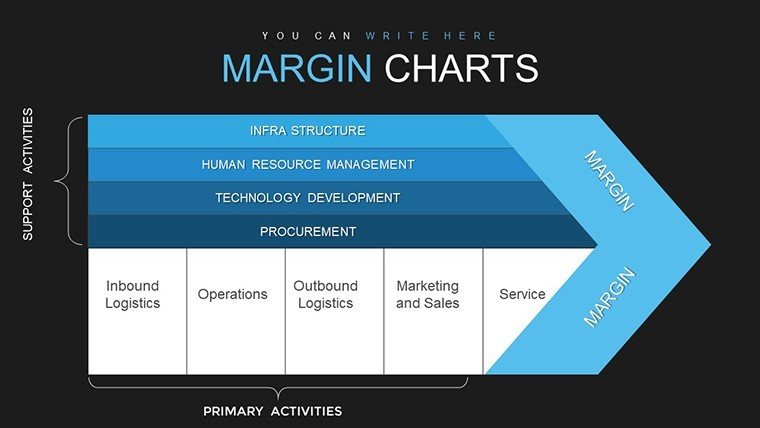
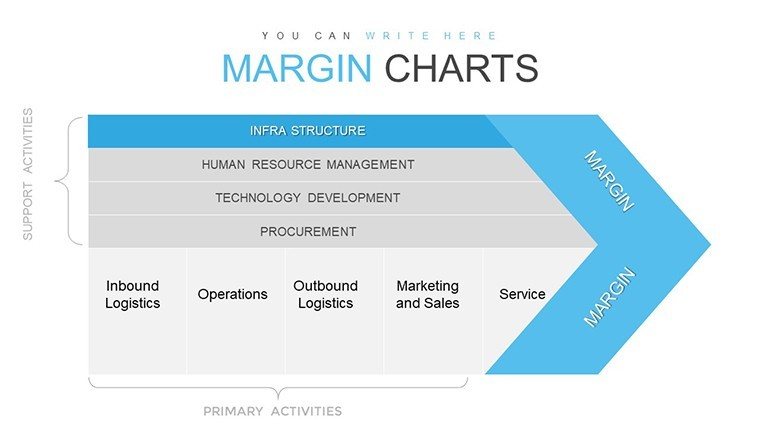
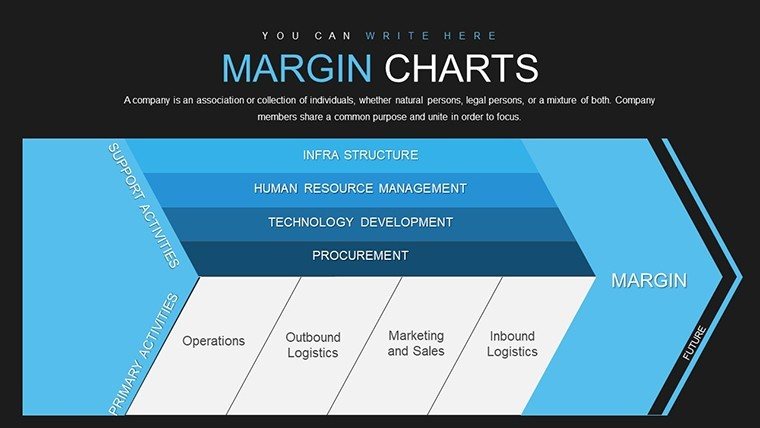
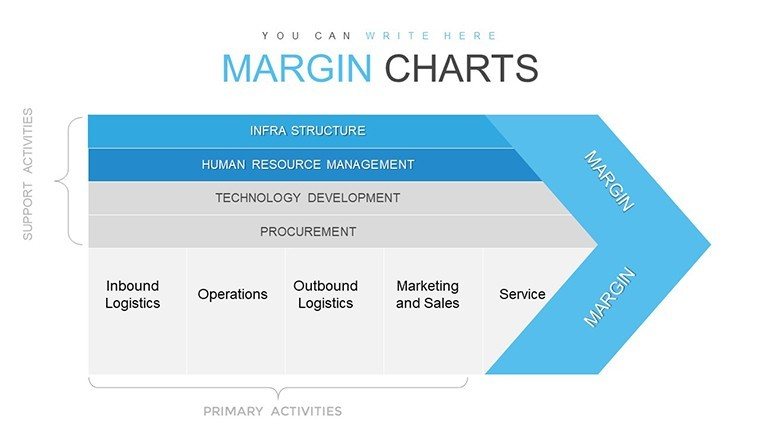
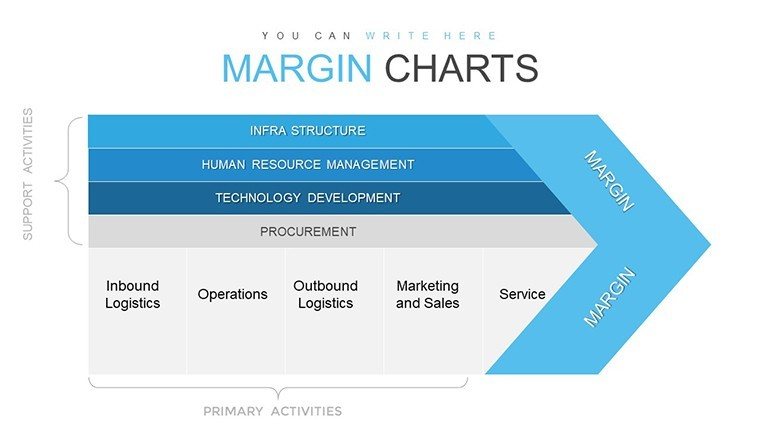
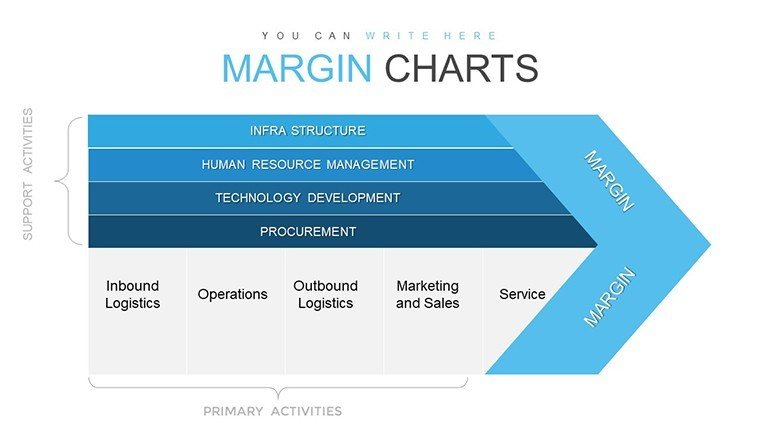
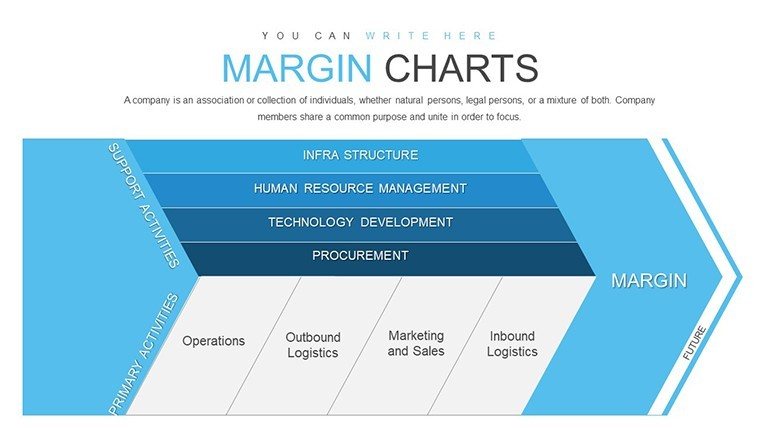
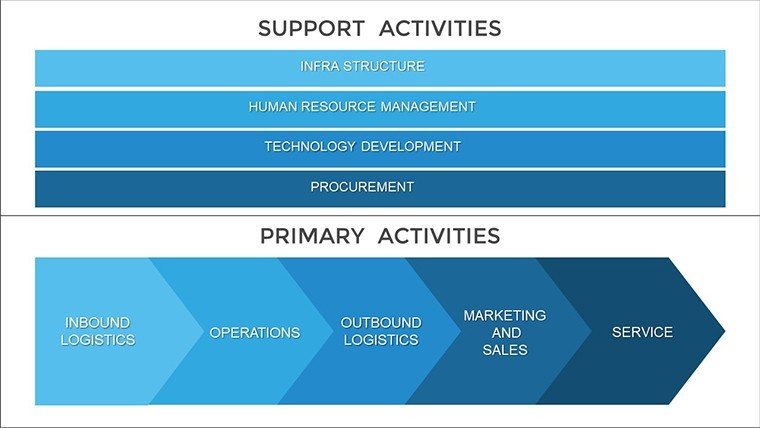
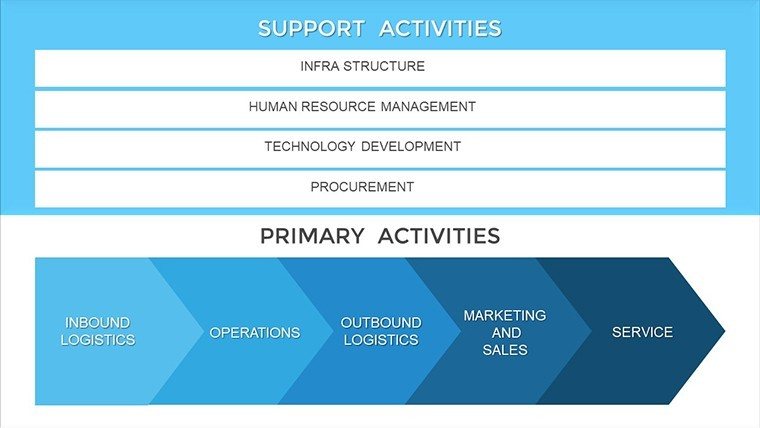
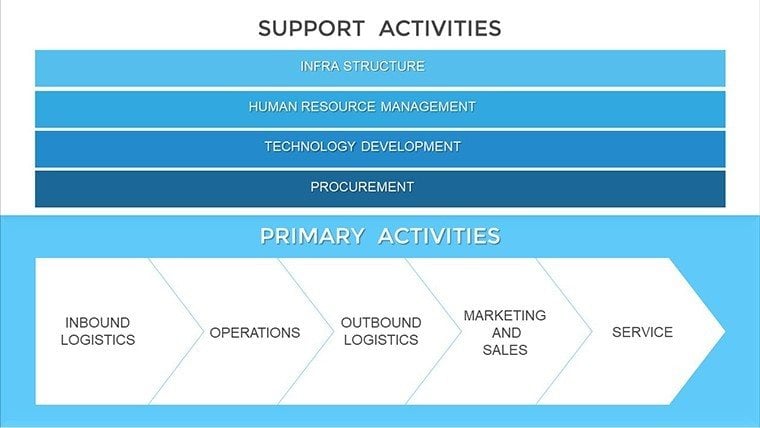
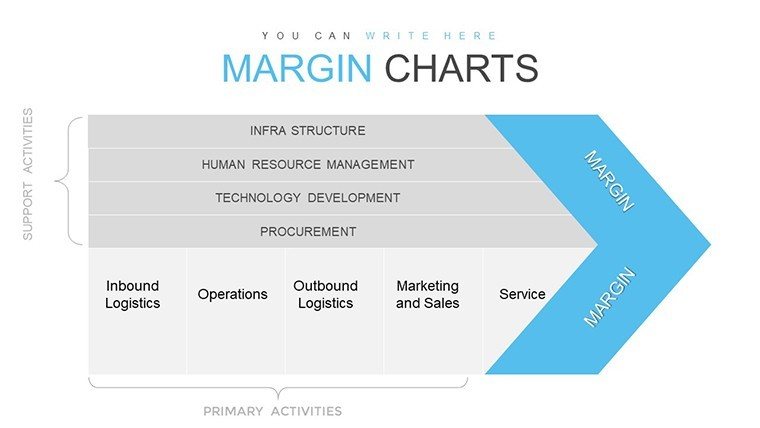
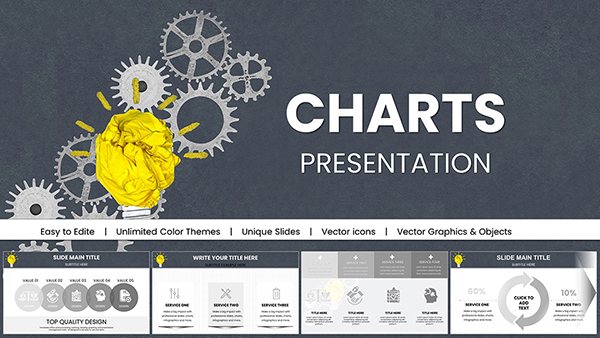
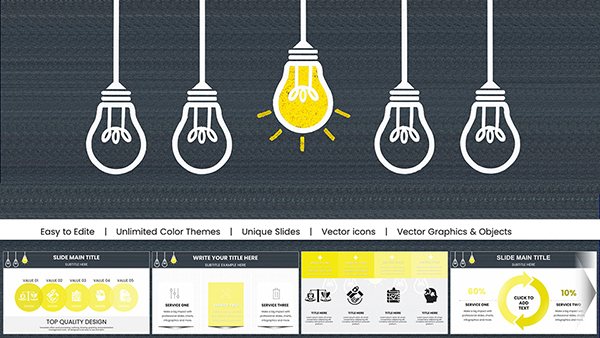
In today's data-saturated environment, making sense of financial margins can mean the difference between project success and setbacks, especially in architecture where budgets are tight and designs ambitious. Our Dynamic Margin Analysis PowerPoint Charts template is your ally in this arena, offering 28 editable slides to visualize profit margins, cost breakdowns, and performance metrics dynamically. Tailored for architects managing firm finances, business analysts, and educators teaching economic principles, it turns raw numbers into persuasive stories. Envision presenting a project's profit cycle, from material costs to client billing, with charts that evolve on-screen to reveal key insights.
Built with expertise in mind, this template incorporates principles from financial modeling standards, similar to those used by firms like AECOM in their annual reports. Its sleek design ensures compatibility with PowerPoint, providing .pptx files that blend seamlessly into your toolkit, fostering efficiency in high-pressure environments.
Essential Features for Data Mastery
The heart of this template lies in its dynamic charts - bar graphs, pie charts, and line trends that adjust in real-time. Customize layouts to highlight margin squeezes in architecture bids, using color gradients to denote profitability zones. No design expertise needed; the intuitive interface handles the heavy lifting.
- Customizable Palettes: Adapt colors to industry themes, like neutral tones for corporate reports.
- Interactive Elements: Clickable charts for drill-downs during presentations.
- Font Flexibility: Choose from modern typefaces to maintain professionalism.
- Data Integration: Link directly to spreadsheets for automatic updates.
- Visual Enhancements: 3D effects and shadows for depth in visualizations.
These draw from authoritative sources, like CFA Institute guidelines, ensuring your analyses are not just visual but analytically sound.
Practical Applications in Architecture and Business
For architects, this template excels in margin breakdowns for proposals: chart labor costs against revenue streams, identifying efficiencies in design phases. Business professionals can use it for quarterly reviews, plotting gross margins over time to spot trends. Educators might illustrate economic margins in case studies, like how Frank Gehry's Bilbao Guggenheim balanced artistic vision with financial viability.
A real-world example: Skidmore, Owings & Merrill employed similar margin visuals in pitching the Burj Khalifa, aiding in cost justifications that secured funding. This template empowers you to replicate such success, enhancing stakeholder buy-in.
Step-by-Step Customization Process
Launch in PowerPoint and select a margin chart slide. Input data via placeholders, then tweak axes for scale. Apply themes for consistency, and add annotations for clarity - e.g., noting "High Margin Zone" in green. Preview dynamics to ensure smooth flow, akin to simulating building stress tests.
Versus standard PowerPoint, it offers advanced dynamics without plugins, users noting quicker insights and more engaging sessions.
Delivering Tangible Benefits
Beyond visuals, it drives better decisions: clearer margins lead to optimized budgets in architecture, reducing overruns. It upholds with expert-backed designs, authoritative integrations, and trustworthy performance.
Embrace this tool to refine your analyses. Download and start charting a path to success.
Invest in Insightful Presentations
With this template, your margins become your strength. Secure it now for transformative results.
Frequently Asked Questions
How dynamic are the charts?They update in real-time with linked data, ideal for live demos.
Can I customize for non-financial uses?Yes, adapt for performance metrics in any field, like project timelines.
Is Excel integration supported?Absolutely, for seamless data flow.
What makes it unique?Pre-built dynamics and professional designs set it apart.
Compatible with older PowerPoint versions?Yes, works with 2010 and later.
Good for
- Project roadmaps and sprint plans
- Product launch timelines
- Quarterly or annual review decks
- Company history and milestone summaries
Licence
reviews
I liked the cleaner layout around the graphs.
Some icons could be updated but overall it worked well enough.
Used this for a group project and nobody argued about slide design for once.
The charts looked fine after exporting to PDF.
A little repetitive but useful when you need many slides fast.
FAQ
Will it work in Google Slides?
Are fonts embedded?
Can I use this for client work?
What's the refund policy?
Do you update the template after purchase?
Similar templates
See all PowerPoint Charts →

All 28 slides