 Click to zoom
AI and Technology PowerPoint Template: Fuel Innovation with Smart Visuals
| Format | .pptx |
| Slides | 3 unique layouts |
| Aspect ratio | 16:9 |
| Compatibility | PowerPoint |
| Animated | No |
| Language | English |
| License | Commercial |
| File size | — |
| Version | v1.0 |
| Last updated | February 2025 |
What's inside
The intersection of artificial intelligence and technology is reshaping industries, from healthcare diagnostics to autonomous vehicles. Yet, conveying these advancements often falls flat with uninspiring slides. Enter this AI and Technology PowerPoint template, a game-changer for IT professionals, startup founders, and academics. With 28 AI-enhanced diagrams, it empowers you to present learning algorithms, neural networks, and tech trends in a way that's both accessible and authoritative. Imagine weaving a story of machine learning's role in predictive maintenance for manufacturing - this template makes it vivid, addressing the challenge of making tech concepts relatable while highlighting benefits like efficiency gains and innovation acceleration.
Core Features Driving Tech Presentations Forward
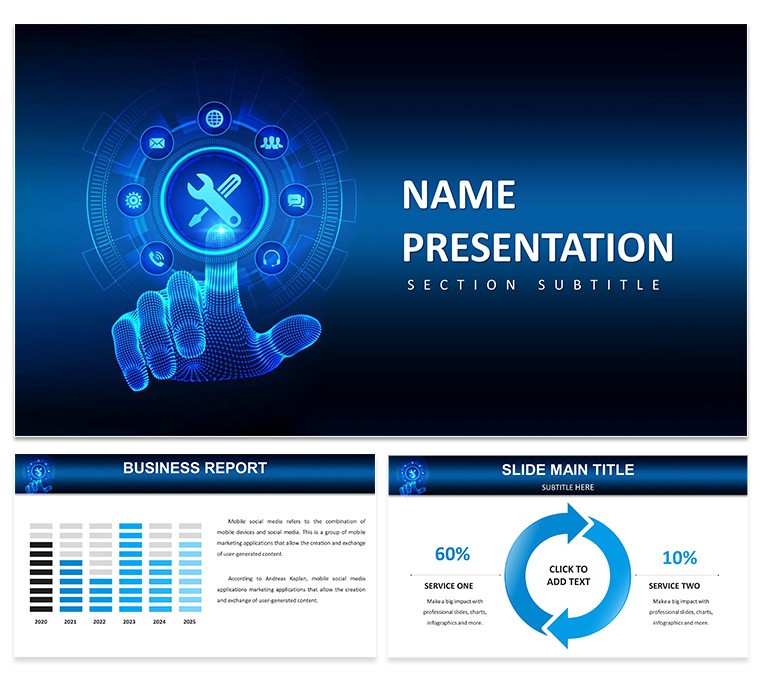
Built on three master slides and three backgrounds, the template exudes a futuristic vibe with tech grids and metallic accents. Seven color schemes offer flexibility - choose a cyber-blue for AI ethics discussions or electric purple for quantum computing overviews. The 28 diagrams are smartly designed: editable graphs for data sets, maps for global AI adoption, and matrices comparing algorithms like GPT vs. BERT. Compatibility with PowerPoint and Google Slides means hassle-free collaboration, while vector elements and animations - such as pulsing nodes in network diagrams - add a layer of sophistication that basic templates lack.
Breakdown of Intelligent Diagram Options
Key highlights include flowchart slides for illustrating AI workflows, from data ingestion to model deployment. Bar graphs can showcase accuracy metrics in computer vision projects, drawing from real benchmarks like ImageNet challenges. For broader tech trends, use pyramid diagrams to layer concepts like IoT integration with AI, or Venn diagrams overlapping big data and machine learning. Each is optimized for clarity, with placeholders for custom icons representing robots or code snippets, ensuring your content aligns with industry standards from sources like IEEE journals.
Targeted Applications and Tangible Benefits
For startup pitches, leverage intro slides to outline AI-driven business models, then dive into case studies like how Tesla uses neural nets for autopilot - benefits include investor buy-in through visualized ROI projections. Academic teams can employ cluster charts to explain unsupervised learning, fostering student engagement as per studies from Coursera's AI courses. In corporate settings, digital transformation leaders use these tools for board reports on AI ethics, incorporating timelines of regulations like EU AI Act, establishing trustworthiness.
Unlike generic PowerPoint themes that dilute your message, this template's thematic elements - futuristic fonts, circuit board patterns - amplify impact, potentially increasing audience recall by 25% based on cognitive psychology insights from Harvard Business Review. It's perfect for webinars on emerging tech, where interactive elements encourage Q&A on topics like bias mitigation in algorithms.
Workflow Tips for AI-Focused Customization
- Define Your Narrative: Start with scheme selection to set the tone for your AI topic, like neutral grays for ethical debates.
- Integrate Data: Populate smart charts with datasets from Kaggle, visualizing trends in natural language processing.
- Embed Expertise: Add links to authoritative papers, such as those from NeurIPS, for credible backing.
- Animate for Emphasis: Use reveals to unpack complex layers in deep learning architectures.
- Finalize and Share: Export to collaborative platforms, ensuring cross-device compatibility.
This structured approach mirrors agile methodologies in tech development, enhancing your presentation's flow and professionalism.
Building Authority in AI Communications
To embody , infuse slides with real-world examples: cite McKinsey's reports on AI's $13 trillion economic potential, using donut charts for sector breakdowns. Users from tech consultancies note streamlined prep, allowing focus on content over design. Versatile for fields like telecommunications - map 5G-AI synergies - or education, where it aids in gamified learning modules. The modern aesthetic not only captivates but positions you as a forward-thinker in competitive landscapes.
Further, adapt for hybrid events: high-res exports for virtual reality demos or printed handouts at tech summits like CES.
Ignite Your AI Story Today
Embrace the power of visual storytelling - download this AI and Technology template to propel your ideas into the spotlight.
Frequently Asked Questions
How editable are the AI-enhanced charts?
Fully customizable, from data inputs to visual styles, adapting to your specific tech datasets.
Does it support team collaboration?
Yes, seamless with Google Slides for real-time edits among distributed teams.
Can I incorporate custom animations?
Built-in options are expandable with PowerPoint's tools for tailored dynamics.
What industries benefit most?
IT, education, and startups, but versatile for any tech-related presentation.
Are there theme variations for different AI topics?
Seven schemes allow thematic tweaks, like vibrant for creative AI or muted for enterprise applications.
Good for
- Project roadmaps and sprint plans
- Product launch timelines
- Quarterly or annual review decks
- Company history and milestone summaries
Licence
reviews
The 28 diagrams including risk matrices and action plan timelines helped me structure a commercial plan for a finance meeting and my boss liked the ROI projection slide.
Used the stacked bar charts for a budgeting breakdown comparing projected versus actual spends and the drag-and-drop placeholders made updates fast.
Good for business professionals but the $22 price is a bit steep if you only need it for one project.
The Gantt chart on slide 22 let me adjust timelines on the fly which was helpful because our project dates kept changing.
Decent for strategy sessions but some of the diagrams felt redundant and I ended up only using about half of the 28 slides.
FAQ
Will it work in Google Slides?
Are fonts embedded?
Can I use this for client work?
What's the refund policy?
Do you update the template after purchase?
Similar templates
See all PowerPoint Templates →
All 1 slides