 Click to zoom
9-Period Cycle Keynote Charts: Revolutionize Architectural Data Visualization
| Format | .pptx |
| Slides | 24 unique layouts |
| Aspect ratio | 16:9 |
| Compatibility | PowerPoint |
| Animated | No |
| Language | English |
| License | Commercial |
| File size | — |
| Version | v1.0 |
| Last updated | September 2021 |
What's inside
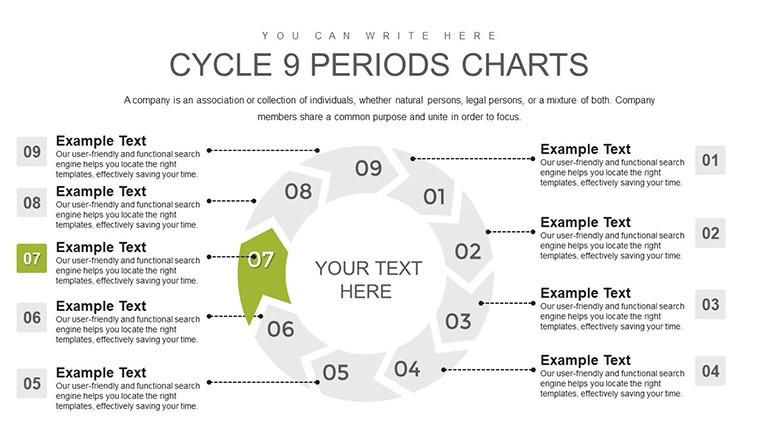
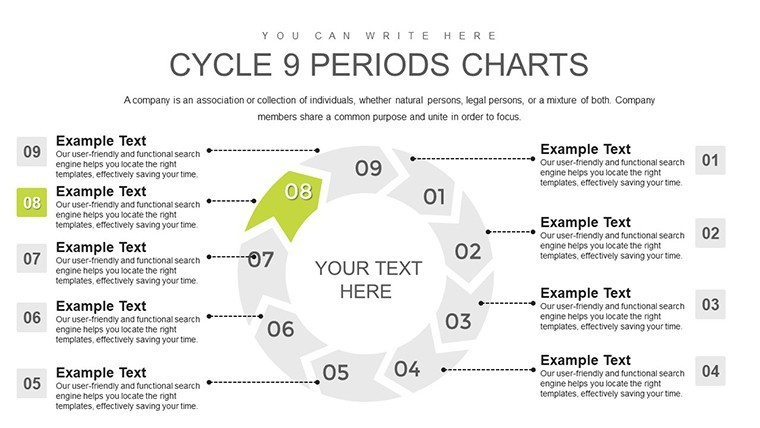
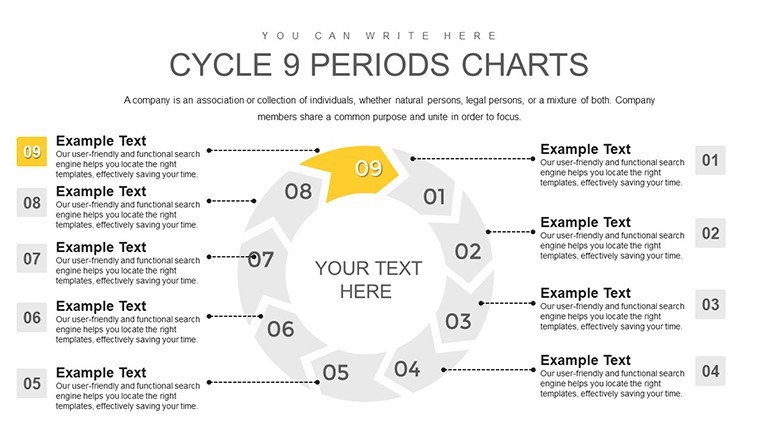
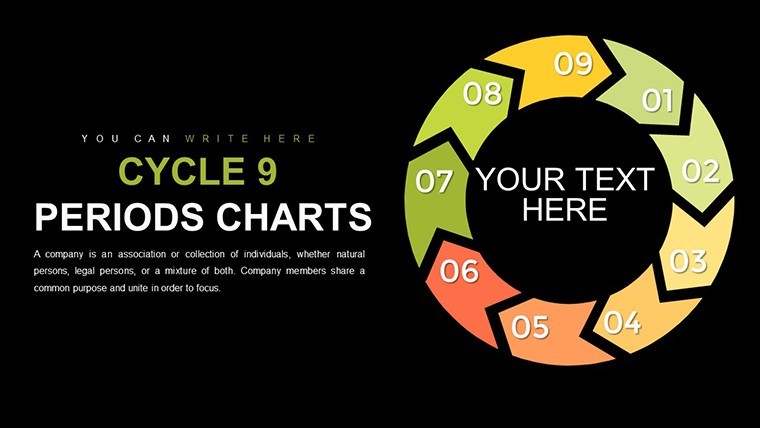
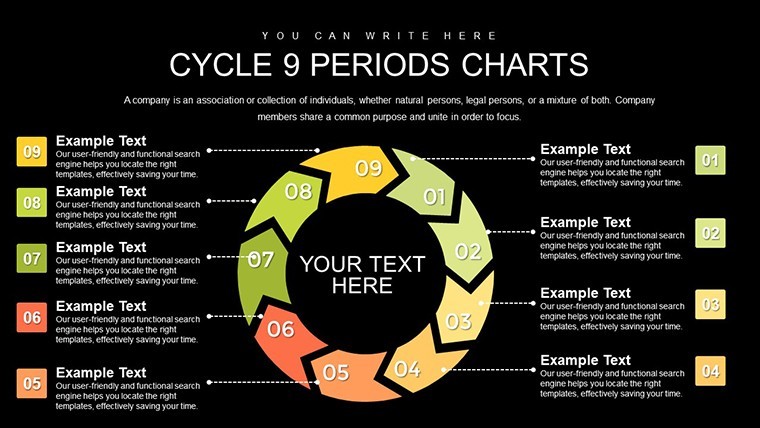
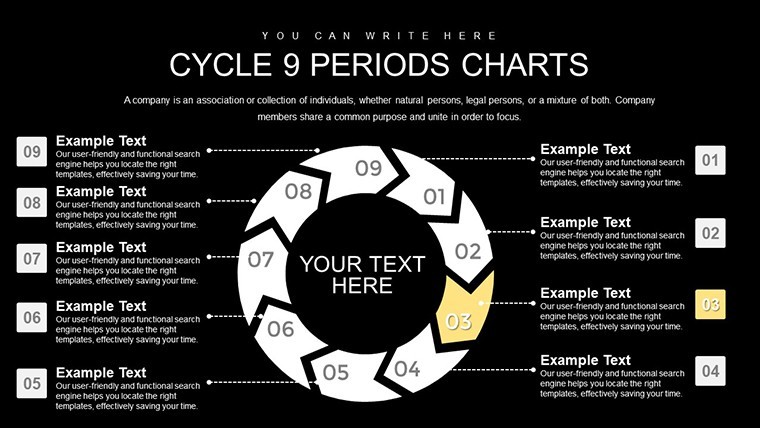
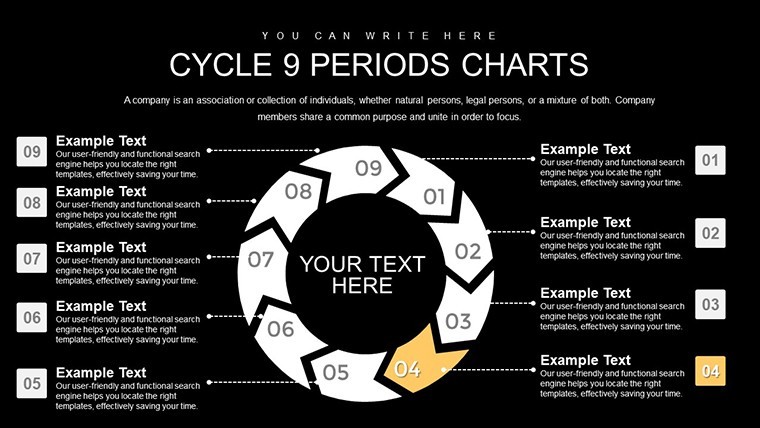
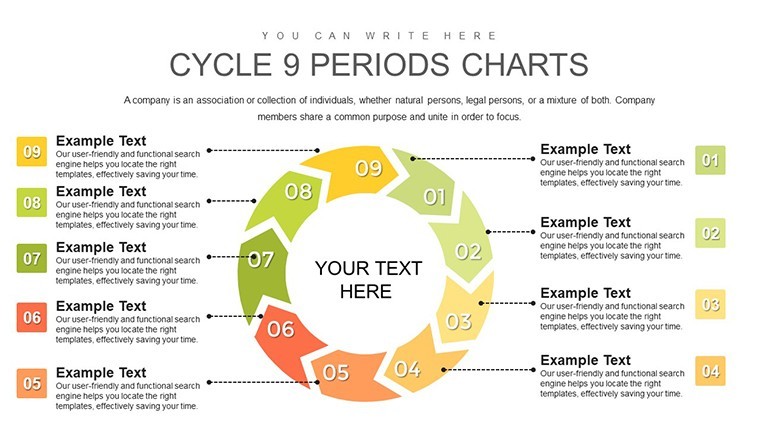
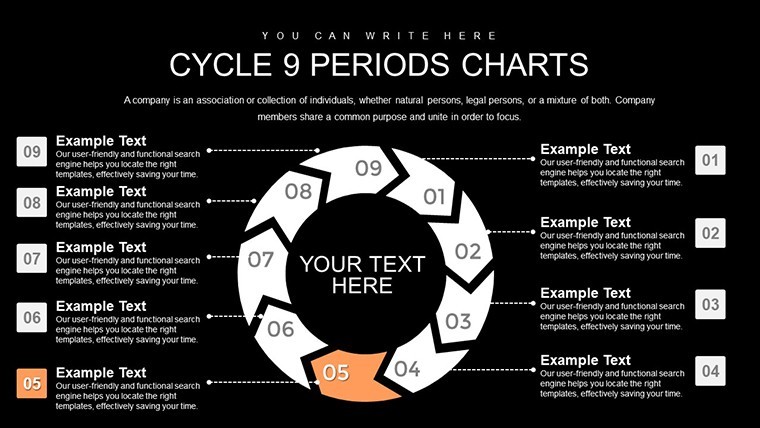
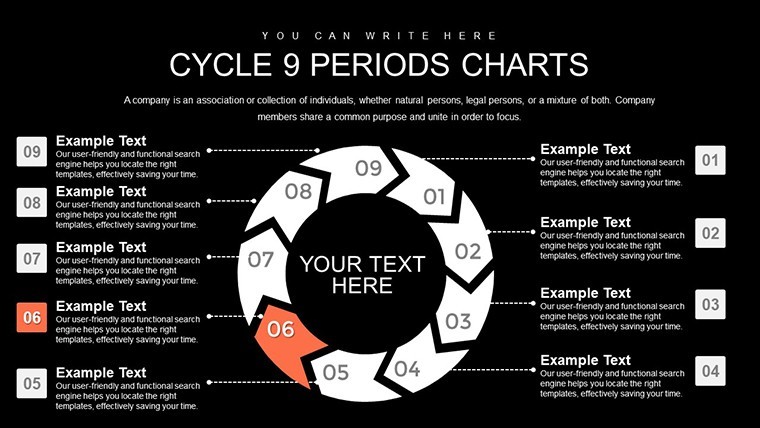
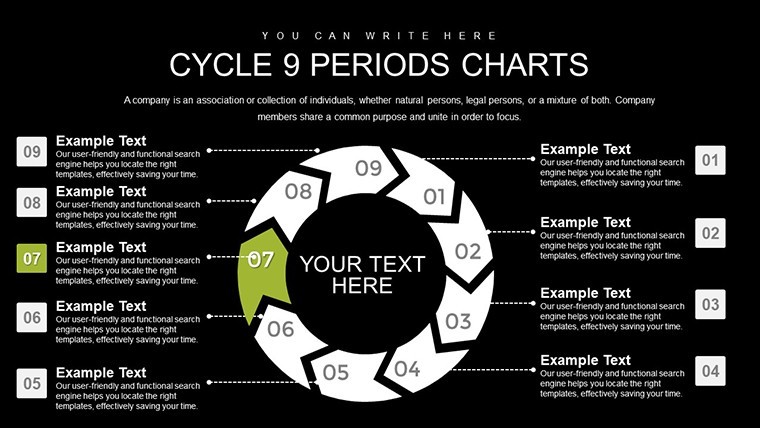
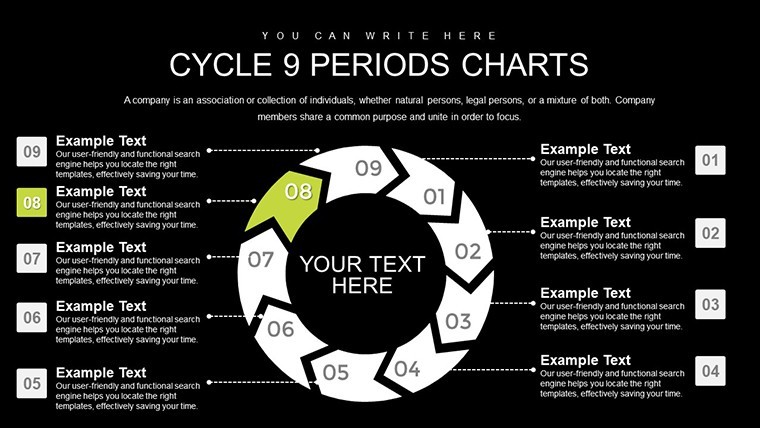
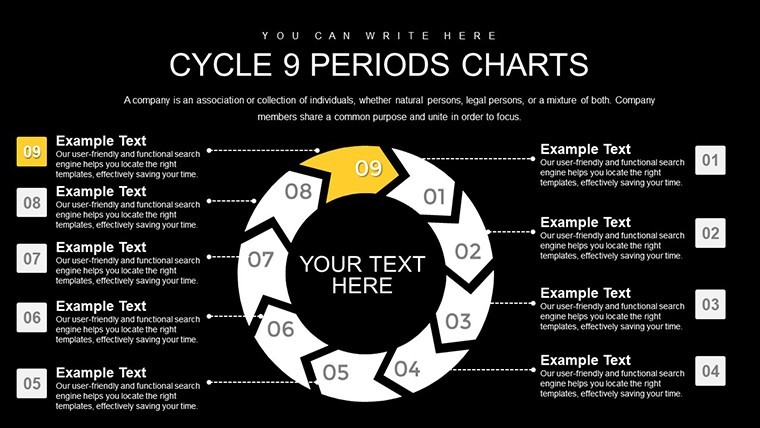
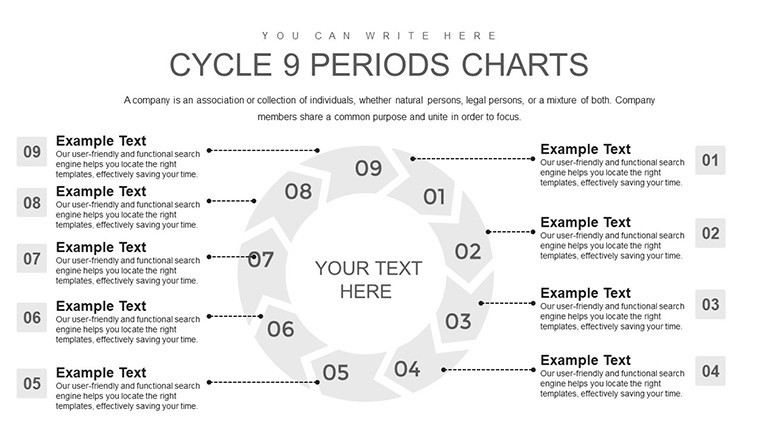
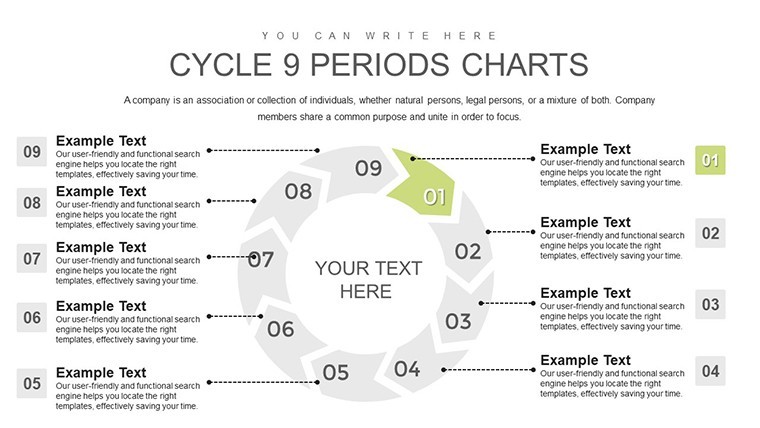
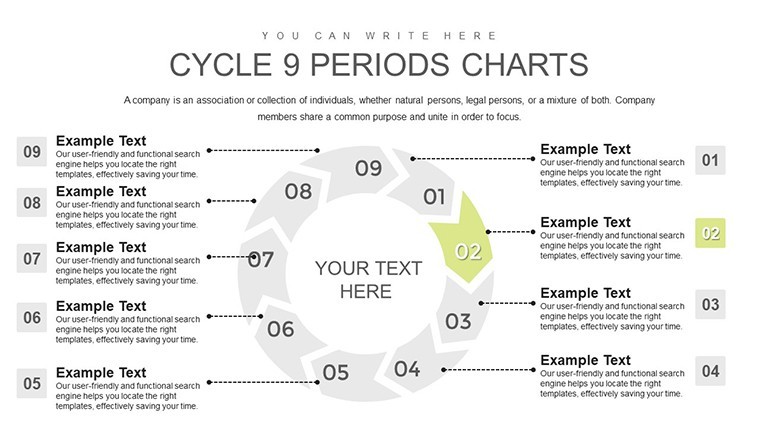
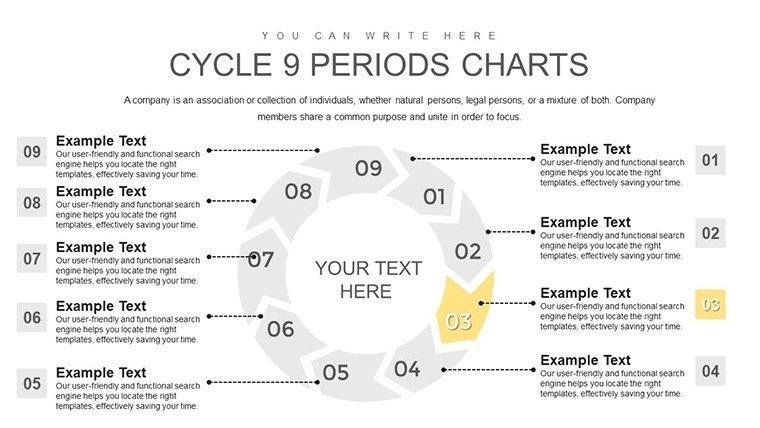
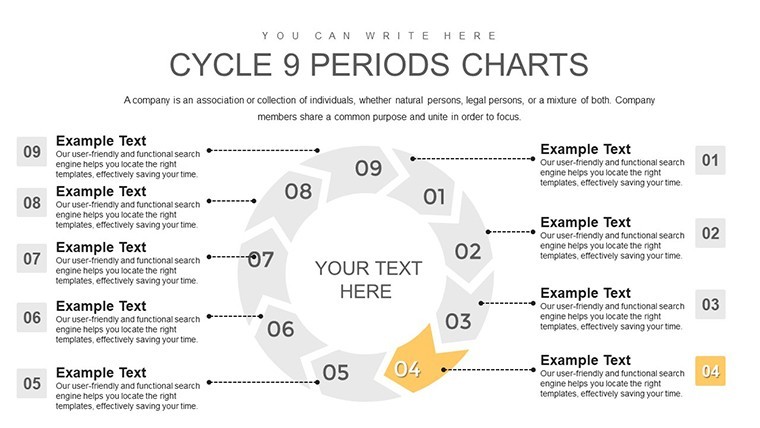
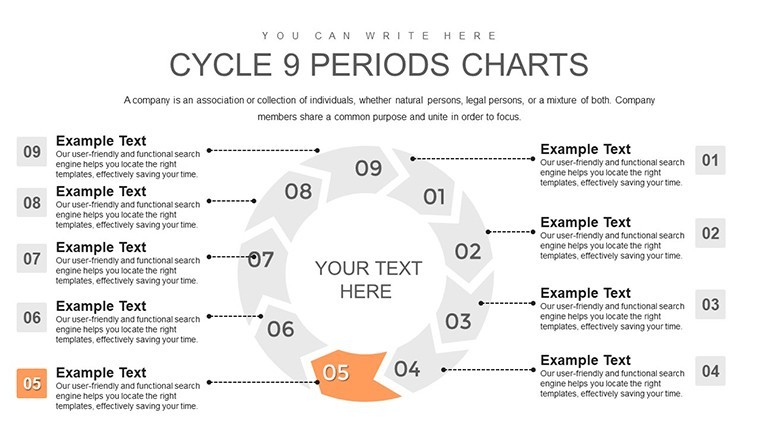
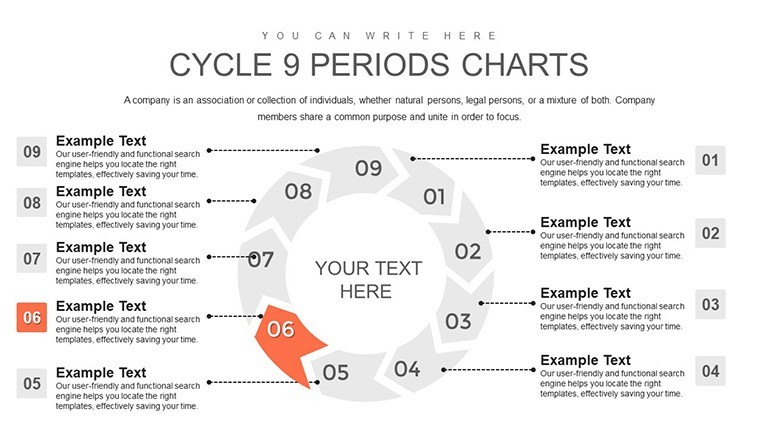
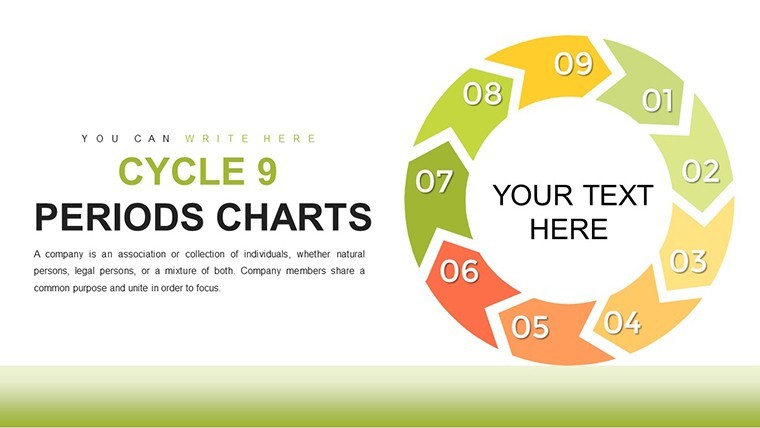
Architecture thrives on iteration - refining designs through multiple phases until perfection emerges. Our 9-Period Cycle Keynote Charts template empowers you to depict these loops with elegance, featuring 24 editable slides that turn abstract concepts into tangible, circular stories. Tailored for architects tackling everything from residential remodels to commercial skyscrapers, this tool highlights nine interconnected periods, such as feasibility studies, schematic designs, and value engineering rounds.
Envision presenting a net-zero energy building project: Use arrow formations to show how energy modeling data cycles through nine stages, revealing efficiencies and innovations. This not only aids in client buy-in but also complies with standards like those from the U.S. Green Building Council, demonstrating your expertise in sustainable practices.
Standout Features for Creative Professionals
Built for flexibility, each chart includes layered elements that adapt to your narrative. High-fidelity vectors ensure crisp prints for portfolio reviews, while Keynote compatibility guarantees smooth edits on Mac or iPad.
- Modular Arrow Designs: Resize and recolor to represent phases like site surveying or contractor bidding in nine-step sequences.
- Metric Embedding Tools: Insert data from spreadsheets or CAD exports, creating live-updating cycles for real-time project tracking.
- Branding Integration: Apply custom palettes inspired by architectural movements, from Brutalism's bold grays to Modernism's clean lines.
- Interactive Elements: Incorporate hyperlinks to external resources, like zoning laws, enhancing AIA continuing education sessions.
Drawing from authoritative sources like ArchDaily case studies, these features help avoid common pitfalls in data presentation, such as cluttered slides that dilute message impact.
Practical Use Cases Tailored to Design Workflows
In practice, apply this to urban revitalization efforts, where nine periods could outline community engagement cycles leading to adaptive heritage restorations. A real-world example: Firms like Foster + Partners use similar visuals in Olympic venue proposals, cycling through design, simulation, and stakeholder feedback.
For educators, it's a boon in teaching parametric architecture, breaking down algorithms into nine iterative loops. Internally, track firm metrics like proposal win rates over quarterly cycles, fostering data-driven culture shifts as recommended by McKinsey reports on design industry trends.
Easy Integration Guide
- Import the .key file into Keynote.
- Populate arrows with your nine periods - e.g., "Preliminary Sketches" to "Occupancy Certification."
- Tweak aesthetics to align with project themes, adding icons for elements like structural engineering.
- Test animations in rehearsal mode for fluid client pitches.
- Share via iCloud for collaborative edits among team members.
Unlike generic ring diagrams in standard software, our template provides depth with layered infographics, surpassing basic tools by offering architecture-specific adaptability.
Unlocking Value in Every Cycle
The true power lies in its ability to convey continuity, essential for long-term projects like airport expansions where nine-period cycles map regulatory approvals and phased constructions. Benefits include heightened engagement, as visuals reduce cognitive load, per cognitive psychology principles in design communication.
Weave in related concepts: These serve as enhanced process maps, iterative diagrams, or feedback loops for agile architecture methodologies. They're tools that build trust, showcasing your command over complex datasets in pitches or reports.
Step up your game - download these 9-period cycles now and craft presentations that inspire action.
Frequently Asked Questions
What level of customization do the charts offer?
Complete control over elements, from arrow shapes to data labels, perfect for architecture-specific adaptations.
Does it support data import from external sources?
Yes, easily integrate from Excel or BIM tools for accurate cycle representations.
Is this template suitable for team collaborations?
Absolutely, with Keynote's sharing features, it's ideal for multi-designer projects.
How many variations are included?
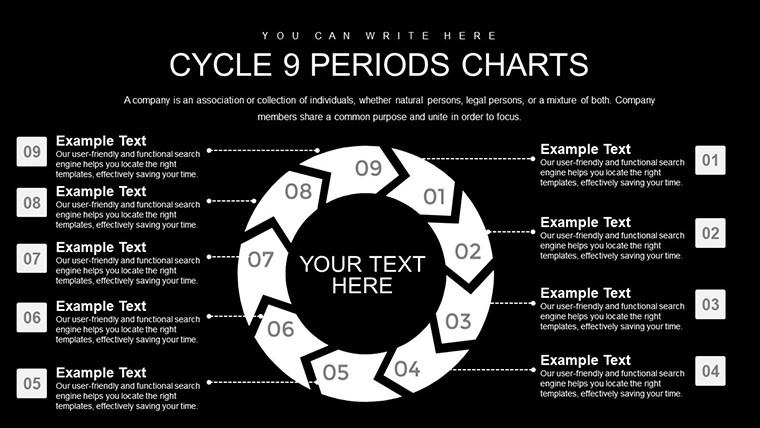
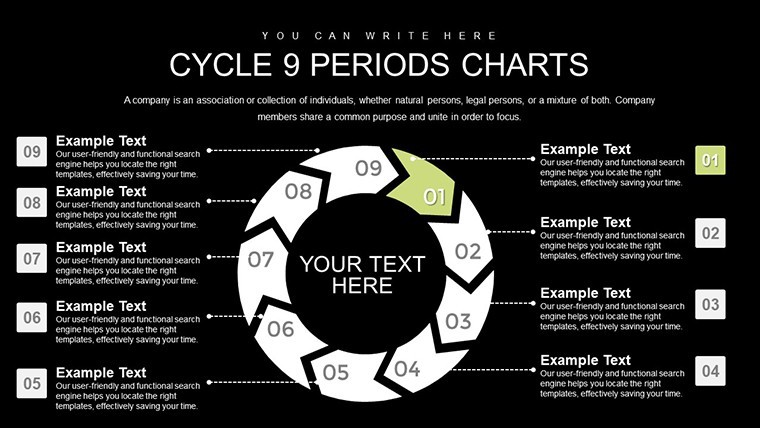
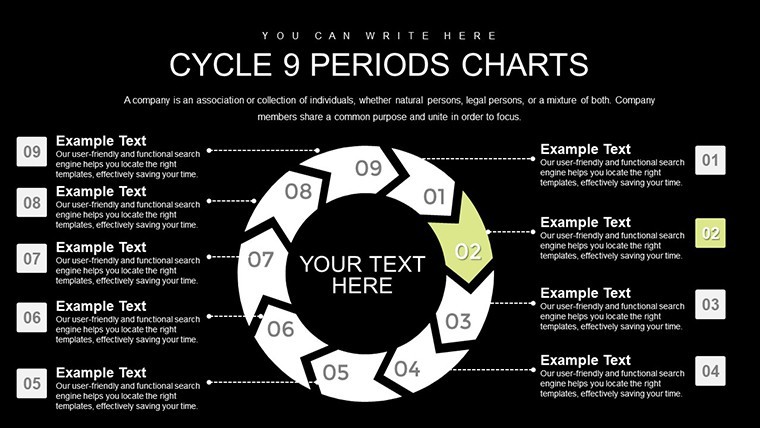
24 slides with diverse layouts for nine-period cycles.
Can animations be added easily?
Pre-set options allow quick enhancements for dynamic storytelling.
What's the file compatibility?
Optimized for Keynote, with exports to PDF or video for broader use.
Good for
- Project roadmaps and sprint plans
- Product launch timelines
- Quarterly or annual review decks
- Company history and milestone summaries
Licence
reviews
Made a quarterly review presentation with this and it looked organized enough.
The layouts helped because I had too much data and nowhere to put it.
I think a few charts were oversized but not a huge problem.
Good for quick edits when you are rushing before a meeting.
I liked the clean graph sections more than the title slides.
FAQ
Will it work in Google Slides?
Are fonts embedded?
Can I use this for client work?
What's the refund policy?
Do you update the template after purchase?
Similar templates
See all Keynote Charts →
All 24 slides