 Click to zoom
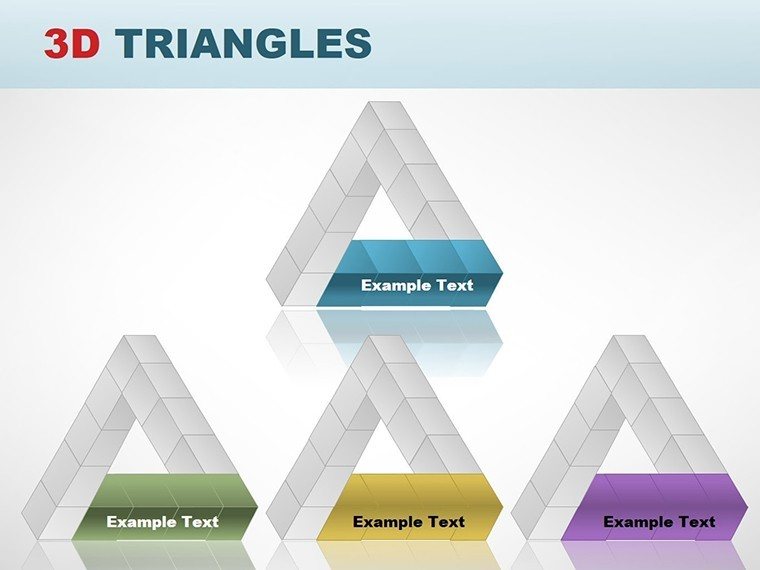
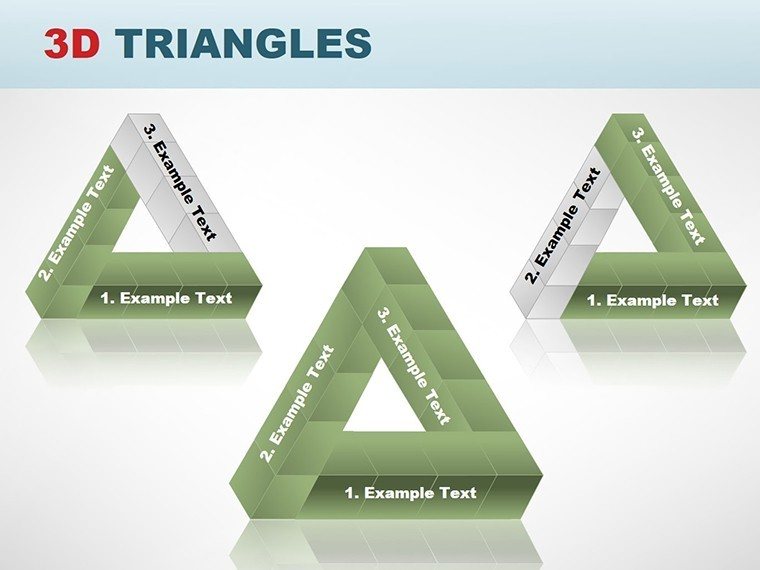
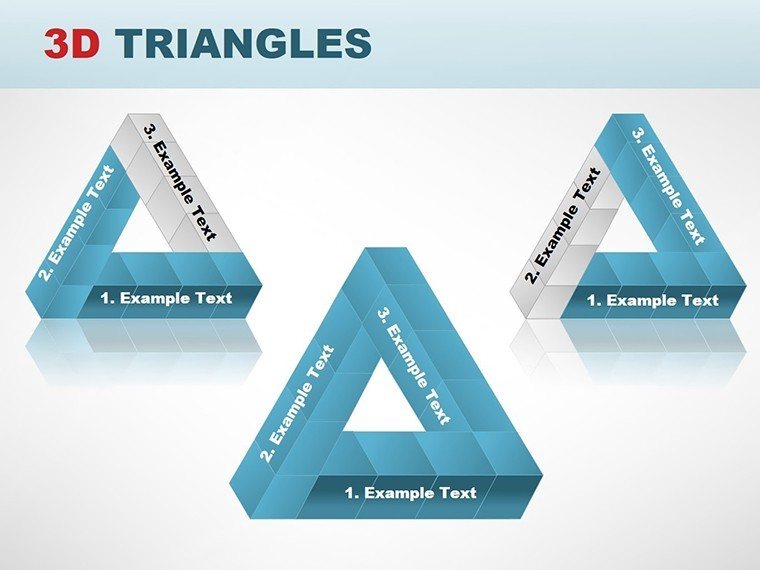
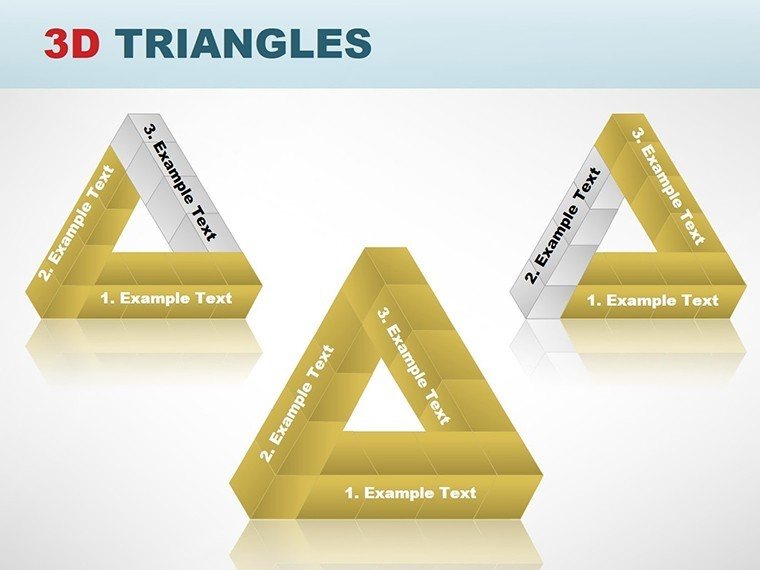
3D Triangles Cubes PowerPoint Charts Template for Immersive Architecture
| Format | .pptx |
| Slides | 18 unique layouts |
| Aspect ratio | 16:9 |
| Compatibility | PowerPoint |
| Animated | No |
| Language | English |
| License | Commercial |
| File size | — |
| Version | v1.0 |
| Last updated | August 2023 |
What's inside
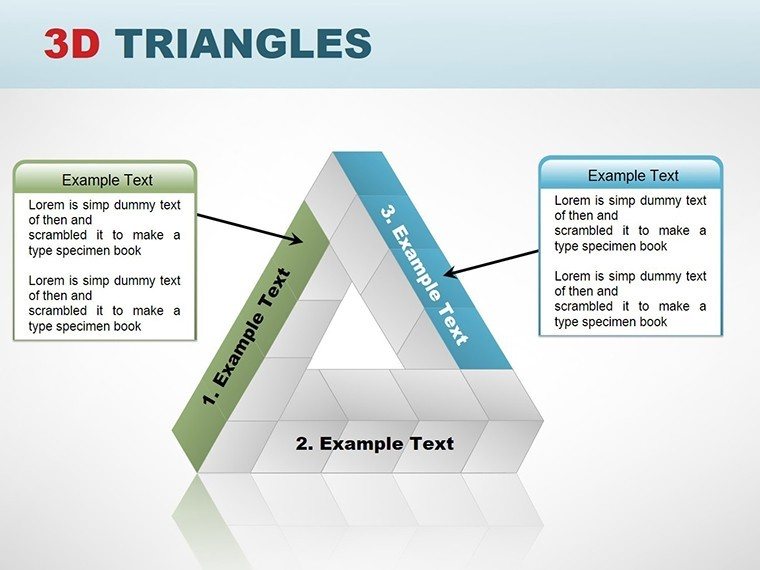
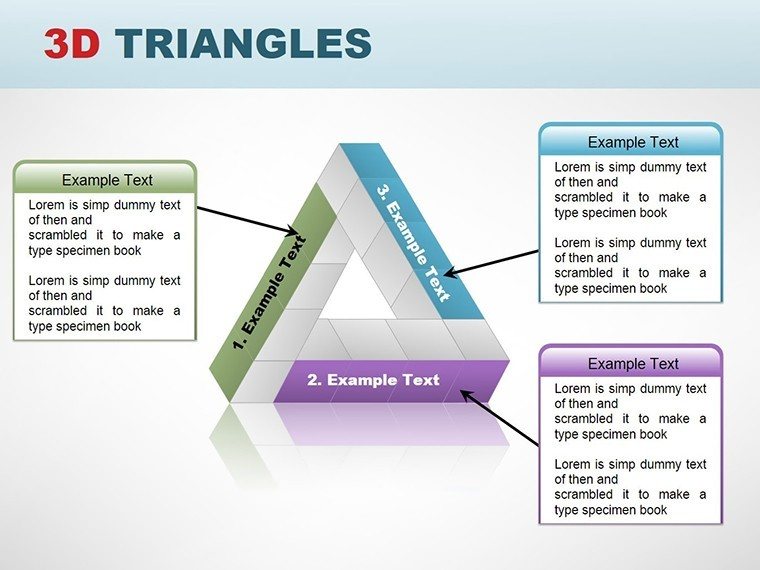
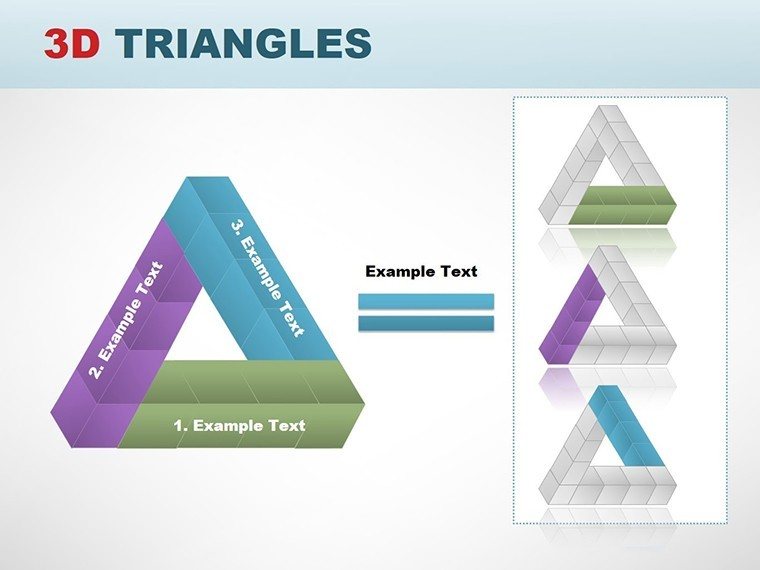
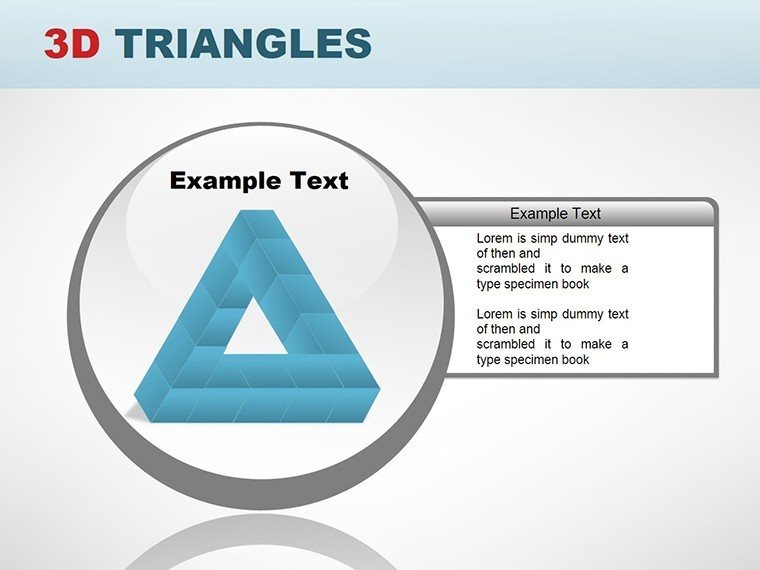
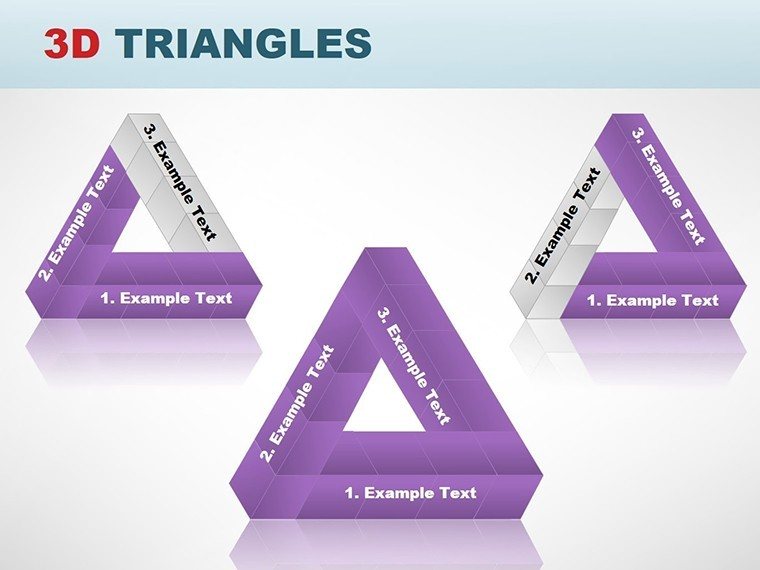
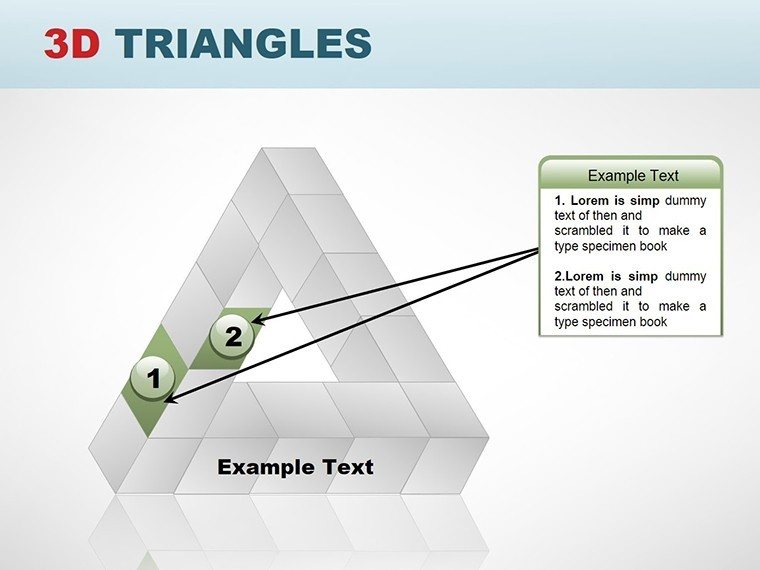
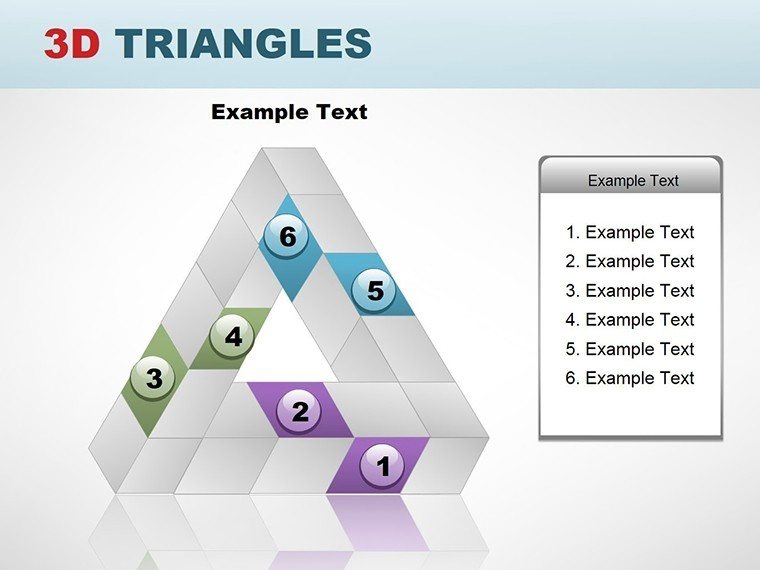
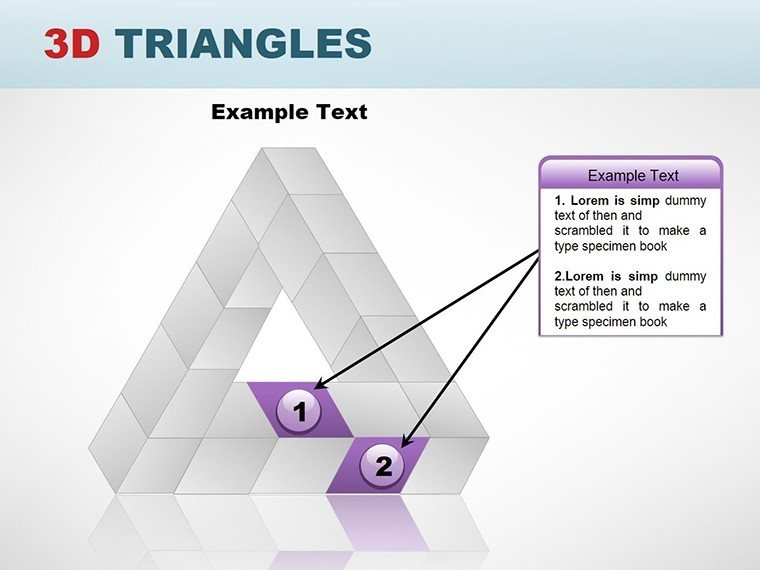
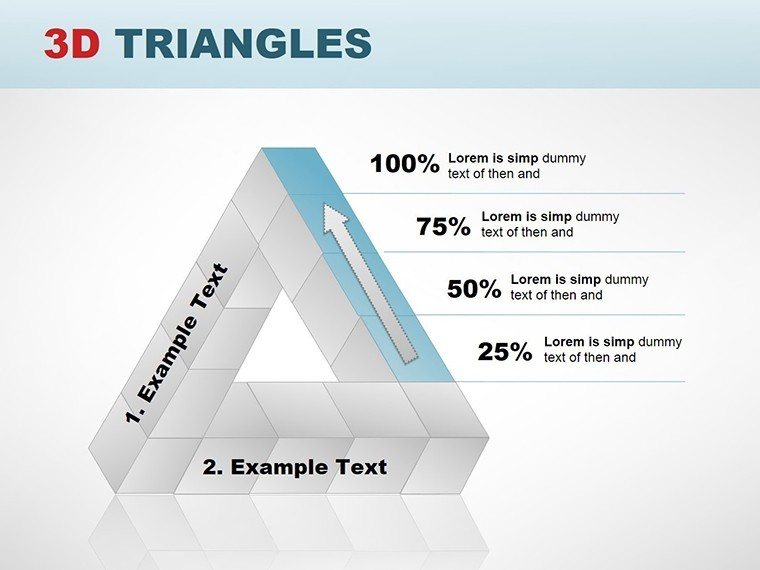
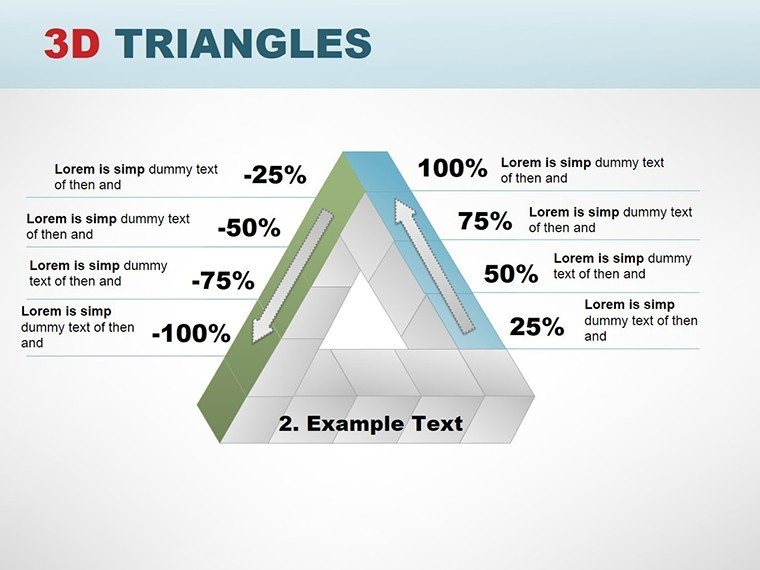
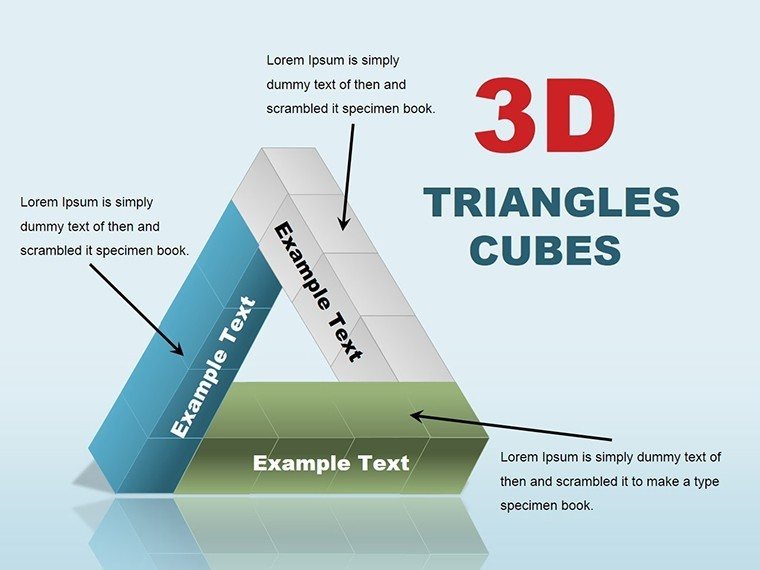
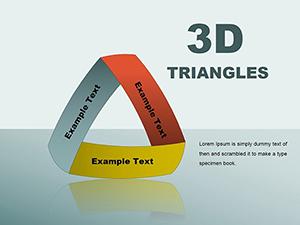
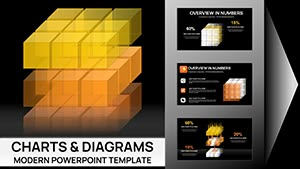
In architecture, where form meets function in three dimensions, conveying depth on a flat screen can be a challenge. Our 3D Triangles Cubes PowerPoint charts template rises to meet it, with slides that bring volumetric visions to life. Tailored for architects crafting everything from modular homes to urban landscapes, this template features intricate 3D elements that add perspective and intrigue. With 15+ editable slides (based on thumbnails), you can simulate spatial relationships, making abstract concepts concrete. Aligned with AIA's emphasis on innovative representation, it helps you present sustainable models or structural analyses with flair, turning routine reviews into engaging explorations. Say goodbye to flat diagrams; hello to cubes that pop and triangles that triangulate ideas seamlessly.
Crafting Depth in Design Presentations
Think of unveiling a pavilion design inspired by Bucky Fuller's geodesics: Use cube clusters to model the framework, with triangles faceting the surfaces for a realistic preview. This template's 3D rendering capabilities allow you to rotate views virtually, helping clients visualize from multiple angles without physical models. Begin with the master slide, a dynamic cube assembly that sets the stage for your project's core geometry.
From there, explore specialized charts: Stack cubes for volume calculations in high-density developments, or interlock triangles for truss systems in bridges. Each element is vector-based for sharp scaling, ensuring clarity even on large screens during conferences.
Standout Features for 3D Mastery
Developed with input from seasoned architects, key highlights include:
- Perspective-Enhancing 3D Tools: Apply shadows and gradients for realistic depth, essential for shadowing studies in site planning.
- Intuitive Customization: Resize, rotate, or recolor cubes and triangles with ease, integrating firm-specific textures like brick or glass.
- Data-Driven Dynamics: Link to metrics for load-bearing visuals, where cube sizes represent stress points.
- Broad Compatibility: Works flawlessly in PowerPoint and Google Slides, supporting hybrid teams.
- Inclusive Design Options: High-contrast modes for accessibility, per modern standards.
Versus basic tools, this offers superior immersion, akin to how parametric design software revolutionized workflows.
Practical Integrations and Case Studies
For a mixed-use tower pitch, deploy slide 4's cube matrix to layer functions - retail at base, residences above. Animate triangles to show solar panel orientations, demonstrating energy efficiency. In academic contexts, use for teaching tensegrity principles, with cubes as compression elements.
Workflow tip: Import from Rhino or BIM software, overlay 3D charts for annotated insights. A real example? Model the Sydney Opera House's sails as triangular cubes, illustrating Jørn Utzon's innovative geometry.
Navigating Architectural Complexities
Address pain points like client misconceptions with rotatable views that clarify scales. For international projects, adapt cubes to modular prefab systems, highlighting assembly efficiencies.
Rooted in authoritative practices from the American Institute of Architects, this template ensures your presentations are both artistic and analytical. Ready to add dimension to your designs? Explore these 3D charts and build visions that stand tall.
Frequently Asked Questions
How do I rotate the 3D elements? Use PowerPoint's built-in rotation handles for interactive adjustments.
Can I import 3D models? Yes, embed OBJ files or images for enhanced realism.
Compatible with older PowerPoint versions? Optimized for 2016+, with fallbacks for earlier.
Are animations pre-set? Yes, with options to customize for smooth transitions.
Suitable for virtual reality previews? Export slides for VR tools to extend immersion.
Good for
- Project roadmaps and sprint plans
- Product launch timelines
- Quarterly or annual review decks
- Company history and milestone summaries
Licence
reviews
Those gauge charts are nice for KPI dashboards.
Had to adjust the legend sizes but overall easy to use.
Used it for an ops review and the team didn't complain so that's a win.
The chart data is linked to an Excel sheet? That actually worked fine.
A bit basic but for a free download (I think) it's worth it.
FAQ
Will it work in Google Slides?
Are fonts embedded?
Can I use this for client work?
What's the refund policy?
Do you update the template after purchase?
Similar templates
See all PowerPoint Charts →
All 18 slides