 Click to zoom
30 3D Pie Keynote Charts - Editable .key File | ImagineLayout
| Format | .pptx |
| Slides | 30 unique layouts |
| Aspect ratio | 130/73 |
| Compatibility | PowerPoint |
| Animated | No |
| Language | English |
| License | Commercial |
| File size | — |
| Version | v1.0 |
| Last updated | April 2026 |
What's inside
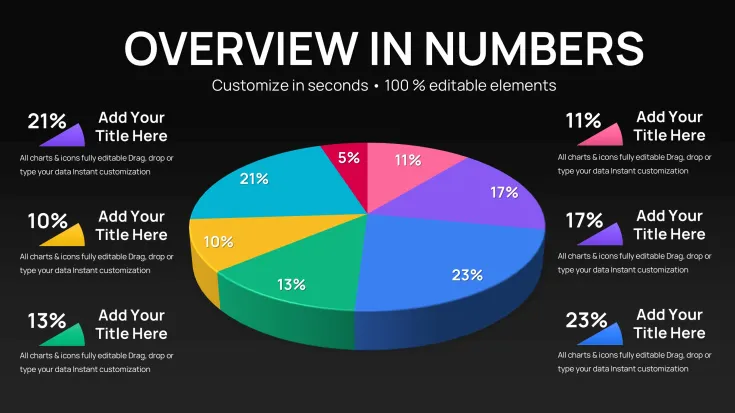
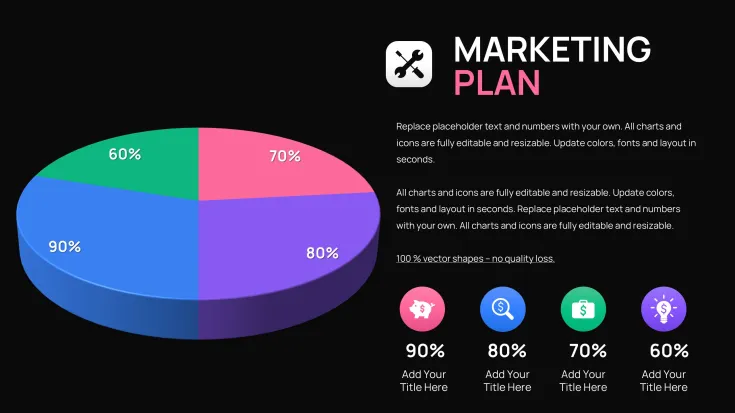
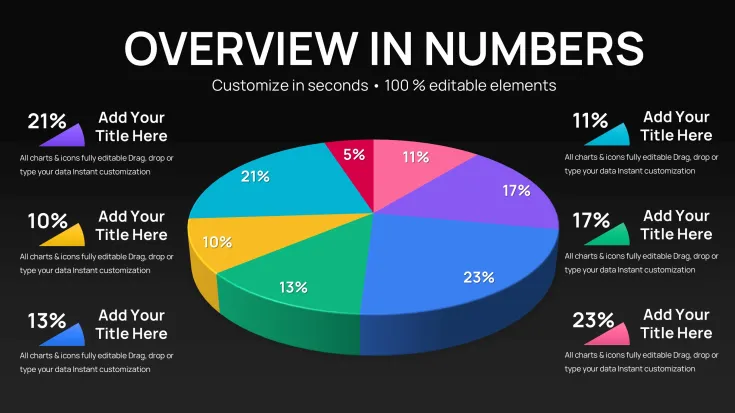
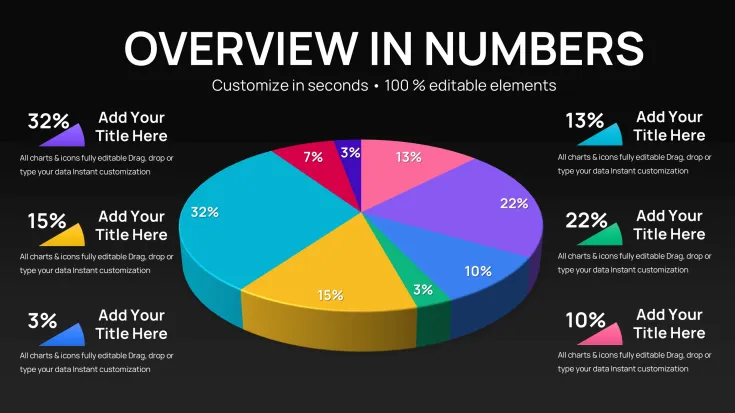
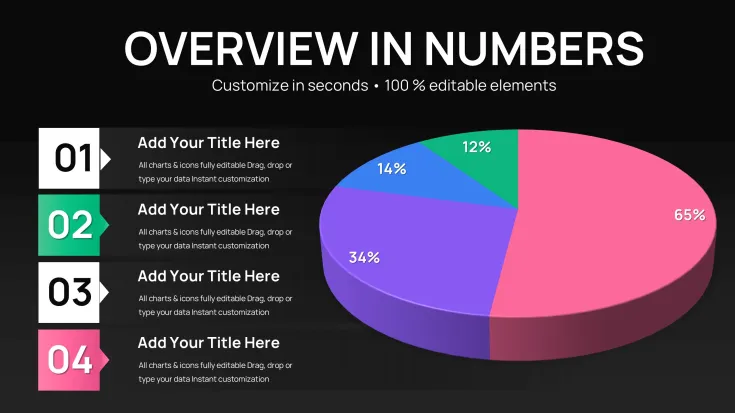
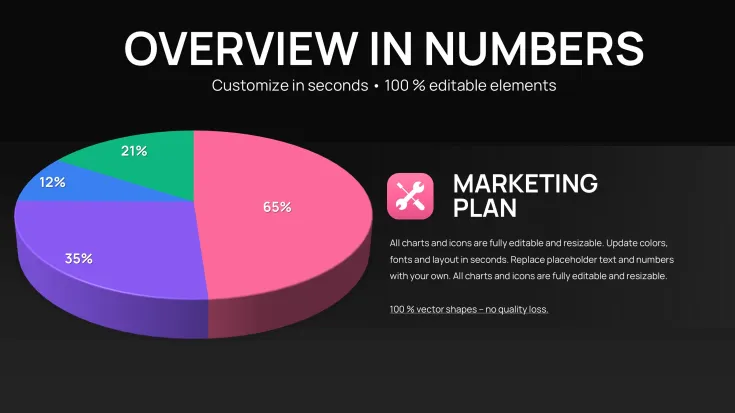
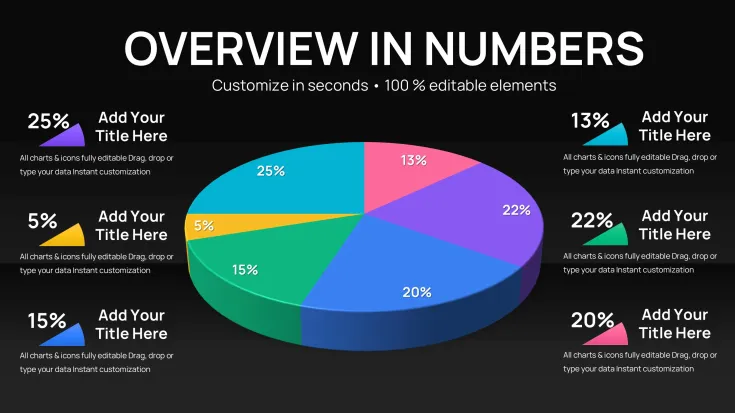
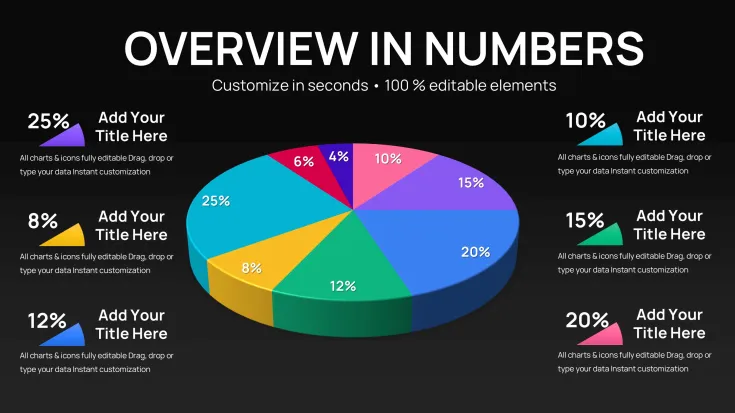
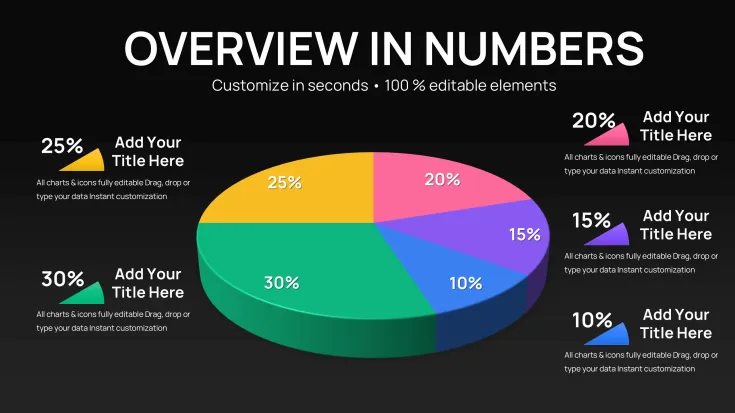
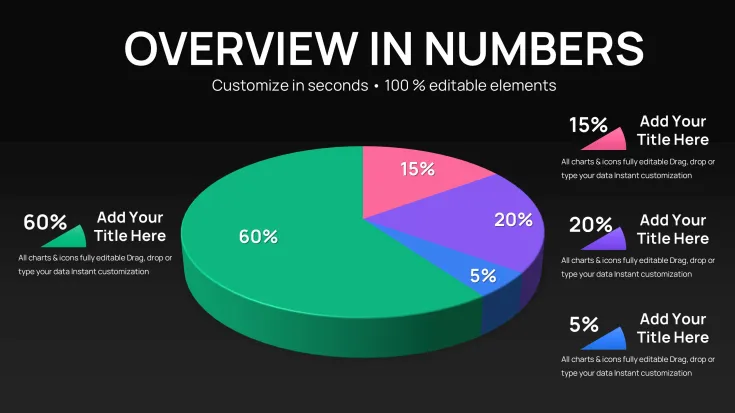
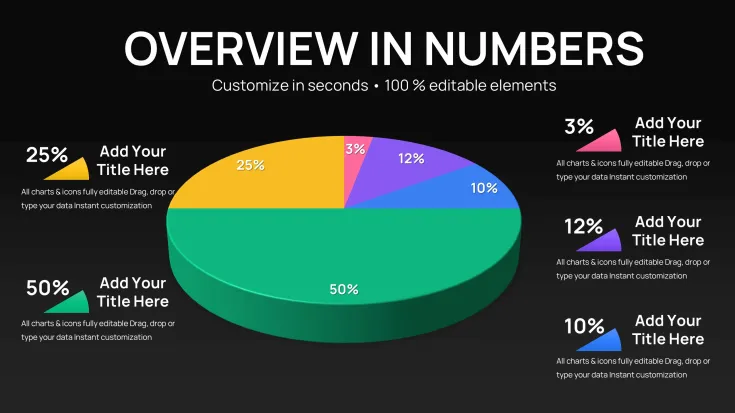
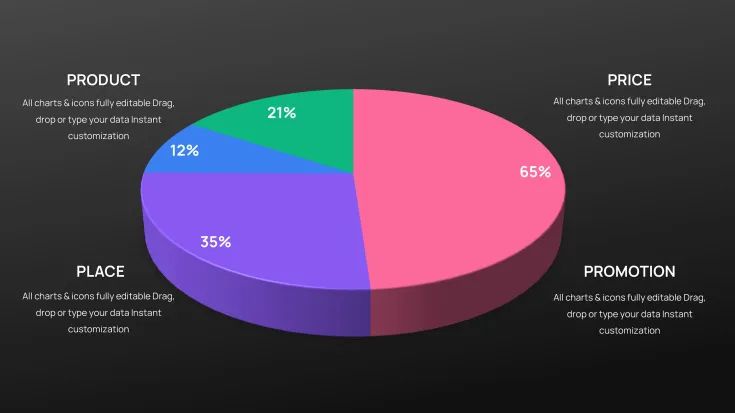
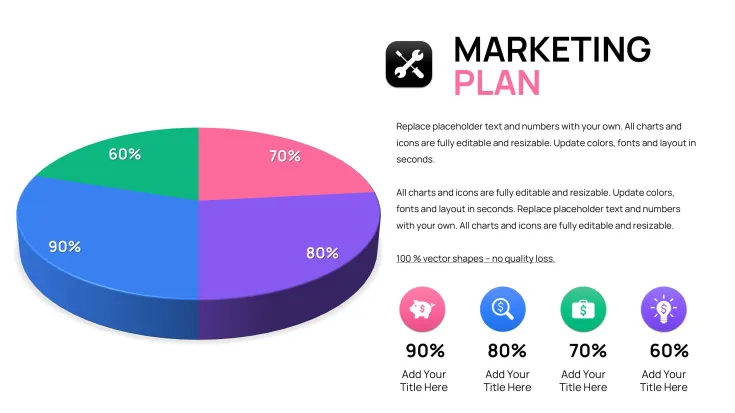
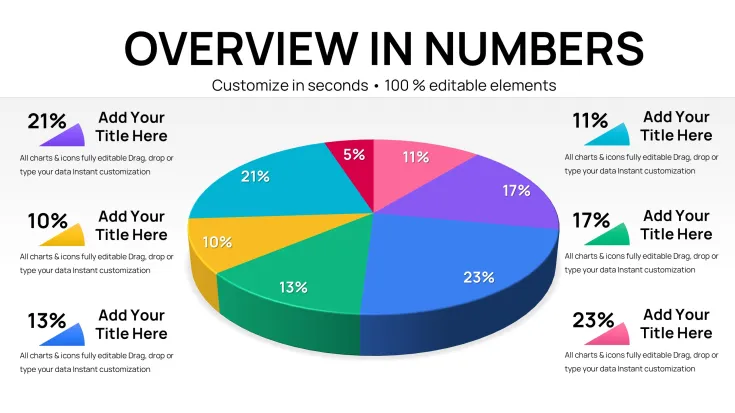
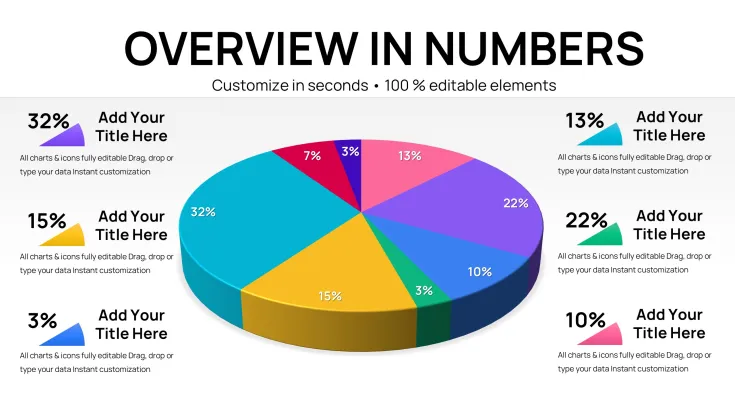
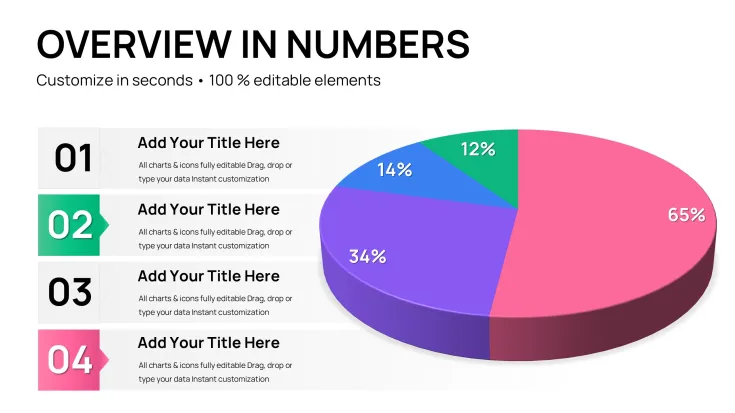
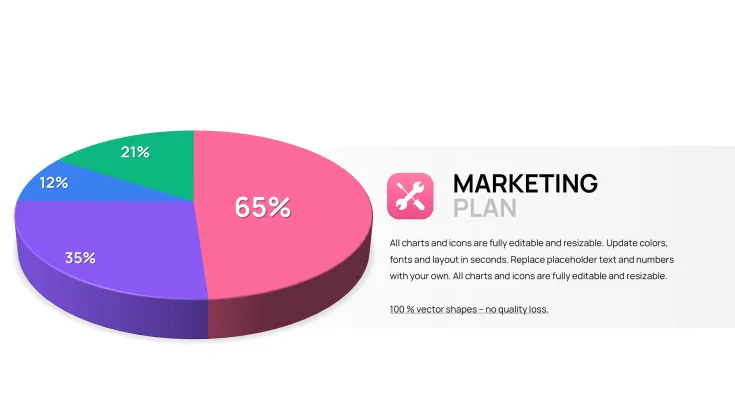
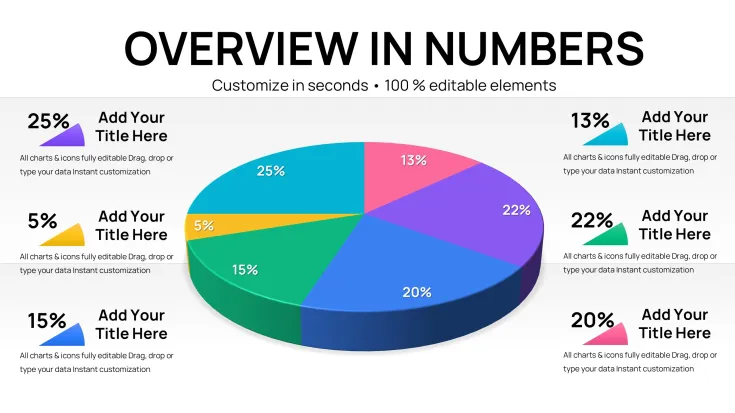
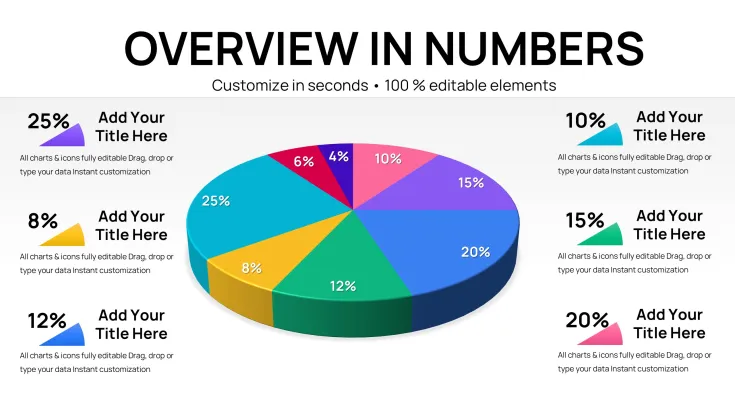
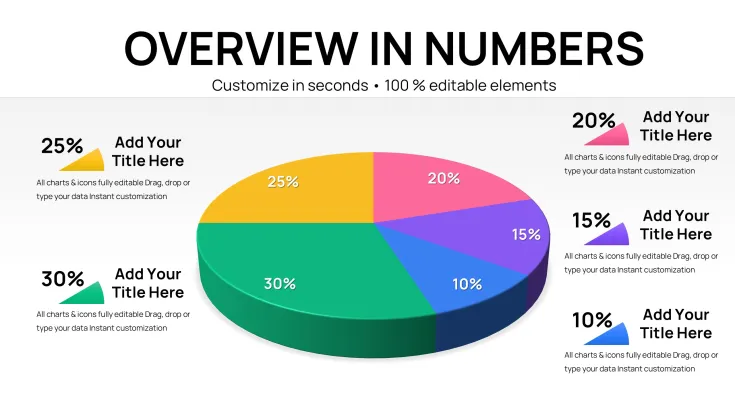
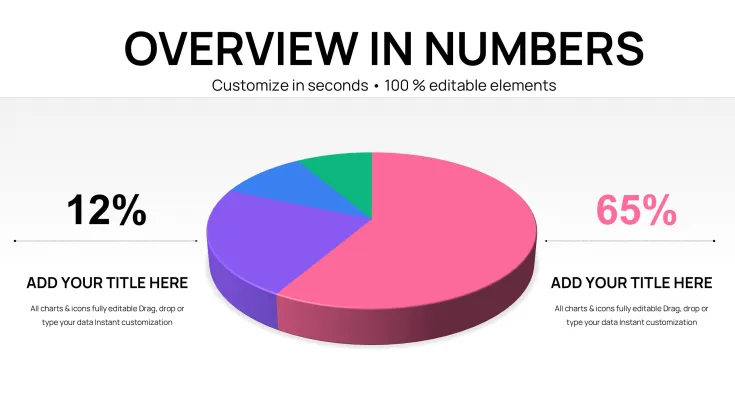
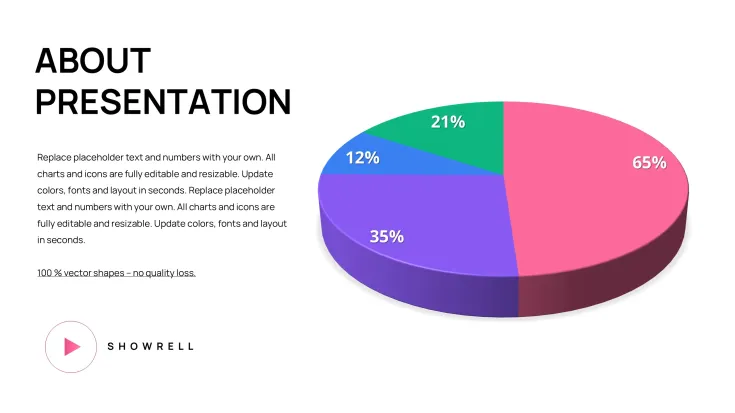
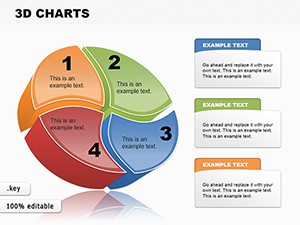
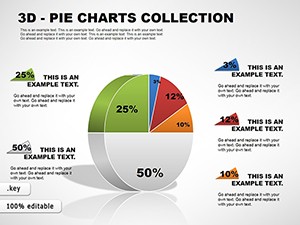
30 Editable 3D Pie Charts in Keynote
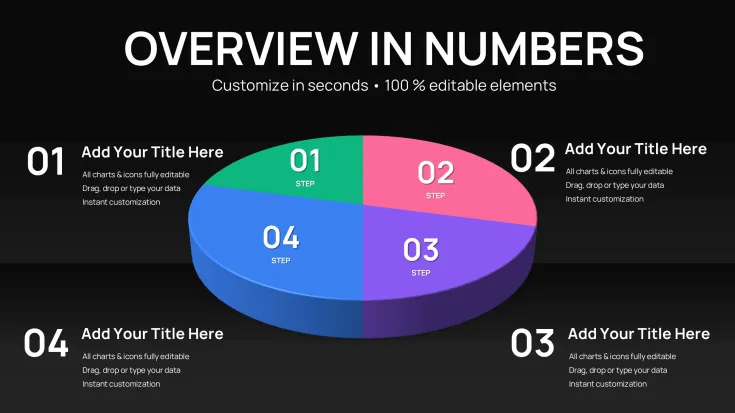
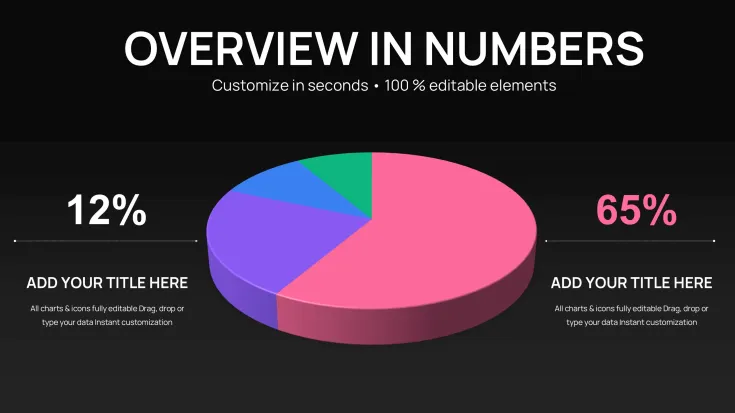
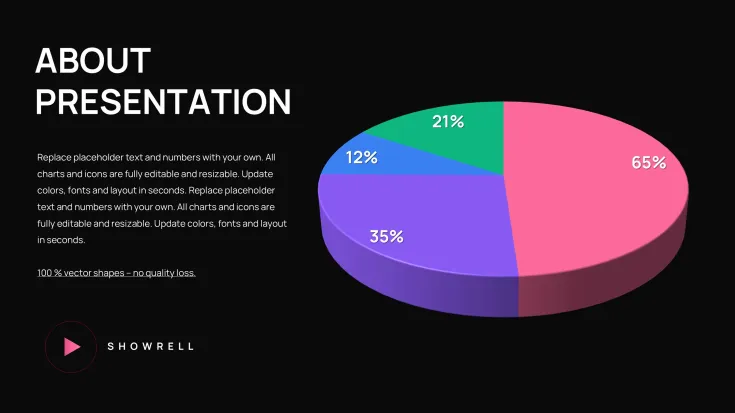
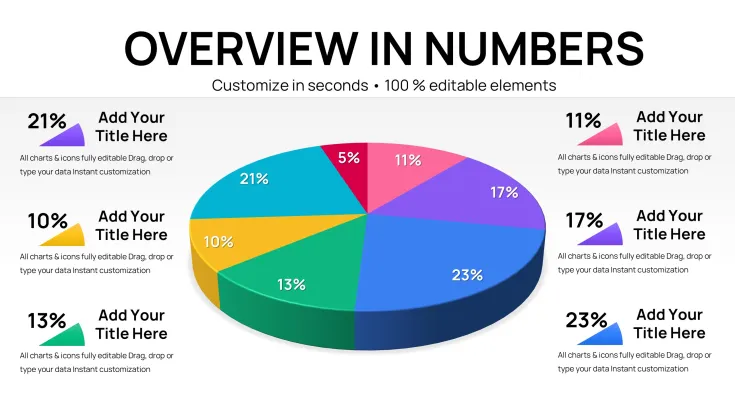
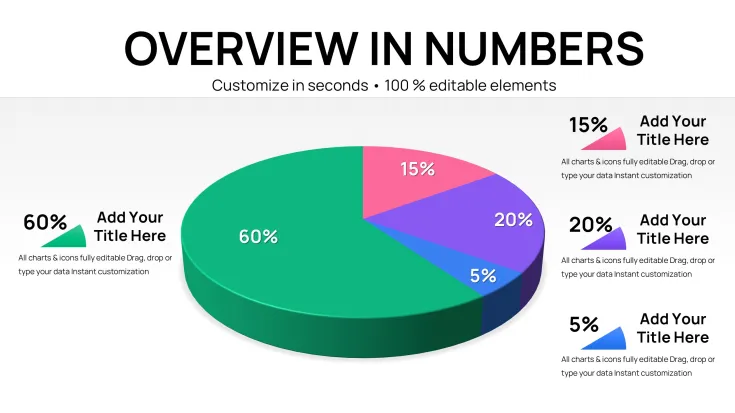
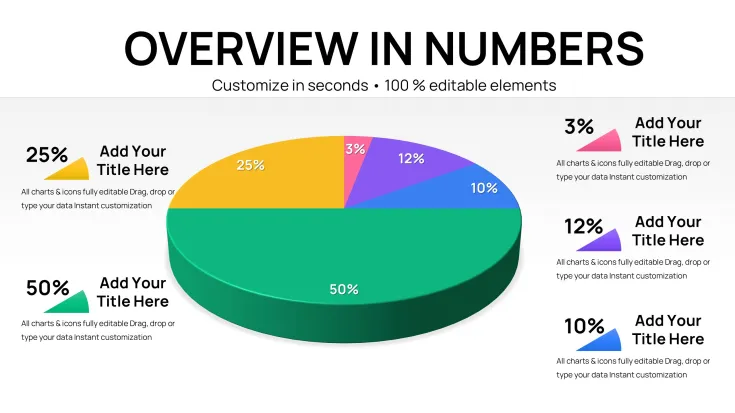
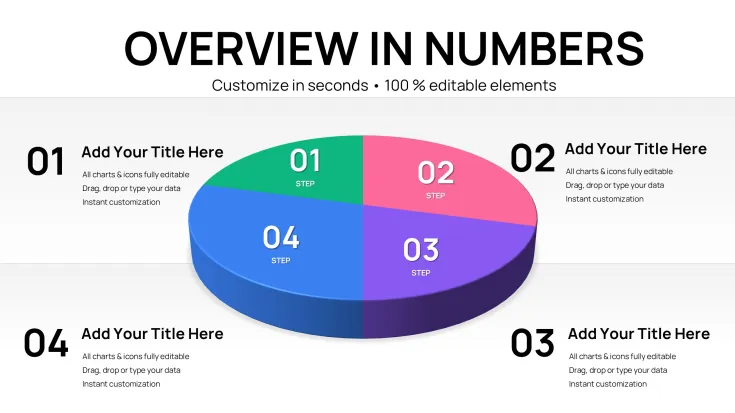
The .key file packs 30 editable 3D pie chart slides that let you visualize category proportions for stakeholder meetings without manual shape alignment.
No complex layouts, just structured blocks.
In practice you drop your percentage data into the prebuilt radial structures and the 3D depth remains consistent across the entire deck which saves hours instead of building from scratch each quarter while keeping every segment label and extrusion layer fully independent.
The extrusion on each slice gives clear visual separation for data that fits category breakdowns.
When you need to explain revenue shares to executives the radial 3D structures handle the breakdown out of the box.
Typically teams reuse the same diagram across weekly reports.
This suits financial analysts who present proportion data in internal reporting.
The diagrams support proportional analysis so you see exactly how each category contributes to the total after filling the numbers you can decide which area deserves more resources in your next strategy session.
It works best for structured diagrams with 3 to 8 categories not ideal for creative storytelling slides.
Skip this template if your slides require timeline elements instead of clear share visuals.
You update colors via the slide master so the whole deck stays consistent in under two minutes.
Use this instead of building diagrams manually in Keynote the predefined structure keeps everything aligned so you don`t end up adjusting spacing slide by slide.
In most cases you only replace text and adjust colors.
Check the full pie Keynote charts templates or the related 36-slide 3D pie set for more options.
You open the file and start editing.
Download and start editing immediately
FeatureDetailsSlides / diagrams30 editable 3D pie chartsFile format.keySoftware versionKeynote 12 or laterColor schemesSwitch via slide masterEditable elementsSegments labels and extrusion layers resize and recolor independentlyAspect ratioStandard 16:9Free vs PaidPaid includes full editable .key file free limited to watermarked JPG previewsMasters / BackgroundsPrebuilt masters in one .key fileHow do I change colors via slide master in Keynote?Open your .key file in Keynote 12 or later and switch to slide master view. Select the master layout that contains the pie charts and adjust the fill colors for each segment and extrusion layer. This updates the entire set of 30 slides at once in most cases so you avoid manual tweaks on individual pages.
Can I use this template for client work?Yes you can use this template for client work and deliver the final presentation to them. The license allows commercial use in your own decks as long as you do not resell or redistribute the original .key file itself. Contact support if your project involves multiple team members under one license.
What is the difference between free and paid versions?The free version includes only watermarked JPG previews. Paid version delivers the full 30-slide editable .key file with independent 3D elements ready for your data. The paid file lets you edit every segment label and extrusion layer directly in Keynote.
What are the refund conditions?Refunds are offered within 14 days if the template does not open correctly in your Keynote version. You must provide the purchase receipt and details about the compatibility issue before processing. This applies only to technical problems with the .key file itself.
What Keynote version and macOS is required?This template requires Keynote 12 or later running on macOS. It works on the latest macOS versions and maintains full 3D effects there. Older Keynote installations may show limited extrusion depth.
Good for
- Project roadmaps and sprint plans
- Product launch timelines
- Quarterly or annual review decks
- Company history and milestone summaries
Licence
reviews
30 3D pie charts with clean extrusion layers helped my stakeholder meeting go smoothly. Dropped in percentages and everything stayed aligned. Good for revenue shares but feels repetitive after a few slides.
Financial analyst here - the radial 3D structures are solid for category breakdowns. Updating via master is fast. Not ideal for creative storytelling but perfect for internal structured reports. Saved me from building manually.
The independent extrusion on slices gives nice visual separation. Used for executive proportion visuals. Practical and consistent across the 30 slides, though some layouts are very basic.
Deadline-pressured consultant: opened the file, swapped data, done in under an hour. The 3D depth works well for market share. A bit plain design-wise but reliable.
Student using for group project - the 30 slides offered enough variety for different breakdowns. Colors switch easily. Feels professional enough for class presentations.
The template keeps everything aligned when editing multiple pies. Good for weekly reports with 3-8 categories. Slightly critical of limited creative flair but does the job efficiently.
FAQ
Will it work in Google Slides?
Are fonts embedded?
Can I use this for client work?
What's the refund policy?
Do you update the template after purchase?
Similar templates
See all Keynote Charts →
All 30 slides