 Click to zoom
3-D Pie PowerPoint Charts - Fully Editable Ready for Board Meetings
| Format | .pptx |
| Slides | 29 unique layouts |
| Aspect ratio | 130/73 |
| Compatibility | PowerPoint |
| Animated | No |
| Language | English |
| License | Commercial |
| File size | — |
| Version | v1.0 |
| Last updated | April 2026 |
What's inside
Package Contents
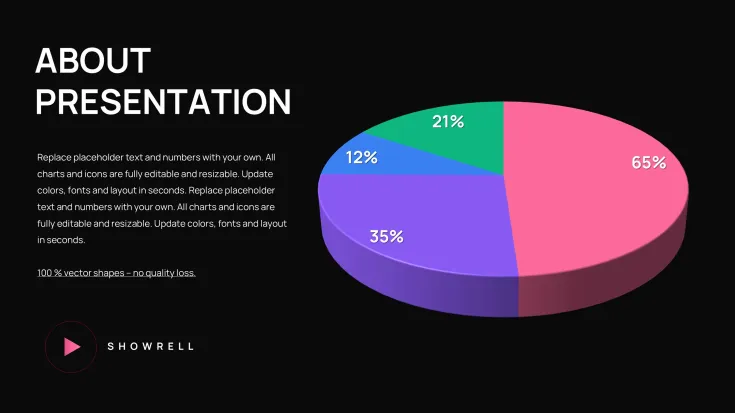
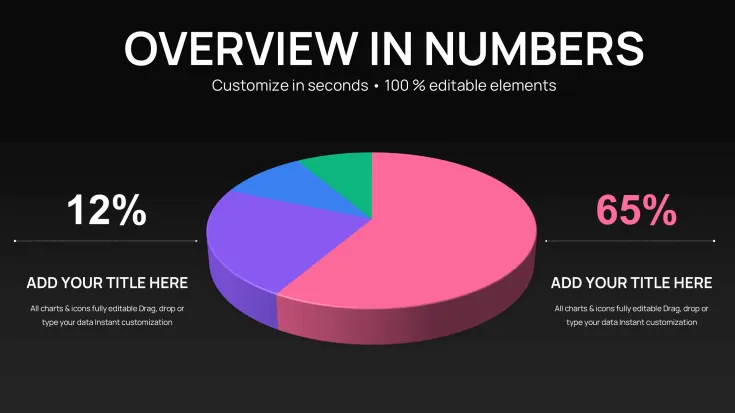
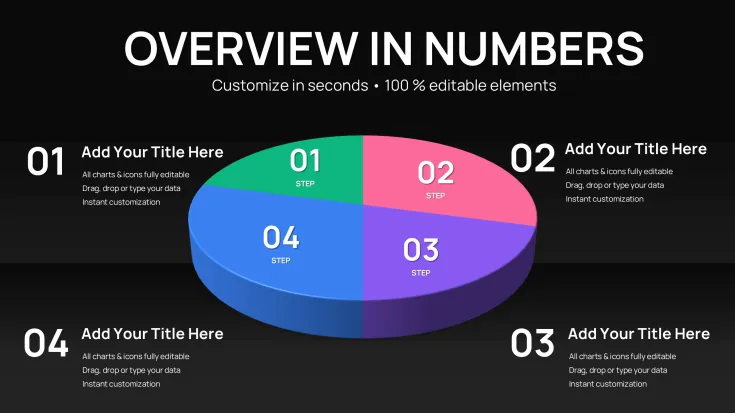
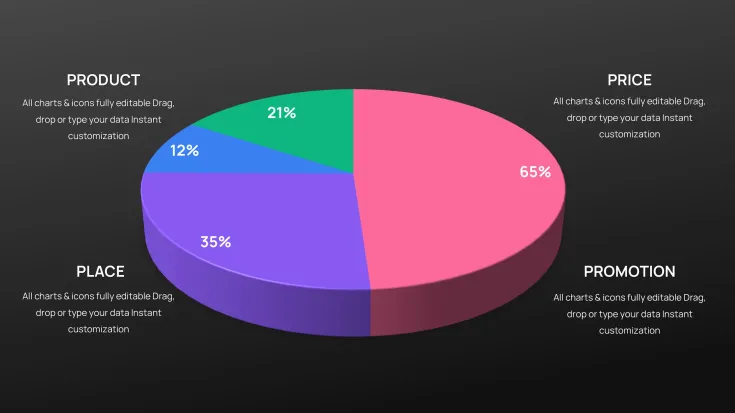
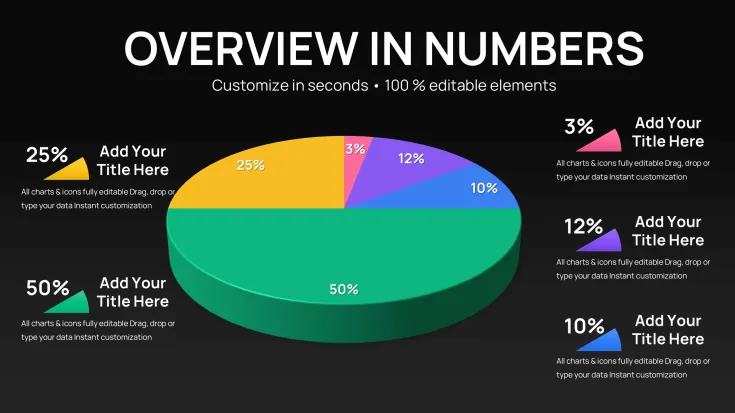
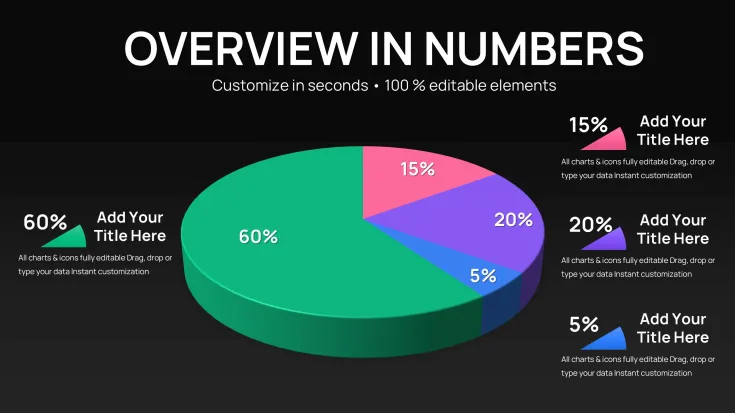
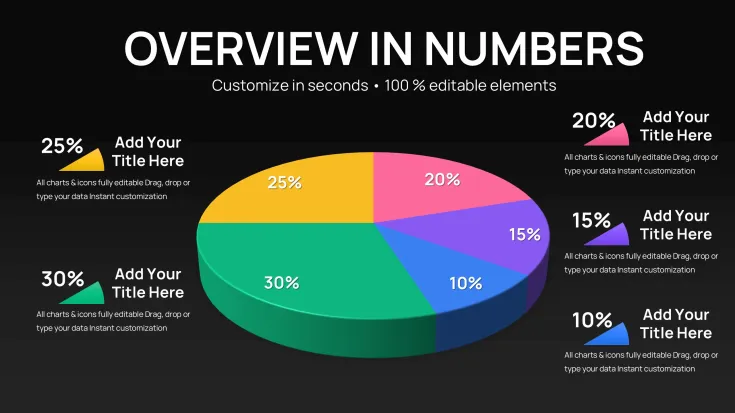
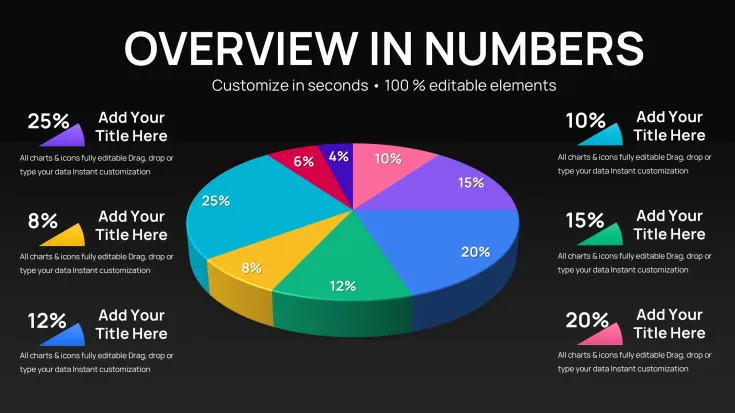
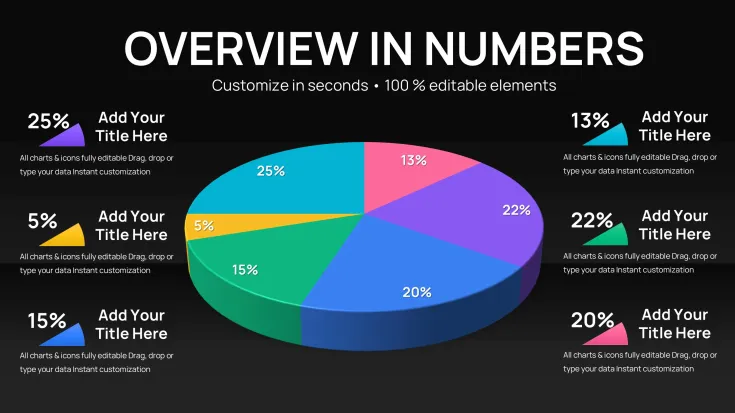
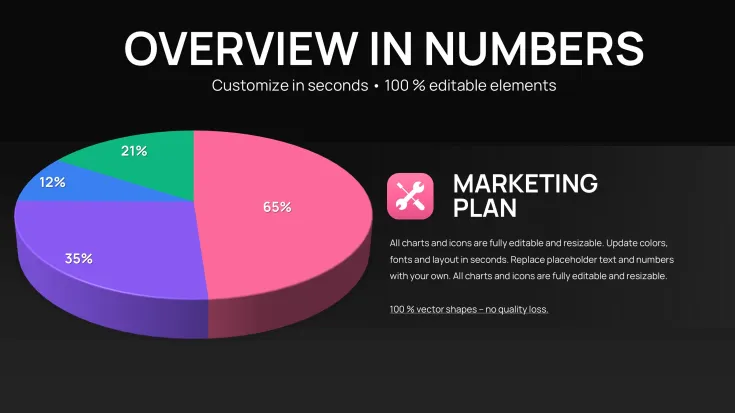
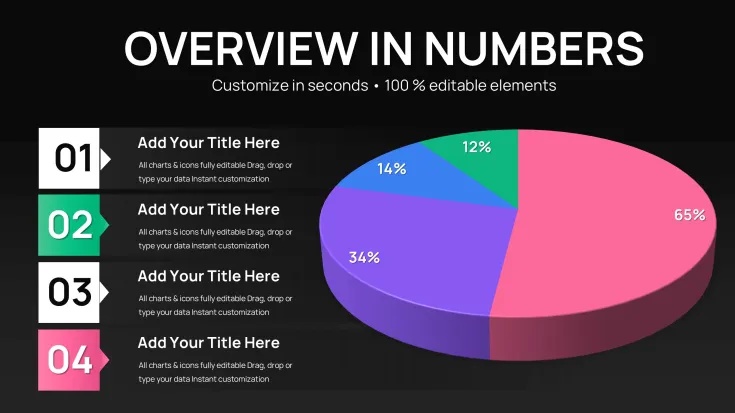
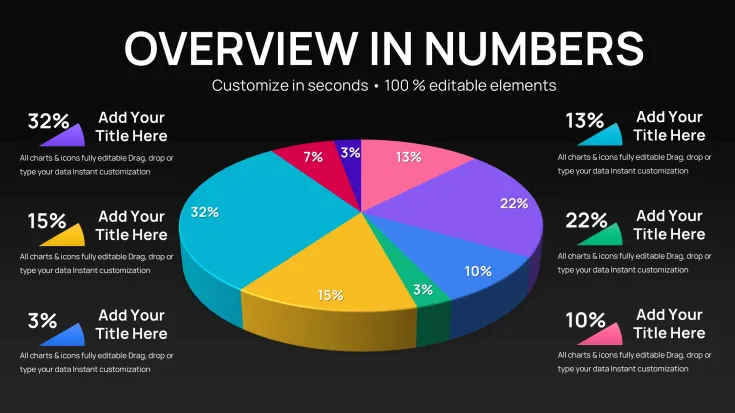
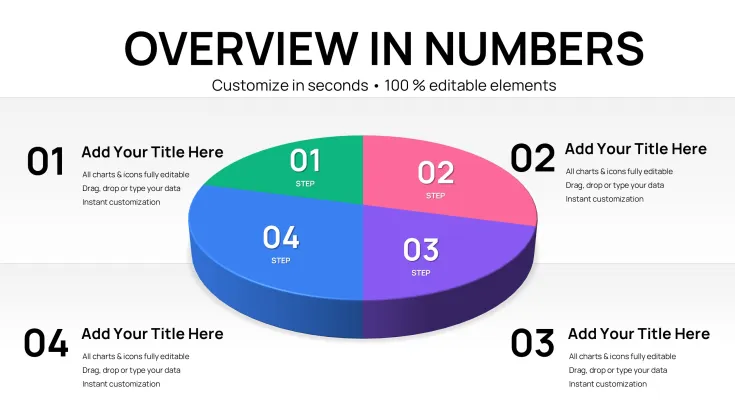
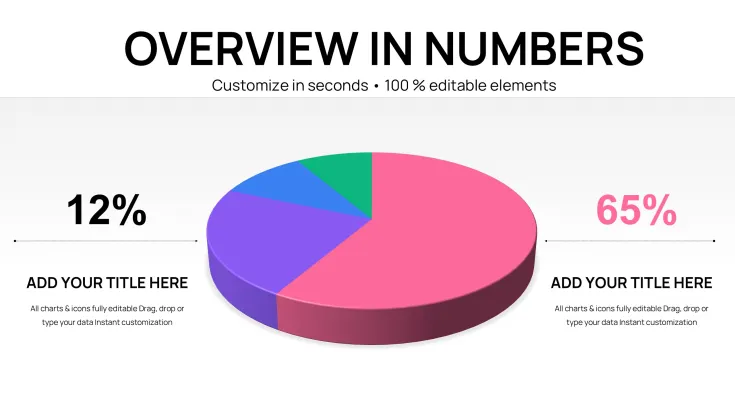
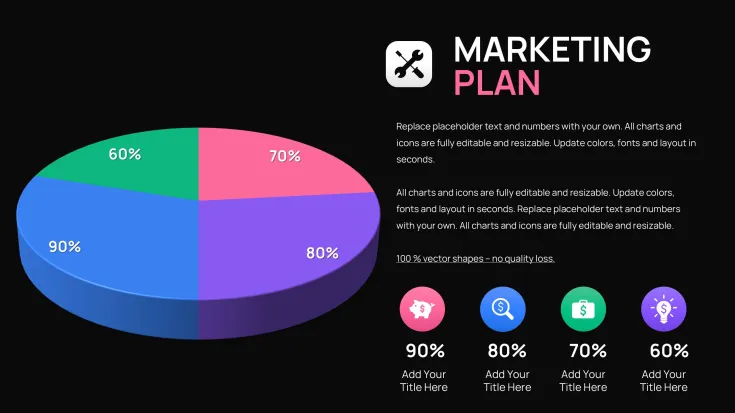
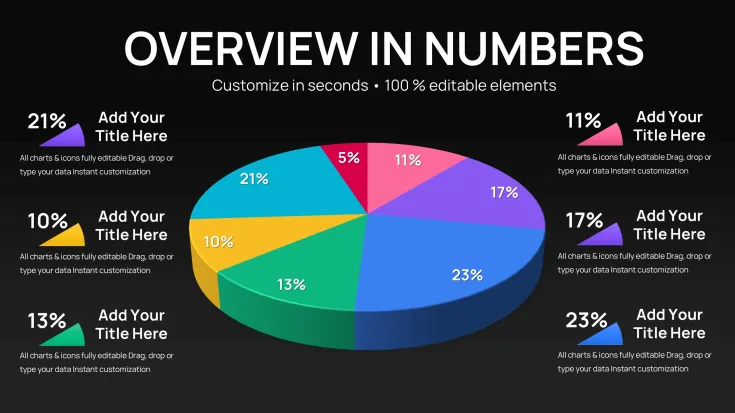
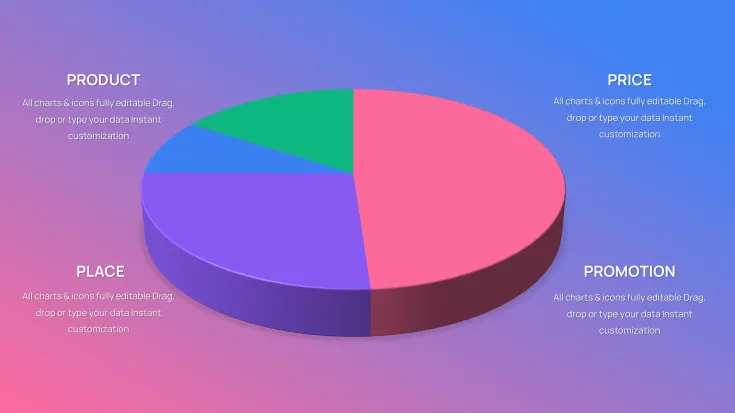
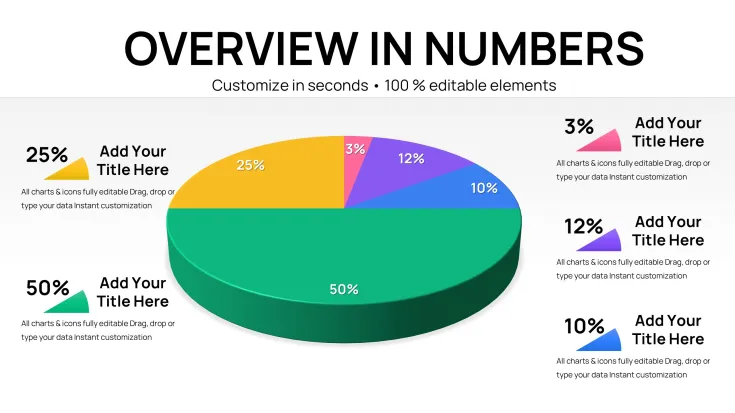
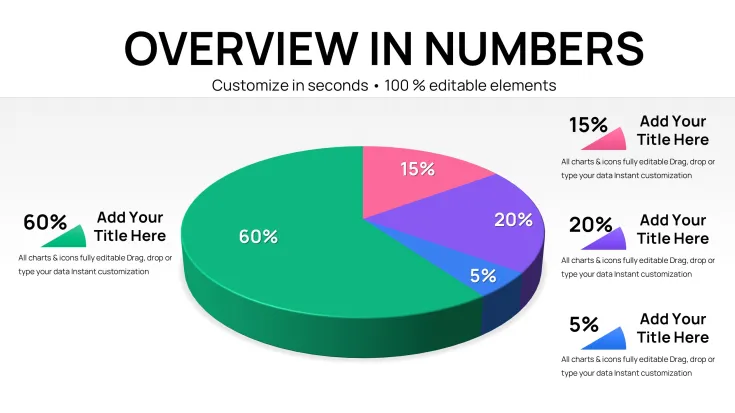
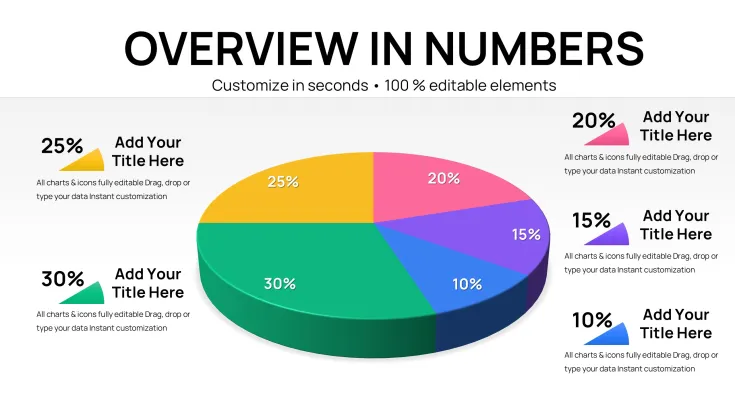
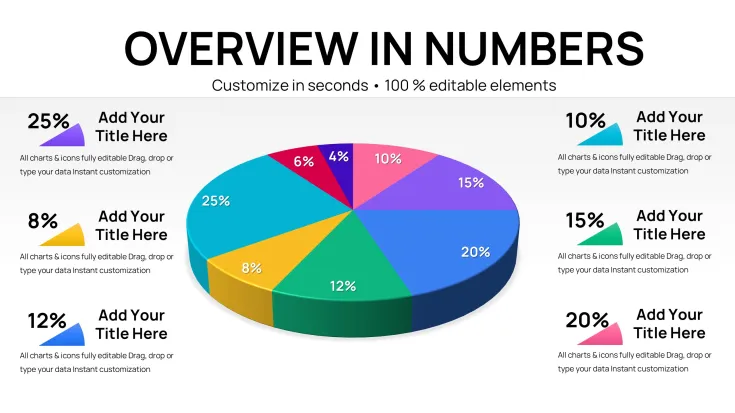
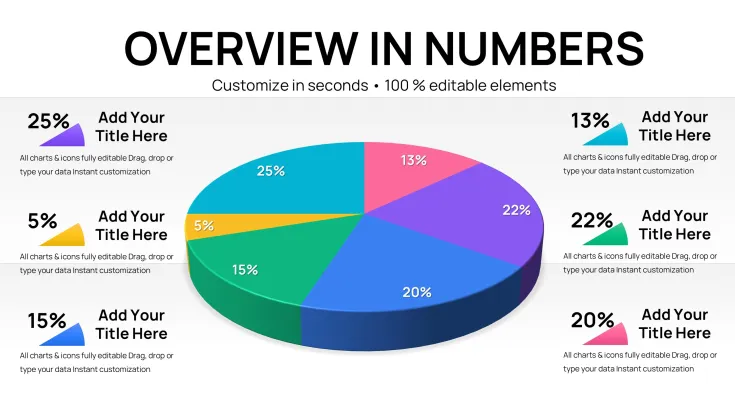
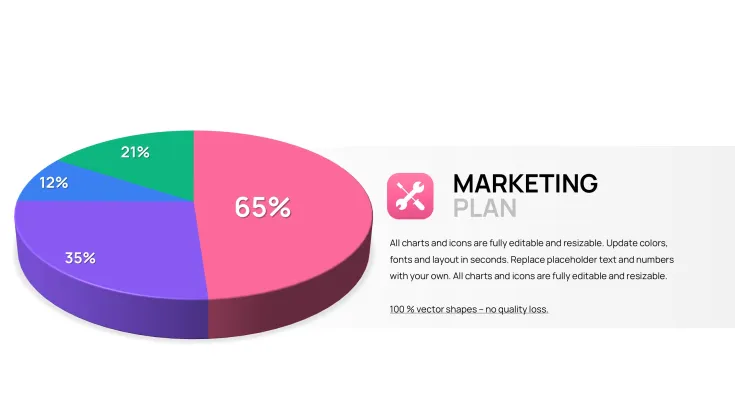
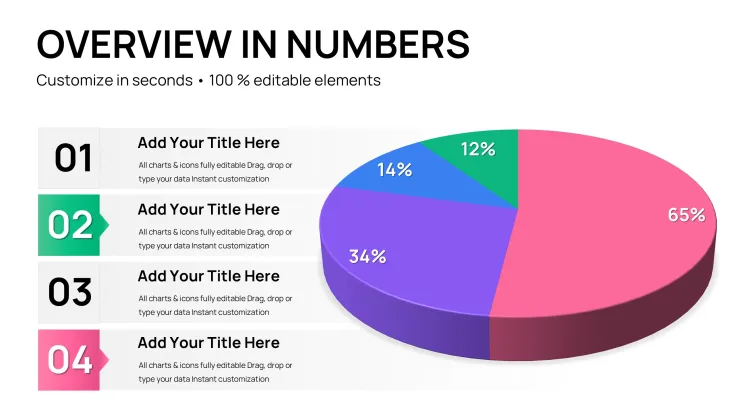
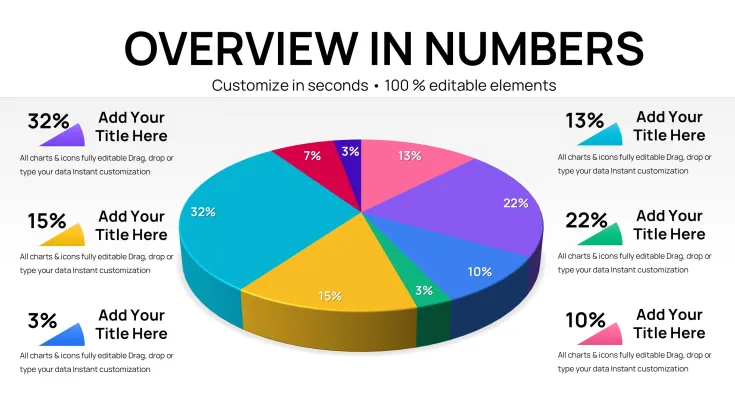
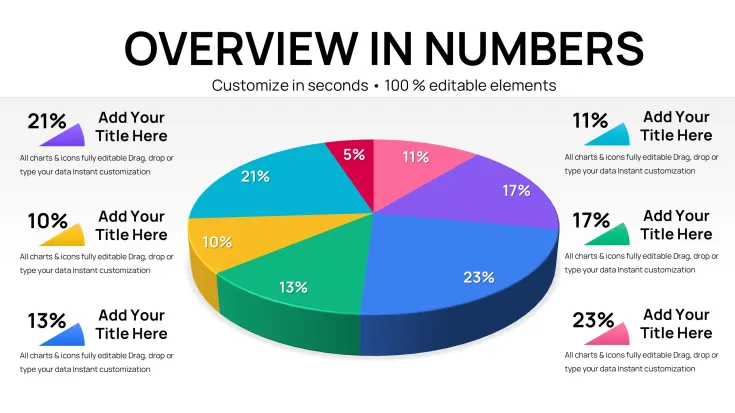
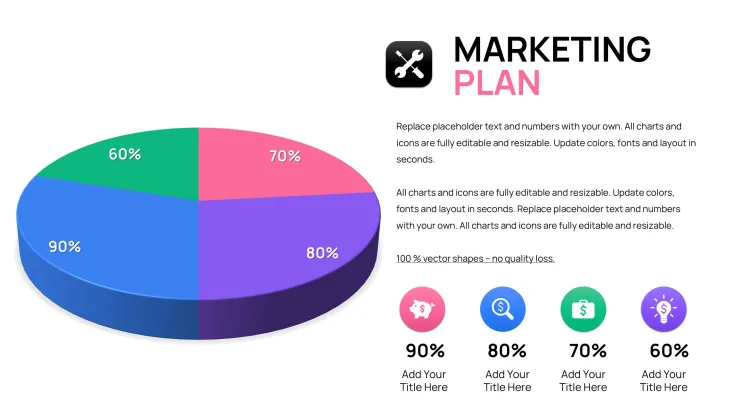
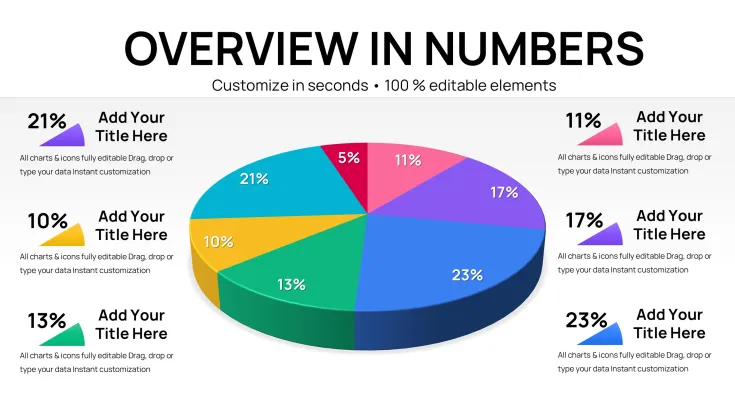
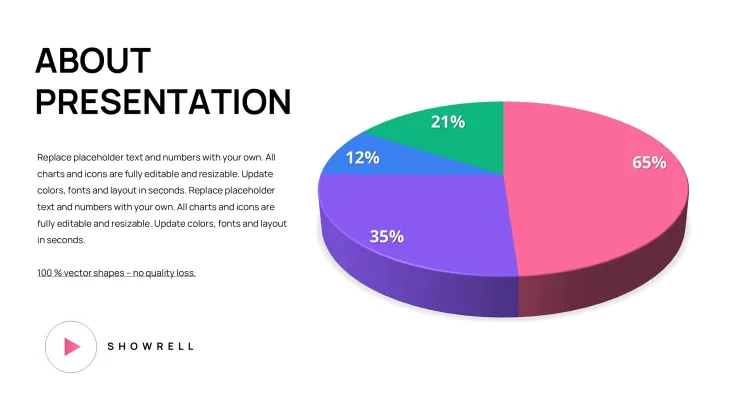
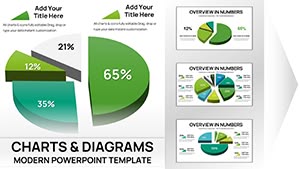
29 slides feature 3D pie charts with external labels and layered depth. The download includes every diagram ready for data entry and color matching.
Leader lines keep small segments legible while 3D perspective adds visual weight to larger shares.
Compared to flat pie sets this template uses depth to communicate proportion magnitude immediately. Segment labels sit outside the chart for a specific reason when a demographic cohort represents less than 12 percent of the total interior text at readable font sizes no longer fits the segment. It works best for investor presentations because the ready 3D views let executives compare slices without mental rotation.
What is a PowerPoint diagram template? A PowerPoint diagram template is a pre-built .pptx file with editable charts and graphs that professionals customize in Microsoft PowerPoint for business presentations.
Format and Compatibility Details
FeatureDetailsSlides included29 3D pie layoutsEditable shapessegments and leader linesColor adjustmentsmaster paletteAspect ratio16:9PowerPoint versions2016 and newerFile formatsPPTXReal Scenarios
A financial analyst needed to show market share distribution in the quarterly review. She opened the file entered percentages adjusted two colors and finished the deck in one afternoon without a designer.
The board grasped the 3D proportions instantly and moved straight to questions.
Download and start editing immediately
Edit Brand Present The Workflow
Open the file and spend the first two minutes orienting to the master slide structure - this is where all color changes happen globally. The most common mistake is editing individual slide colors directly going through the master saves 15 minutes of repeated work. Once content is in place the export step depends on the destination audience.
State editing difficulty: Advanced.
The Cost of Not Using a Template
Manual 3D pie construction takes two hours per chart and frequently misaligns leader lines. 3D perspective in pie charts aids proportion perception only when rotation angle stays consistent across slides - inconsistent angles force the audience to re-orient. This template locks that angle so comparisons remain instant.
You avoid redesign loops and deliver polished slides every time.
Download and start editing immediately
Executives reviewing pie PowerPoint chart templates combine this deck with editable PowerPoint charts for board meetings or 3-D pie PowerPoint charts for board meetings when they need both flat and volumetric options in the same investor deck.
Which PowerPoint version works with this template?PowerPoint 2016 2019 and 365 render the 3D pies and leader lines correctly on both Windows and Mac.
How do I change the color scheme?Modify the slide master theme and every pie segment updates. Single-slice color overrides stay available for emphasis.
What does the license allow?Internal and client work are permitted. Share the finished presentation deck as needed.
What is included in the paid versus free version?Paid supplies the complete 29-slide editable set. Free previews show static images only.
What is the refund policy?Refund within 30 days if the 3D pies do not open or the label placement does not suit your board format.
How do I update chart data?Right-click any pie select Edit Data enter new values and the 3D rendering plus external labels refresh automatically.
Good for
- Project roadmaps and sprint plans
- Product launch timelines
- Quarterly or annual review decks
- Company history and milestone summaries
Licence
reviews
Student project benefited from ready 3D effects. Clear for audience, though avoid overusing in text-heavy decks.
3D pie charts with leader lines made proportions stand out in quarterly review. Depth helps visualize larger shares instantly. Board moved to discussion quickly.
Editing data refreshes 3D rendering automatically - huge time saver. Consistent angles across slides aid comparisons. Professional for investor use.
The 29 slides cover overview to breakdown needs. External labels handle small segments well. Minor Mac rendering quirks but overall solid.
Financial team loved how these communicate market share. Brand color updates via master are seamless. Recommended.
Deadline pressure before presentation - had polished slides in under an hour. Visual weight feels premium.
FAQ
Will it work in Google Slides?
Are fonts embedded?
Can I use this for client work?
What's the refund policy?
Do you update the template after purchase?
Similar templates
See all PowerPoint Charts →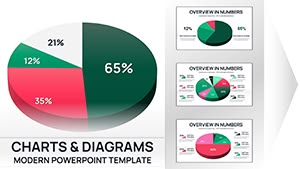
All 29 slides