 Click to zoom
Zig-Zag Step PowerPoint Charts Template
| Format | .pptx |
| Slides | 19 unique layouts |
| Aspect ratio | 16:9 |
| Compatibility | PowerPoint |
| Animated | No |
| Language | English |
| License | Commercial |
| File size | — |
| Version | v1.0 |
| Last updated | February 2024 |
What's inside
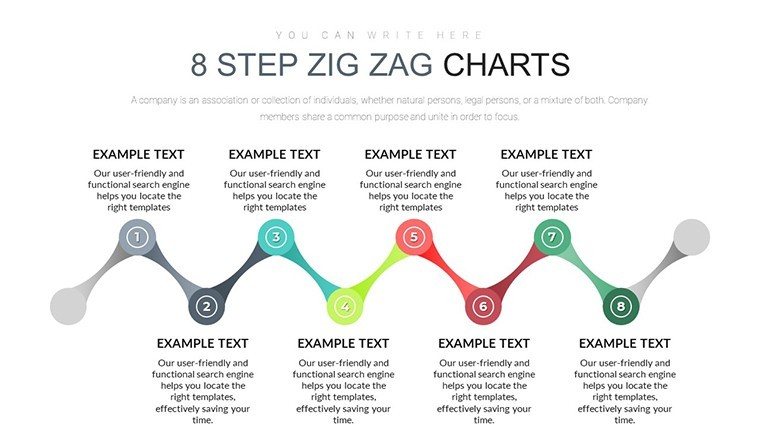
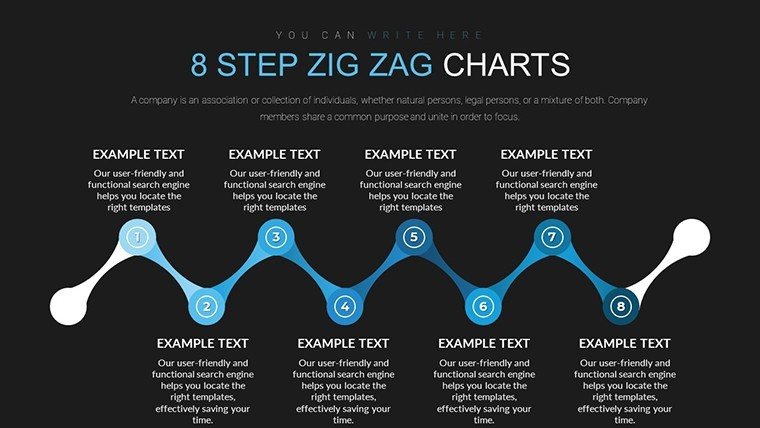
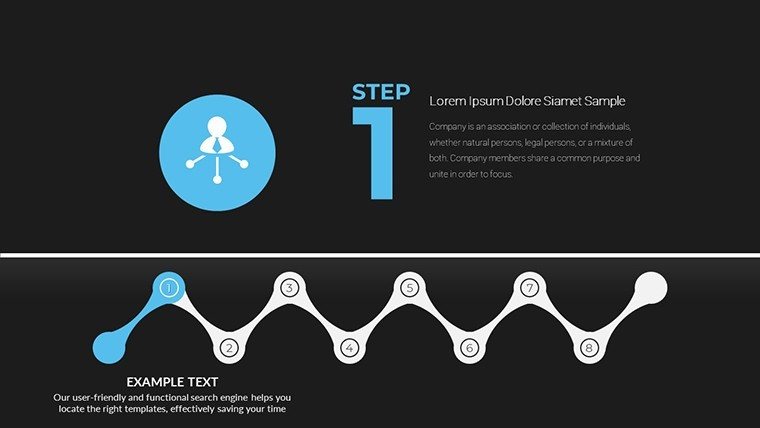
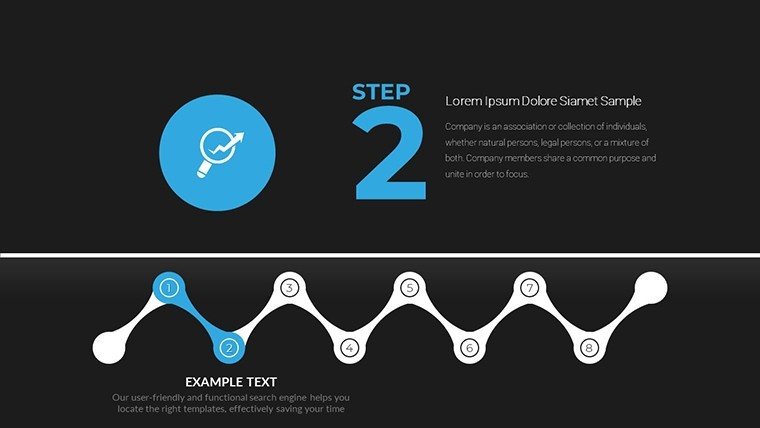
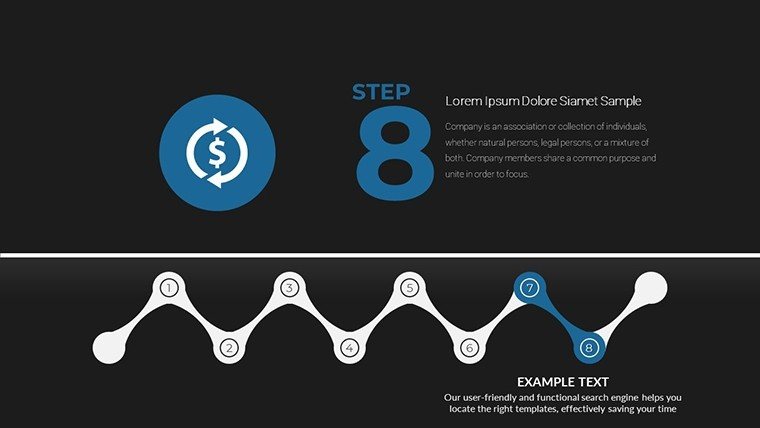
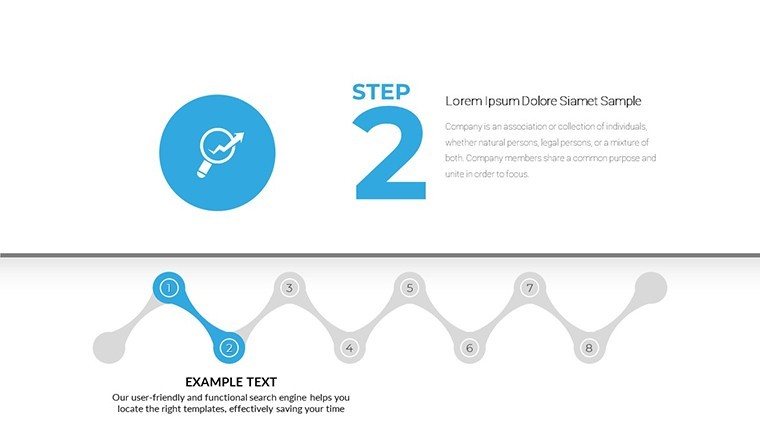
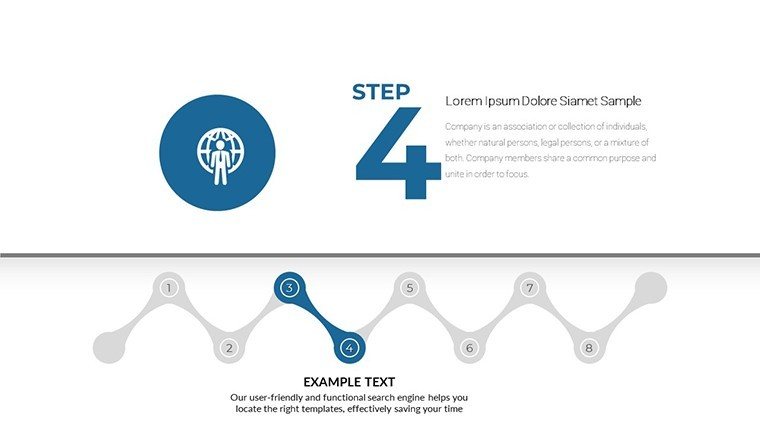
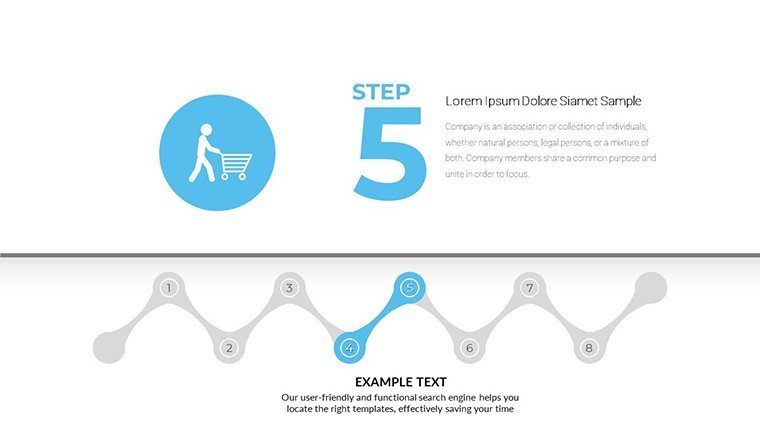
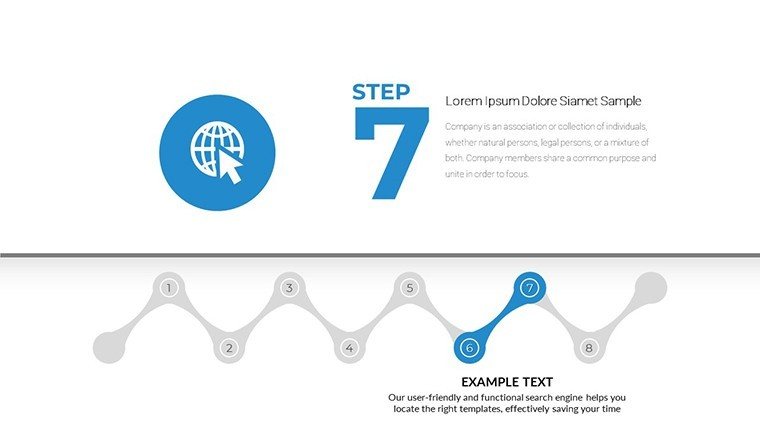
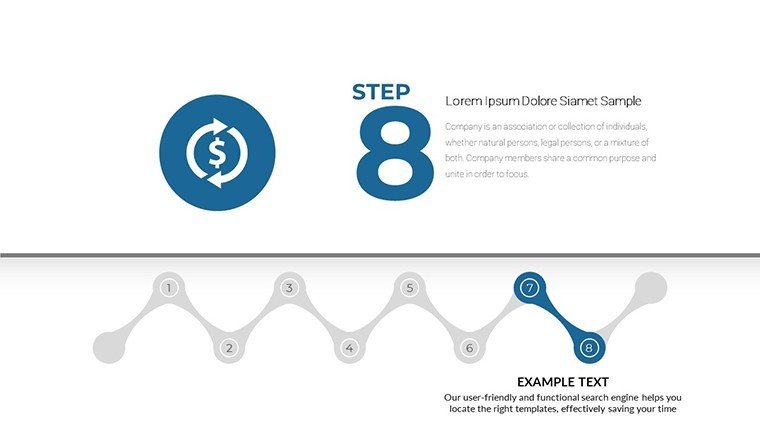
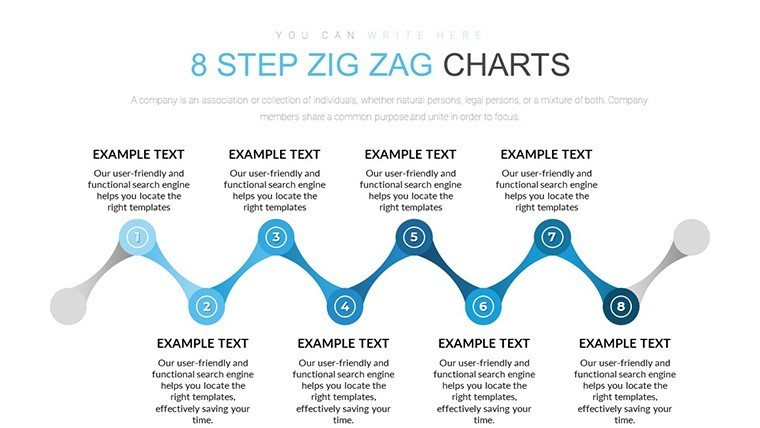
Navigate the twists and turns of your data with confidence using the Zig-Zag Step PowerPoint Charts Template. This innovative design, featuring 19 editable slides, turns linear progressions into dynamic, zig-zagging visuals that capture attention and clarify sequences. Perfect for professionals tackling timelines or processes, it caters to business executives summarizing fiscal years, educators dissecting historical events, or project leads mapping milestones. The zig-zag pattern, inspired by efficient pathfinding in urban design, adds a modern edge while ensuring logical flow. Seamlessly compatible with PowerPoint and Google Slides, this template minimizes design hurdles, letting you focus on content. Whether illustrating a product's evolution in a pitch or breaking down workflow in training sessions, it transforms complexity into compelling narratives, fostering better understanding and decision-making among your viewers.
Captivate with Dynamic Zig-Zag Designs
The zig-zag motif isn't just aesthetic - it's functional, mimicking switchback trails that make steep ascents manageable, much like simplifying intricate data journeys. Rooted in information design theories from experts like Bertin, who advocated for perceptual efficiency, this template uses alternating directions to guide eyes naturally through steps. In business contexts, apply it to financial trajectories, showing revenue fluctuations with color-coded zig-zags that highlight peaks and valleys. For educational use, it excels in timelines, such as tracing the Industrial Revolution's phases, aligning with curriculum standards from Common Core. The versatile color schemes - from professional neutrals to bold accents - allow branding integration, ensuring your presentations reflect organizational identity while maintaining visual harmony.
Standout Features for Effective Communication
- Unique Zig-Zag Layouts: Alternating steps for engaging timelines and processes.
- Editable Versatility: Customize paths, texts, and hues to fit any scenario.
- Clarity-Focused Design: Simplifies complex info with intuitive flows.
- Multi-Industry Adaptability: From finance to education, it scales effortlessly.
- High-Resolution Elements: Ensures crisp visuals in any format.
These elements embody by drawing on proven design methodologies. A real-world example: Consulting firms like McKinsey use similar zigzag visuals in strategy decks, reporting improved client comprehension in case studies.
Practical Uses in Professional Settings
Envision a project timeline where zig-zags delineate phases from inception to completion, incorporating icons for milestones like approvals or launches - this template makes it reality. In educational spheres, it aids in visualizing evolutionary biology, with each zag representing adaptations over time, supporting inquiry-based learning per AAAS guidelines. Business reports gain traction by zig-zagging through KPI analyses, revealing trends that static charts miss. For urban planners, akin to architecture, it could map development stages, from zoning to construction, emphasizing sustainable practices in line with USGBC standards. This addresses pain points like monotony in presentations, injecting energy that keeps audiences hooked and informed.
Easy Customization Process
- Select a zig-zag slide template that matches your data structure.
- Enter details into steps, adjusting arrows for directionality.
- Apply colors and fonts to enhance readability and appeal.
- Add supporting visuals like graphs within the path.
- Review for flow, ensuring smooth transitions.
This mirrors lean processes, enabling rapid iterations for agile environments.
Advantages Over Conventional Charts
Basic timelines are straight and stale; zig-zags add intrigue, boosting engagement as per eye-movement studies from the Human-Computer Interaction Institute. It cuts creation time by providing ready frameworks, with users noting efficiency gains in feedback from platforms like SlideShare. Trust in its quality stems from ImagineLayout's reputation for reliable tools, ensuring your work shines professionally.
Expert advice: Use contrasting colors for alternate zags to emphasize progression, and integrate with data analytics for real-time updates.
Start Your Zig-Zag Journey
Unlock the potential of dynamic storytelling - download the Zig-Zag Step Charts Template and lead your audience through insightful paths.
Frequently Asked Questions
How flexible is the zig-zag design?
Fully adjustable for length, direction, and content to suit your needs.
Compatible with Google Slides?
Yes, works without issues on both platforms.
Can I add animations?
Certainly, to animate the zig-zag progression for impact.
Best for which applications?
Timelines in business, education, and project management.
Slide count?
19 editable slides included.
Suitable for beginners?
Yes, straightforward editing interface.
Good for
- Project roadmaps and sprint plans
- Product launch timelines
- Quarterly or annual review decks
- Company history and milestone summaries
Licence
reviews
Used this for quarterly metrics and it looked professional enough.
The charts were readable even on a projector.
Some icons looked a little old.
The layouts were simple to customize.
FAQ
Will it work in Google Slides?
Are fonts embedded?
Can I use this for client work?
What's the refund policy?
Do you update the template after purchase?
Similar templates
See all PowerPoint Charts →

All 19 slides