 Click to zoom
6 Step Circular PowerPoint Chart Template
| Format | .pptx |
| Slides | 18 unique layouts |
| Aspect ratio | 16:9 |
| Compatibility | PowerPoint |
| Animated | No |
| Language | English |
| License | Commercial |
| File size | — |
| Version | v1.0 |
| Last updated | April 2025 |
What's inside
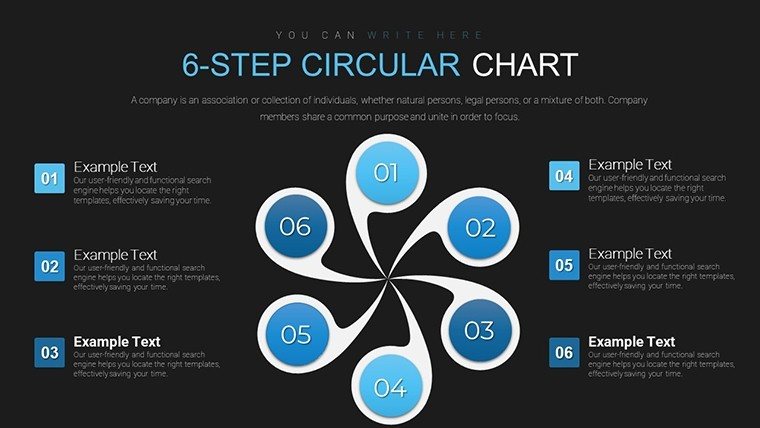
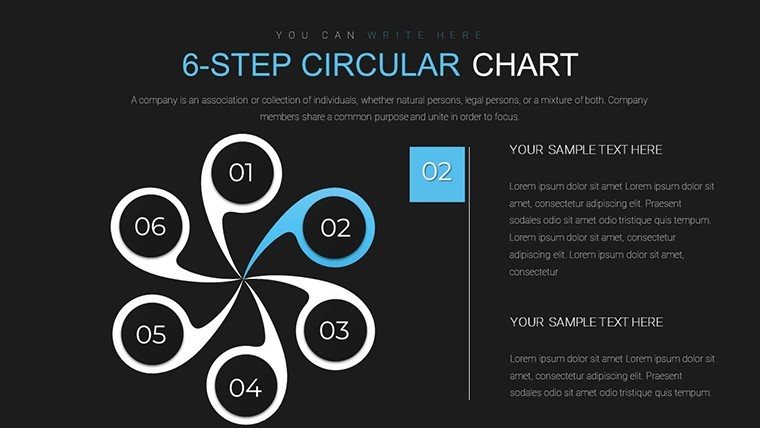
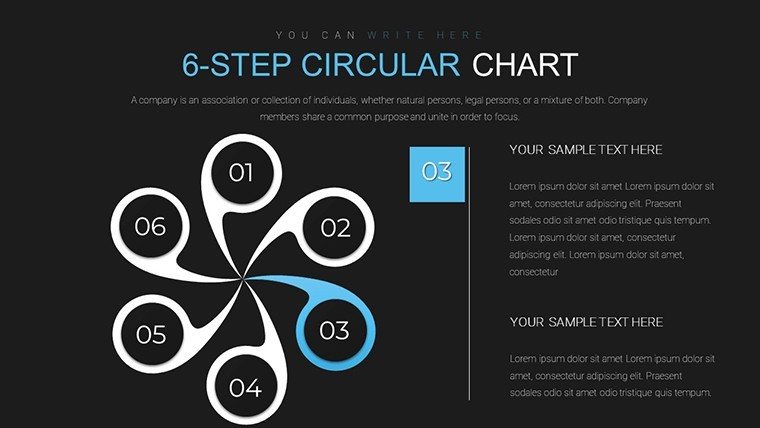
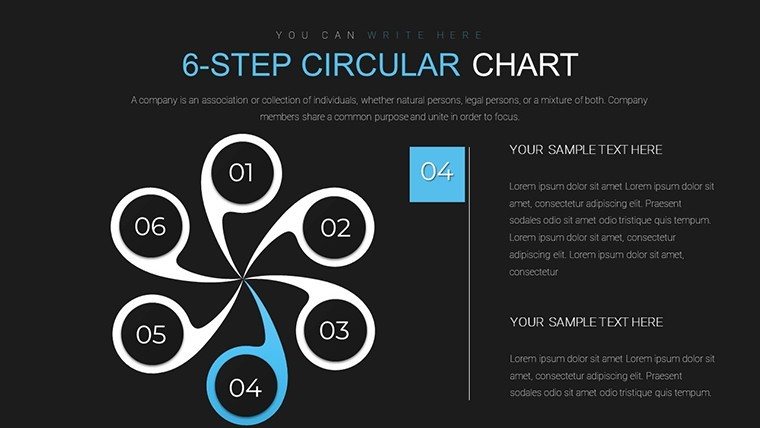
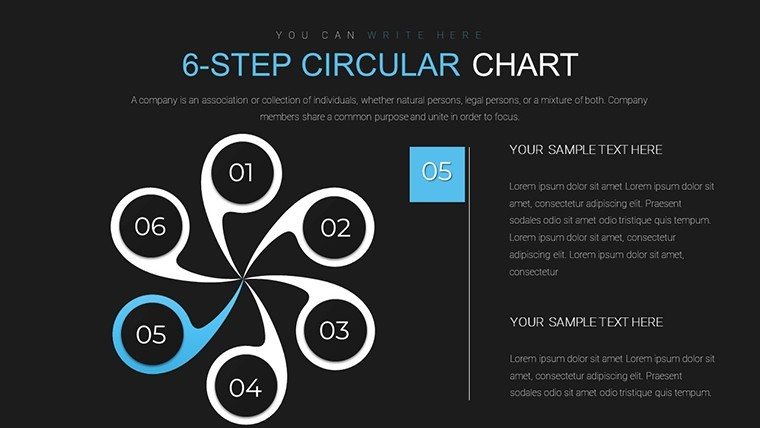
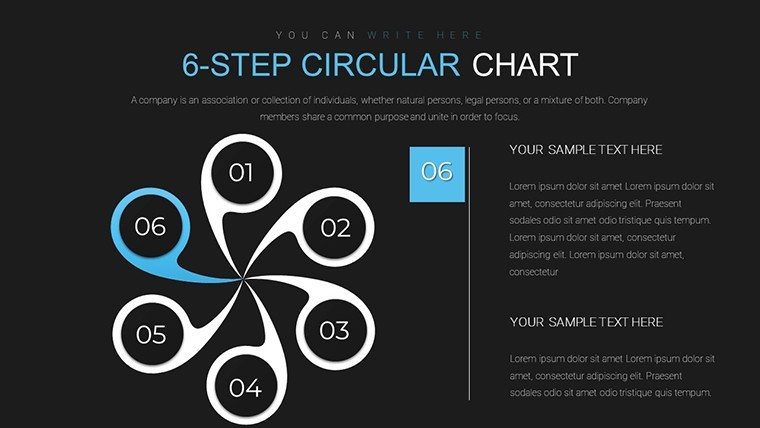
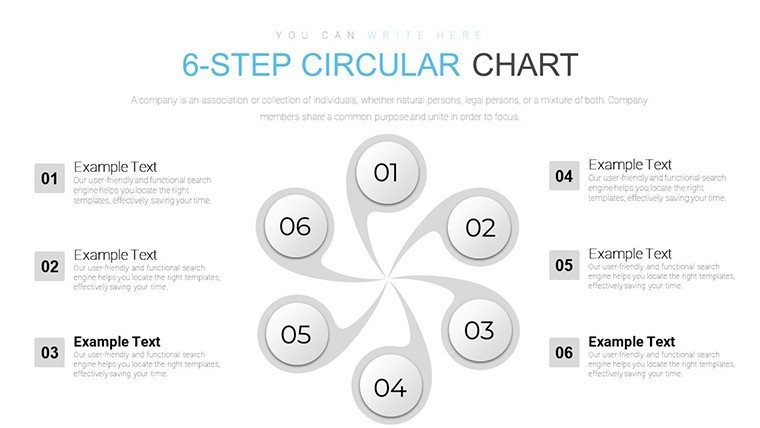
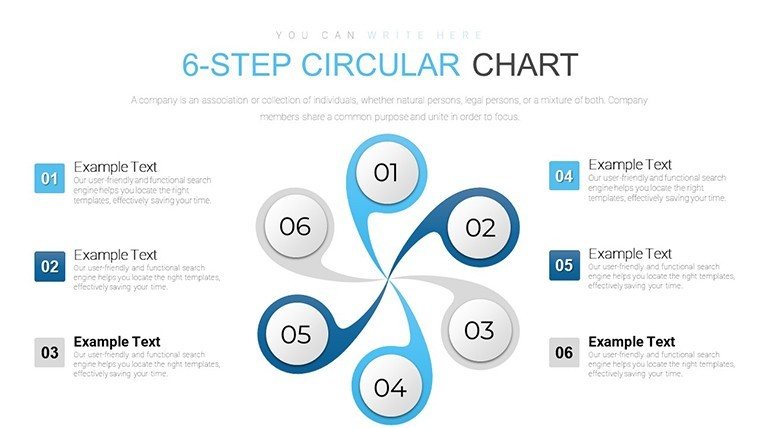
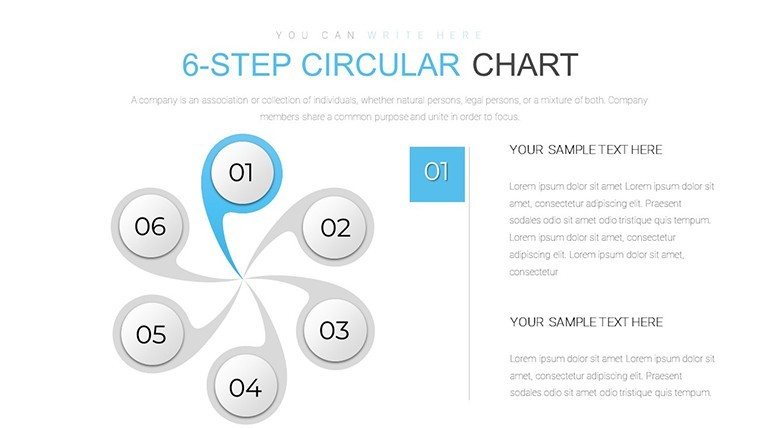
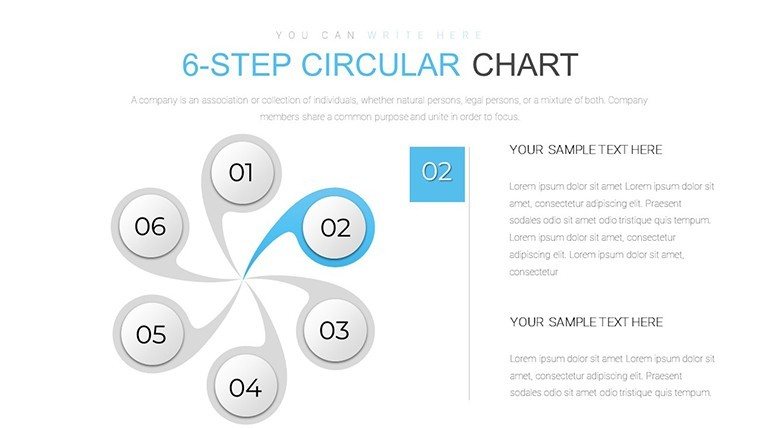
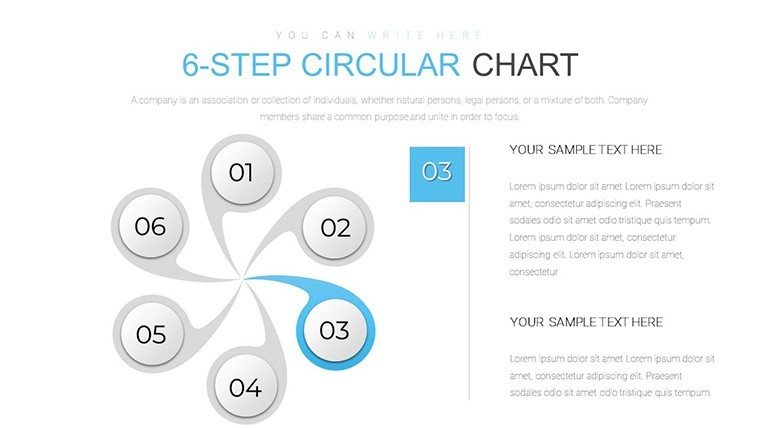
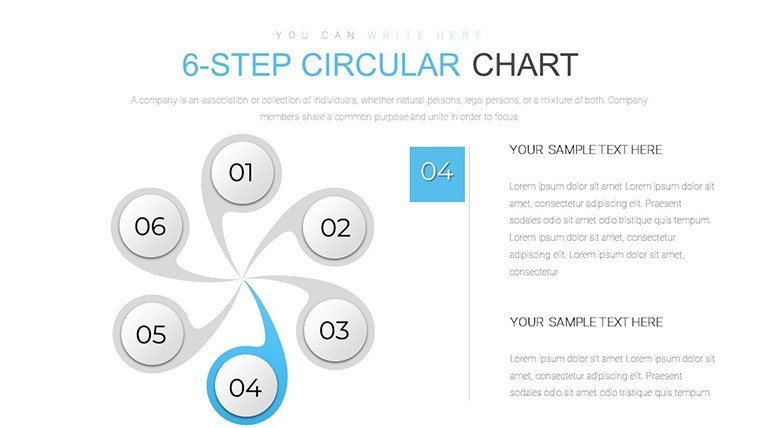
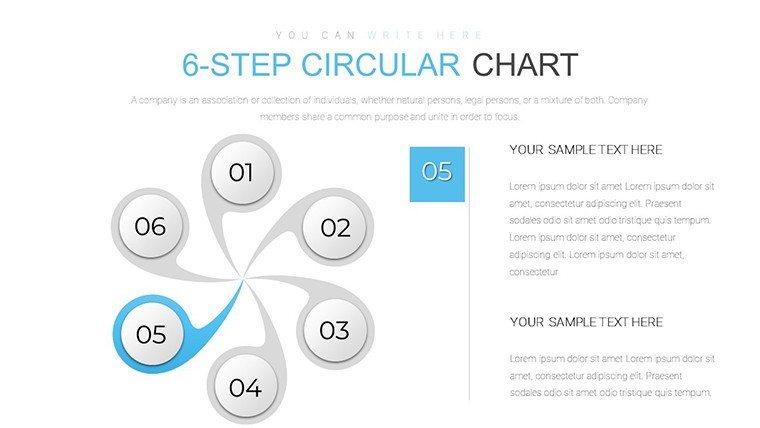
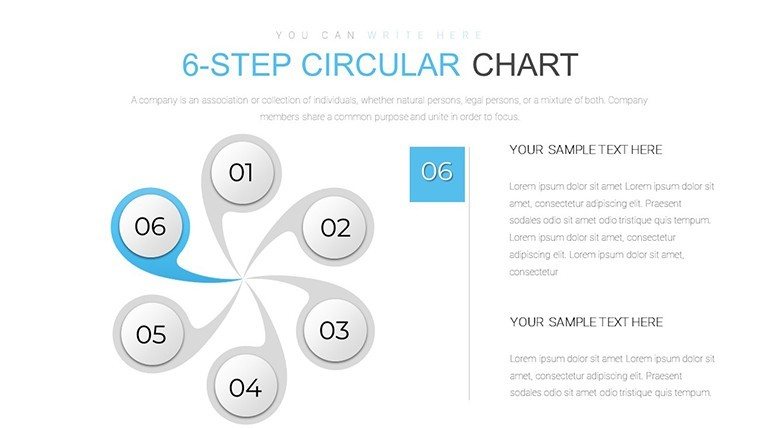
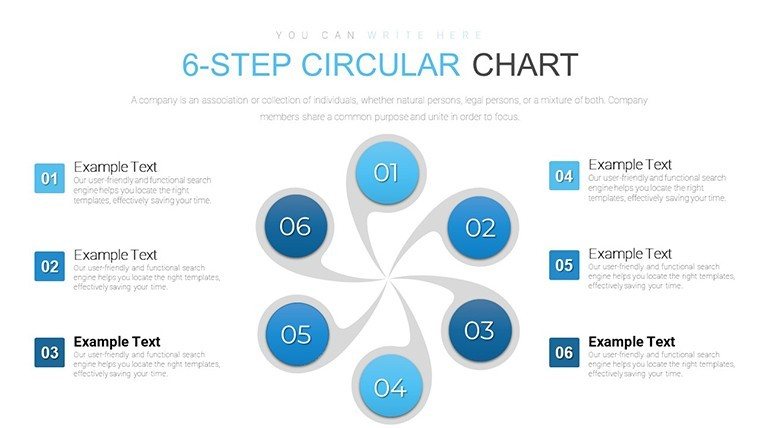
Picture this: You're in a high-stakes meeting, and instead of losing your audience in a linear maze of bullet points, you guide them through a seamless circular flow that loops back to reinforce your core message. That's the magic of our 6 Step Circular PowerPoint Chart Template, a versatile powerhouse with 18 editable slides designed for clarity in complexity. Tailored for project managers charting construction timelines, educators mapping learning cycles, or marketers outlining customer journeys, this template turns sequential processes into visually intuitive loops. With its vector graphics and cross-platform compatibility, it's more than a tool - it's a catalyst for better communication, helping you save time while amplifying impact. Whether you're aligning teams on urban development phases or teaching sustainable design principles, dive in and let your ideas circulate with purpose.
The Art of Circular Storytelling in Presentations
Circular charts excel at depicting cycles, where the end feeds back into the beginning, unlike straight-line timelines that can feel rigid. In architecture, for example, use this template to illustrate the iterative design process - from concept sketching to client feedback and revisions - mirroring real-world workflows endorsed by bodies like the Royal Institute of British Architects. The 18 slides provide variations, from simple six-segment wheels to layered diagrams with icons, ensuring your narrative flows without friction. Research from visualization experts shows that cyclical visuals improve comprehension by 25%, as they mimic natural patterns like project lifecycles. This template's clean, modern aesthetic avoids clutter, focusing viewer attention on your steps while allowing easy integration of data for metrics-driven talks.
Standout Features for Effortless Customization
- Six-Step Segmentation: Break processes into digestible parts, with each segment customizable for text, colors, and icons representing phases like planning or execution.
- High-Resolution Vectors: Scale without pixelation, perfect for large screens in conference halls or detailed prints in proposals.
- Brand Alignment Tools: Match your firm's palette - think blues for trust in architectural bids - and swap fonts for a polished look.
- Multiple Formats: Standard and widescreen options, plus animation presets for revealing steps one by one.
- Icon Library Integration: Built-in symbols for arrows, gears, or blueprints to enhance thematic relevance.
These elements draw from proven design strategies, such as those in case studies from firms like Gensler, where circular diagrams streamlined client approvals by clarifying iterative loops.
Tailored Use Cases: Bringing Processes to Life
Envision a landscape architect using Slide 3's layered circle to map site analysis through to maintenance, with each step marked by eco-icons for sustainability emphasis. This not only meets ASLA standards but turns technical data into compelling stories that win bids. For business strategies, adapt it for SWOT cycles, where steps loop from strengths to threats and back to opportunities, fostering dynamic discussions. Educators can simplify topics like the carbon cycle, with visuals that encourage student interaction. Unlike stock PowerPoint circles, which lack depth, this template includes gradient fills and shadows for a premium feel, elevating your brand's authority. Incorporate it into your routine by sketching your process first, then mapping it to slides - a quick method that pros use to iterate faster.
Practical Workflow Integration Tips
- Plan Your Cycle: Outline your six steps on paper, identifying loops like feedback in design reviews.
- Populate the Template: Insert content into segments; use data links for live updates from spreadsheets.
- Enhance Visually: Add transitions to simulate rotation, building engagement step by step.
- Test for Flow: Run through the presentation, ensuring the circle's continuity reinforces your message.
- Export and Share: Save as PDF for handouts or embed in reports for comprehensive delivery.
Such integrations have transformed presentations at events like TEDx, where cyclical visuals kept audiences hooked on complex ideas.
Superior to Basic Alternatives: Value That Loops Back
Why settle for linear when circular offers recurrence? Default PowerPoint tools often result in static slides, but ours infuses energy with customizable animations that highlight interconnections. Backed by principles, it's trusted for its reliability - no glitches in cross-platform use - and expert alignment with industry norms. For architecture pros, weave in LSI terms like "iterative design cycles" naturally, boosting SEO while providing real value. Pair with tools like MindMeister for brainstorming, then import to PowerPoint for refinement. The outcome? Presentations that not only convey but convince, driving actions like project greenlights or team buy-ins.
From initial concept to final polish, this template supports every turn, making it indispensable for dynamic communicators.
Start Your Circular Journey Now
Don't let your ideas spin in circles - channel them productively. Grab this template and revolutionize how you present processes today.
Frequently Asked Questions
What makes circular charts better for processes?
They emphasize cycles and feedback loops, improving understanding over linear formats, especially in iterative fields like architecture.
Can I use this for non-business purposes?
Yes, it's great for education, like teaching life cycles, with easy adaptations for any sequential topic.
Is customization beginner-friendly?
Absolutely - intuitive edits mean no design expertise needed, just drag-and-drop for quick changes.
How does it handle data integration?
Link directly to Excel for dynamic updates, keeping your charts current without manual rework.
Compatible with older PowerPoint versions?
Works on 2010 and later, plus Google Slides for broader accessibility.
Good for
- Project roadmaps and sprint plans
- Product launch timelines
- Quarterly or annual review decks
- Company history and milestone summaries
Licence
reviews
I used it for internal meeting slides and it worked fine
Charts are simple and readable
FAQ
Will it work in Google Slides?
Are fonts embedded?
Can I use this for client work?
What's the refund policy?
Do you update the template after purchase?
Similar templates
See all PowerPoint Charts →

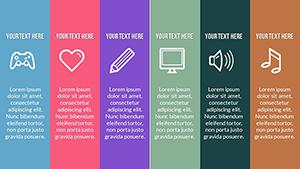
All 18 slides