 Click to zoom
Web Stores PowerPoint Charts Template: Optimize Your Online Operations
| Format | .pptx |
| Slides | 18 unique layouts |
| Aspect ratio | 16:9 |
| Compatibility | PowerPoint |
| Animated | No |
| Language | English |
| License | Commercial |
| File size | — |
| Version | v1.0 |
| Last updated | January 2022 |
What's inside
Think of launching an online store as simple as posting a photo - our Web Stores PowerPoint Charts Template makes visualizing that reality effortless. Featuring 18 editable slides, it's geared toward e-commerce entrepreneurs, project managers, and analysts who need to diagram processes, interactions, and data flows. This tool demystifies complex setups, from inventory management to customer journeys, enabling you to refine strategies and allocate resources effectively. In an era where digital retail thrives, this template empowers you to present plans with clarity, driving efficiency and growth.
Harnessing Charts for E-Commerce Excellence
Grounded in agile project management methodologies, this template excels in depicting sequential and spatial relationships. It goes beyond basic flowcharts by including editable objects for real-time scenario modeling, ideal for multi-team environments with shifting deadlines.
Core Features Driving Digital Success
- 18 Dynamic Slides: Encompassing Venn diagrams, flowcharts, and illustrations for comprehensive analysis.
- Interaction Focus: Tools to map message sequences and object interactions.
- Project Management Tools: Aids in scheduling and resource allocation visuals.
- High Adaptability: Fully editable for custom data integration.
- Compatibility: Smooth with PowerPoint and Google Slides.
A Shopify case study highlights how flowchart visualizations reduced operational errors by 25% in web store setups.
In-Depth Slide Overview: From Setup to Scale
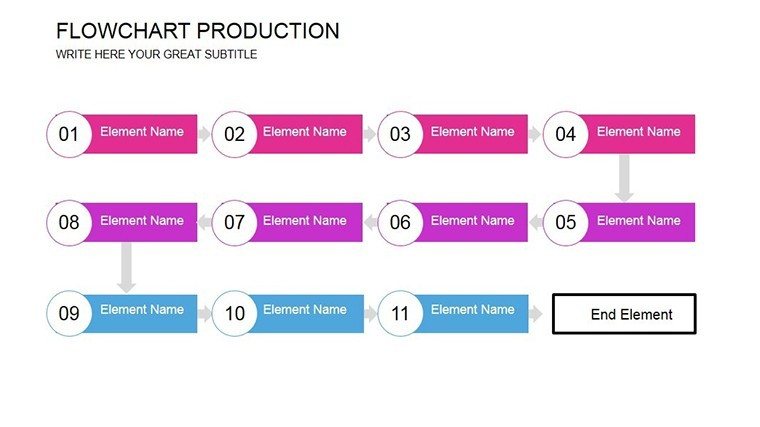
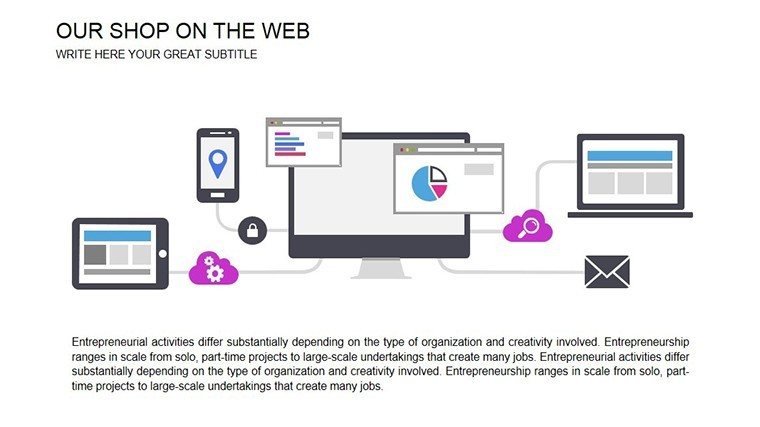
Slide 1 sets the stage with an overview flowchart of web store architecture. Slides 2-6 detail process sequences - like order fulfillment paths, from cart to delivery. Illustrate, for instance, how inventory syncs with sales channels.
Slides 7-11 incorporate Venn diagrams for overlapping elements, such as marketing and logistics intersections. Analyze spatial data, like user behavior heatmaps. Slides 12-15 offer Gantt-style charts for project timelines, crucial for launch planning. End with Slides 16-18's optimization summaries, including KPI dashboards and improvement roadmaps.
Strategic Tips for Web Store Mastery
- Map end-to-end: Trace customer journeys to identify pain points.
- Customize visuals: Adapt charts to reflect real-time data feeds.
- Collaborate effectively: Use shared edits for team alignment.
- Iterate plans: Update charts as projects evolve.
- Integrate with e-tools: Link to platforms like WooCommerce for accuracy.
These approaches establish your expertise in digital commerce visualization.
Practical Use Cases: Powering Online Ventures
E-commerce teams use it for launch strategies; analysts for data refinement. An Amazon seller revamped their supply chain visuals, boosting efficiency, as per an E-Commerce Times report. Educators teach online business models with these charts.
Outperforms default PowerPoint by offering specialized e-commerce layouts, halving design time.
Seamless Integration into Your Digital Workflow
Download, customize processes, and present. Cloud-compatible for ongoing refinements.
Revolutionize your web store presentations - download and dominate the digital space.
Frequently Asked Questions
What chart types are featured?
Flowcharts, Venn diagrams, and sequence maps for e-commerce.
Can I edit for specific stores?
Yes, fully customizable to your platform.
Is it for beginners?
Absolutely, intuitive for all levels.
How to handle complex projects?
Use layered slides for detailed breakdowns.
Are there export options?
Yes, PDF and image formats available.
Does it include icons?
Included for enhanced visuals.
Good for
- Project roadmaps and sprint plans
- Product launch timelines
- Quarterly or annual review decks
- Company history and milestone summaries
Licence
reviews
Used a few slides for weekly reporting at work.
The arrows and graphs were organized nicely.
A little too many duplicate layouts maybe.
Still worth it for the editable charts.
FAQ
Will it work in Google Slides?
Are fonts embedded?
Can I use this for client work?
What's the refund policy?
Do you update the template after purchase?
Similar templates
See all PowerPoint Charts →

All 18 slides