 Click to zoom
Versatile Formation PowerPoint Diagram Templates
| Format | .pptx |
| Slides | 20 unique layouts |
| Aspect ratio | 16:9 |
| Compatibility | PowerPoint |
| Animated | No |
| Language | English |
| License | Commercial |
| File size | — |
| Version | v1.0 |
| Last updated | September 2023 |
What's inside
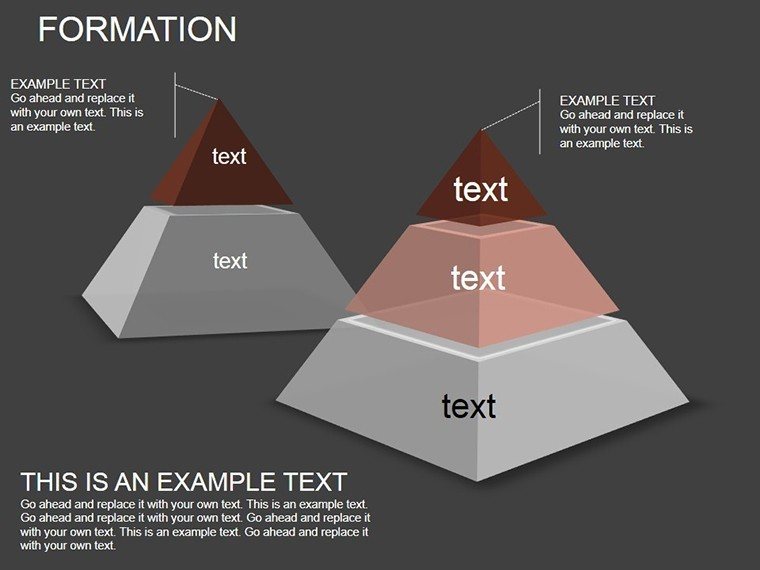
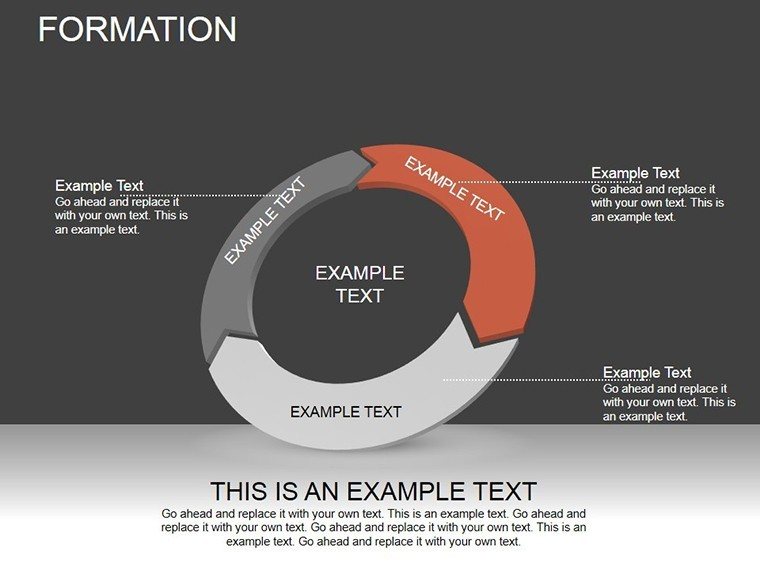
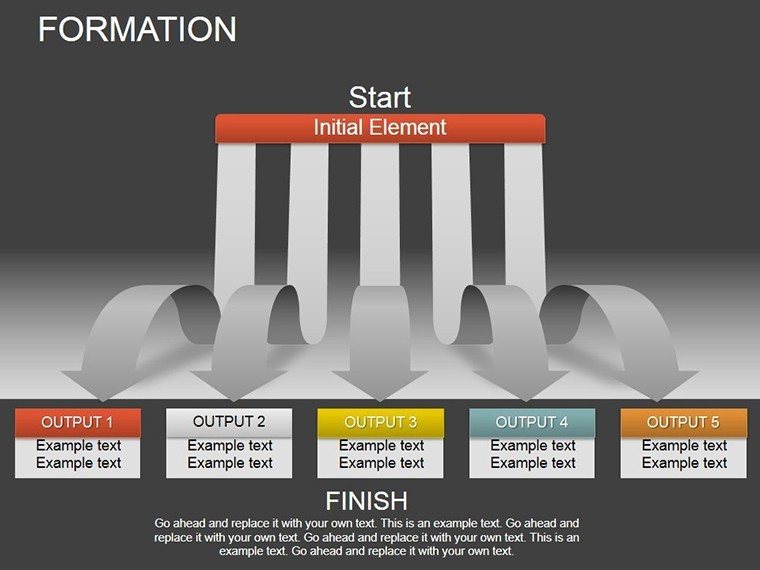
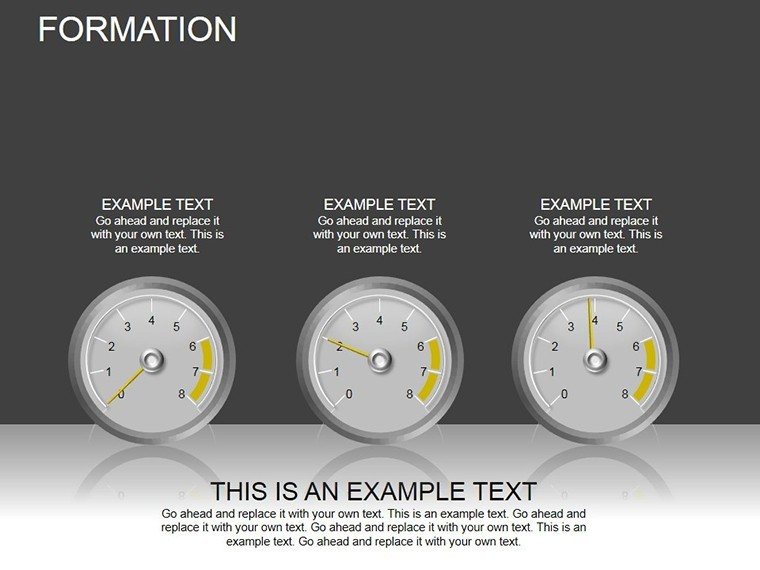
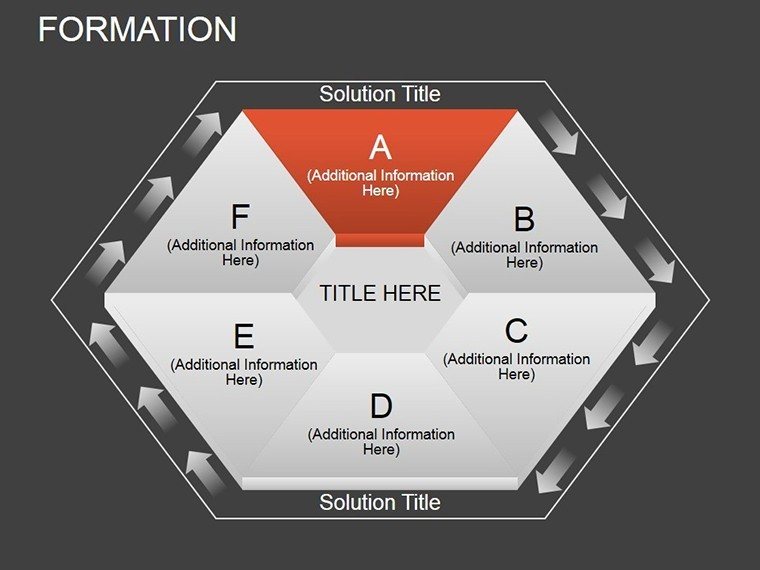
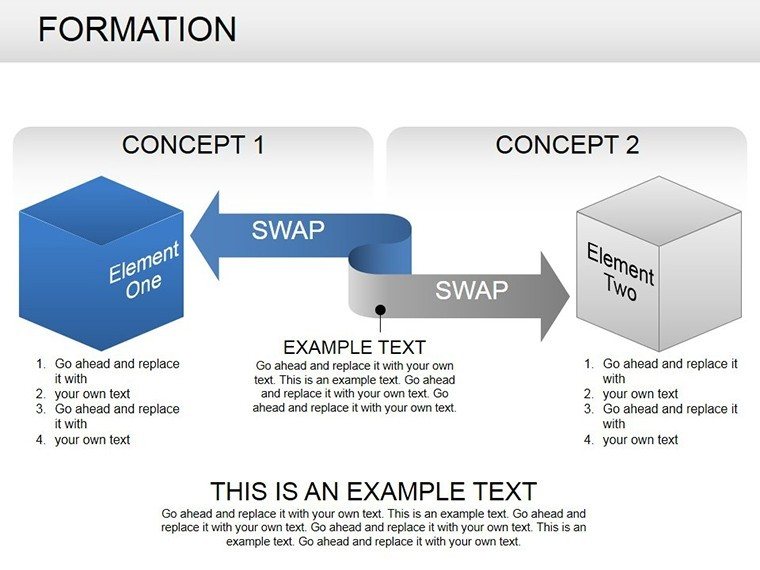
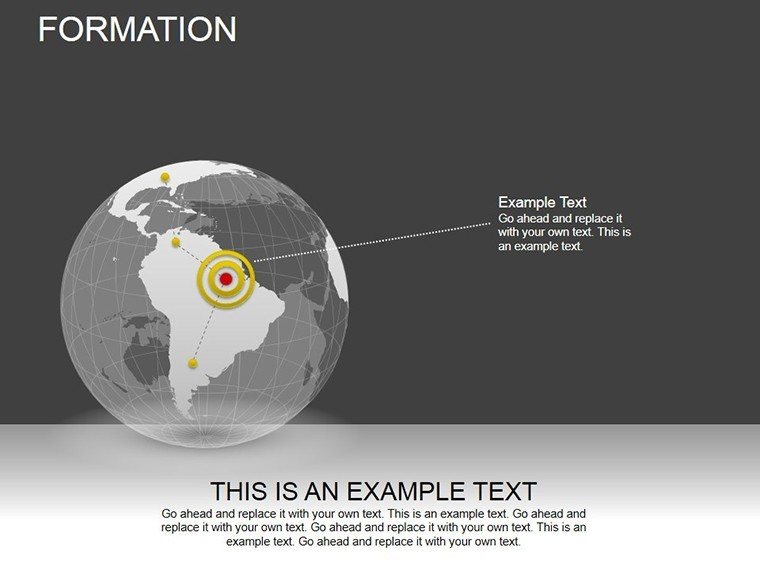
When ideas need to connect - whether tracing a project's evolution or illustrating market shifts - the right diagram can illuminate paths others miss. The Formation PowerPoint Diagram Template delivers 20 editable slides specializing in cycles, graphs, arrows, and cubes, available in both light and dark themes for any presentation setting. Geared toward strategists, analysts, and educators who demand precision without the hassle, it streamlines turning raw concepts into refined visuals that drive decisions and discussions.
Seamless with PowerPoint's .pptx format, this template invites quick integrations - drag a cycle diagram into your quarterly review, tweak arrows to denote process pivots, and watch cohesion emerge. No steep learning curves; it's user-friendly from the first slide, with elements that scale effortlessly for reports, pitches, or lectures. Light mode keeps things crisp for daylight briefings, while dark preserves focus in low-light theaters, ensuring your diagrams pop regardless of venue.
This collection isn't a scattershot of shapes - it's a curated arsenal for narrative builders. Think of layering cubes to represent layered risks in a business model, echoing how pros stack insights for multidimensional views. It frees you to emphasize strategy over styling, embedding data directly into graphs for live updates that keep stakeholders synced.
Key Building Blocks for Diagram Dominance
Each of the 20 slides is a standalone powerhouse, yet they interlock like puzzle pieces in your deck.
- Edit-First Design: Reshape arrows for directional emphasis, recolor graph bars to highlight variances, and regroup cycles for phased breakdowns - all with native tools.
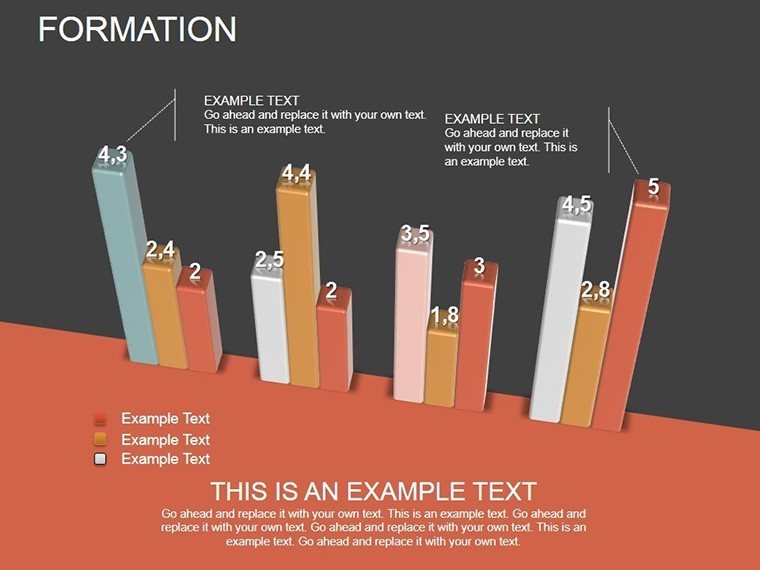
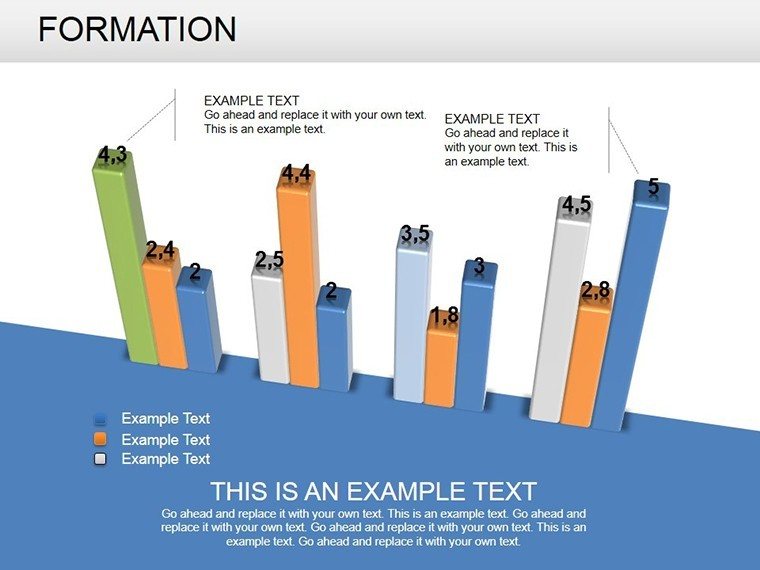
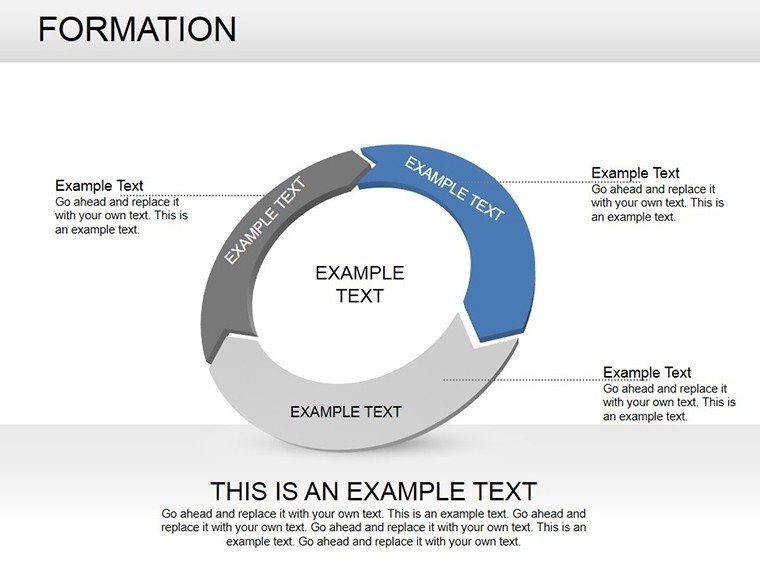
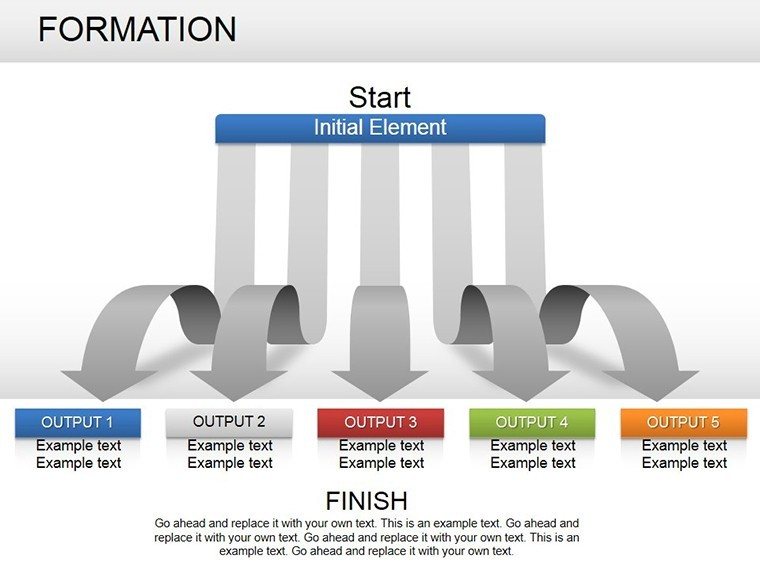
- Themed Variety: Cycles for recurring processes like feedback loops, graphs for trend lines, arrows for sequential steps, cubes for volumetric data like resource allocations.
- Theme Duality: Switch between light (clean whites) and dark (deep charcoals) with one master swap, maintaining legibility across outputs.
- Integration Ready: Hyperlink hotspots within diagrams for drill-downs, or export segments as images for reports.
These features shine in action - a project manager might elongate an arrow chain to map milestone dependencies, adding subtle shadows for depth that guides the eye naturally.
From Strategy Sessions to Lecture Halls: Deployment Guide
Kick off a team strategy huddle: Pull the cycle slide for ideation rounds - position nodes for brainstorm phases, curving lines to show iteration flows. Input phase labels via text overlays, then animate the cycle spin to reveal contributions sequentially. For data dives, grab a graph slide: Plot sales trajectories with editable axes, scaling y-values to forecast peaks. Arrows connect quarters, with color codes flagging outliers for quick spotlights.
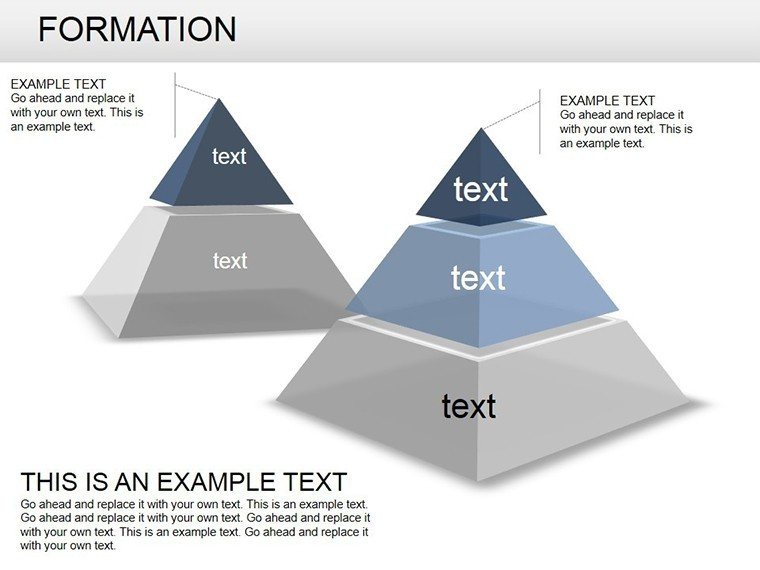
Educators diagramming ecosystems use cube stacks for trophic levels, stacking volumes to denote energy transfers - resize bases for population scales, rotating views for 3D-like clarity. Analysts in finance adapt arrow matrices for portfolio flows, directing from assets to yields with precise vectors. Step through customization: Select a slide, ungroup elements if needed, apply brand fills, regroup, and align - done in under two minutes per visual.
Workflow Wisdom for Peak Performance
- Modular Mixing: Combine slide types - overlay arrows on graphs for annotated trends, building hybrid views tailored to queries.
- Output Versatility: Save in PPTX for collab, PDF for shares, ensuring diagrams retain fidelity across formats.
- Scalability Checks: Zoom test on large screens; adjust line weights for distant views without pixelation.
A marketing lead visualizing campaign funnels could cube-segment audience segments, hollowing cores for drop-offs to pinpoint optimizations visually.
Outshining Standard Shapes
Basic PowerPoint diagrams often feel flat and forgettable; Formation's depth - editable in ways that feel organic - elevates them to strategic assets. Twenty slides that adapt, not dictate, for presentations that inform and impress. Yours for $22, a blueprint for visual eloquence.
Shape your story sharper - download the Formation PowerPoint Diagram Template and connect the dots with ease.
Frequently Asked Questions
What diagram types are included?
Cycles for loops, graphs for data plots, arrows for sequences, and cubes for 3D structures - 20 slides total.
Are light and dark themes fully editable?
Yes, toggle between them via masters, with all elements recolorable for your preferences.
How easy is it to integrate into existing decks?
Very - copy-paste slides directly, then edit to match your flow without reformatting.
Does it support animations?
Built-in paths for arrows and reveals for graphs, customizable to your pacing needs.
Is it compatible with older PowerPoint?
Designed for .pptx, works back to PowerPoint 2010 with core features intact.
Can I use it for non-business presentations?
Absolutely - versatile for education, science, or any field needing clear visual connections.
Good for
- Project roadmaps and sprint plans
- Product launch timelines
- Quarterly or annual review decks
- Company history and milestone summaries
Licence
reviews
Made a school project presentation with this and finished fast.
The chart slides looked decent on the projector.
A few layouts were confusing at first.
I liked the simple arrows and labels.
Worked better than building slides from scratch.
FAQ
Will it work in Google Slides?
Are fonts embedded?
Can I use this for client work?
What's the refund policy?
Do you update the template after purchase?
Similar templates
See all Powerpoint Diagrams →
All 20 slides