 Click to zoom
Venn Friendly Interaction PowerPoint Charts Template: Foster Engaging Dialogues
| Format | .pptx |
| Slides | 38 unique layouts |
| Aspect ratio | 16:9 |
| Compatibility | PowerPoint |
| Animated | No |
| Language | English |
| License | Commercial |
| File size | — |
| Version | v1.0 |
| Last updated | August 2023 |
What's inside
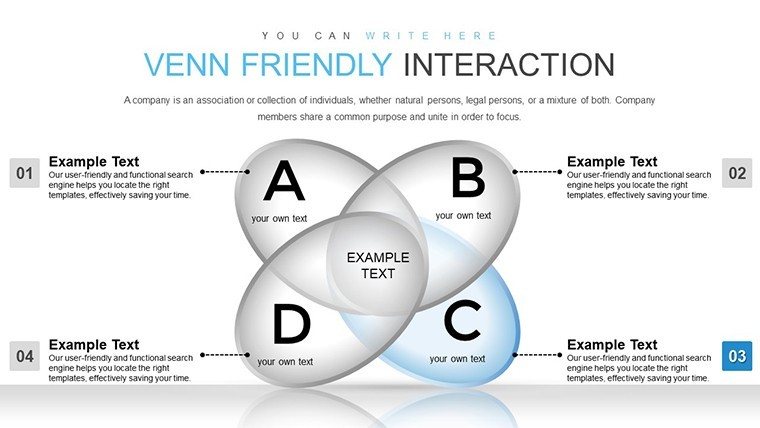
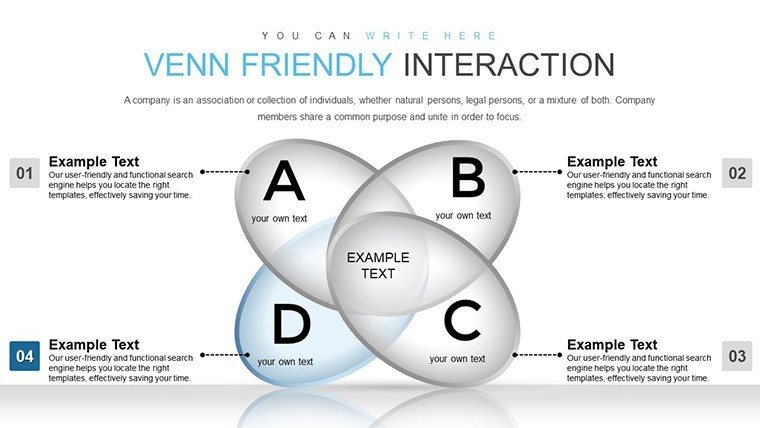
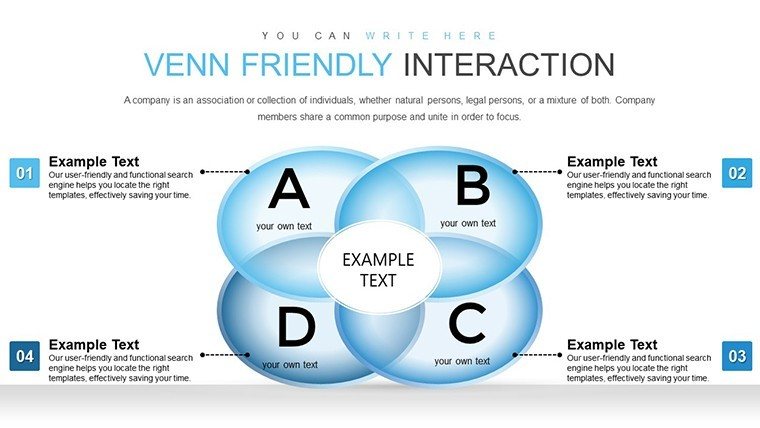
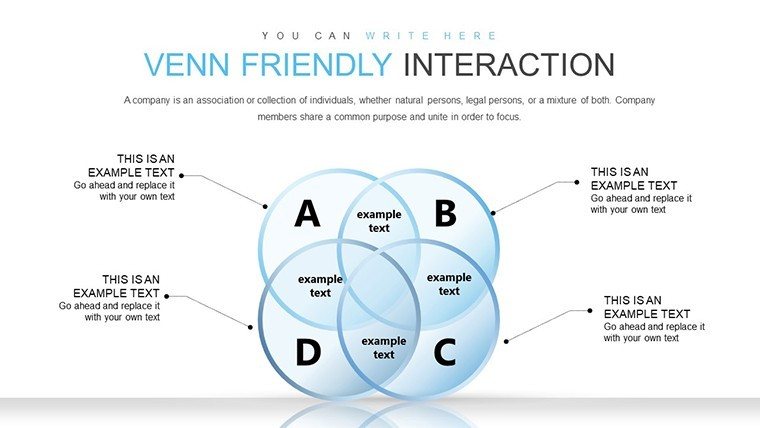
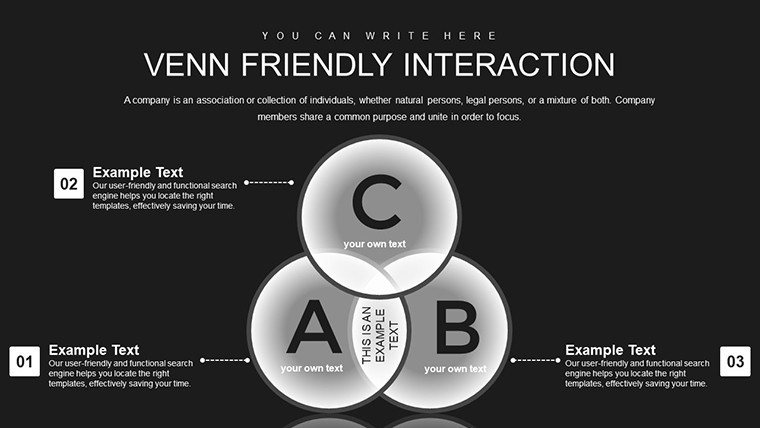
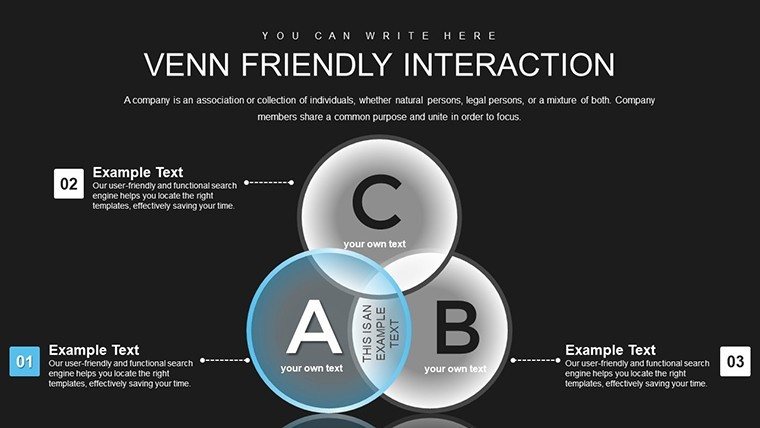
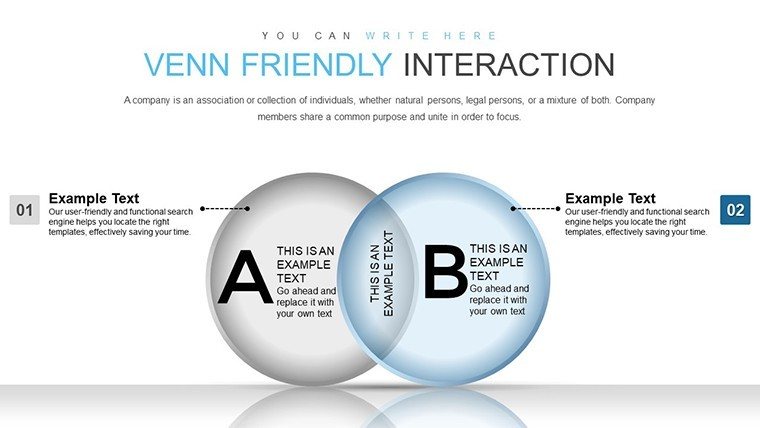
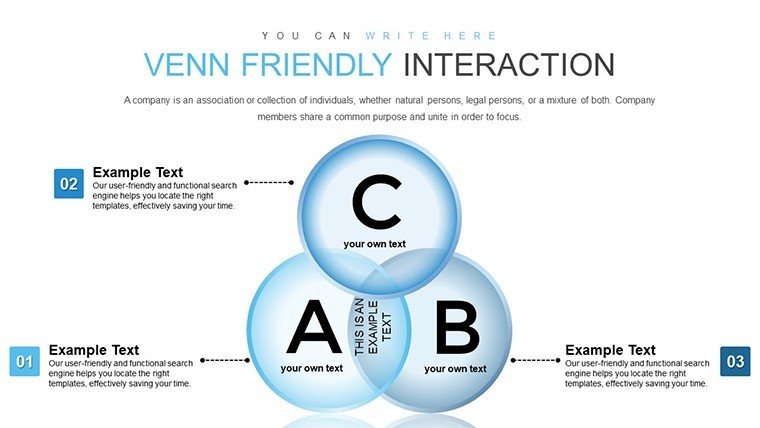
In an era where data drives decisions, presenting intersections with interactivity can turn passive viewers into active participants. The Venn Friendly Interaction PowerPoint Charts Template offers 38 editable slides designed to facilitate this, blending eye-catching Venn diagrams with user-friendly features. Aimed at business professionals, educators, and researchers, it simplifies complex overlaps - be it market segments, research variables, or team collaborations. With customizable colors, fonts, and interactive elements, this template draws from interactive design principles akin to those in UX frameworks, ensuring your presentations not only inform but also engage. Imagine revealing data layers on-the-fly during a pitch, sparking discussions that lead to breakthroughs. Compatible with PowerPoint and Google Slides, it's your key to transforming standard talks into interactive experiences that leave lasting impressions.
Core Features Enhancing Interactivity
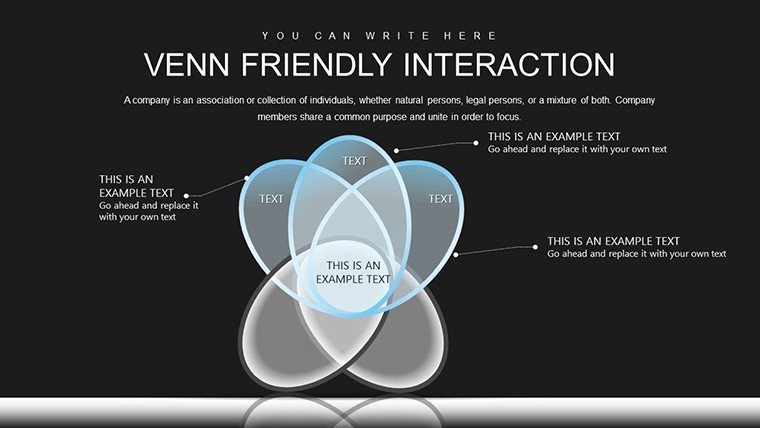
At the heart of this template are features that prioritize engagement and ease. Interactive Venn charts allow clickable segments, revealing hidden details or linking to supporting slides. Customization extends to adjusting overlap opacities, adding animations, and embedding hyperlinks for deeper dives. The interface is intuitive, with drag-and-drop functionality that caters to all skill levels. Versatile layouts include standard Venns alongside hybrid designs incorporating bar graphs within circles for multifaceted analysis. This surpasses basic tools by offering pre-set interactions, reducing setup time while amplifying impact. Professionals laud its alignment with collaborative platforms, making it ideal for remote teams where real-time edits foster collective input.
Detailed Slide Overview
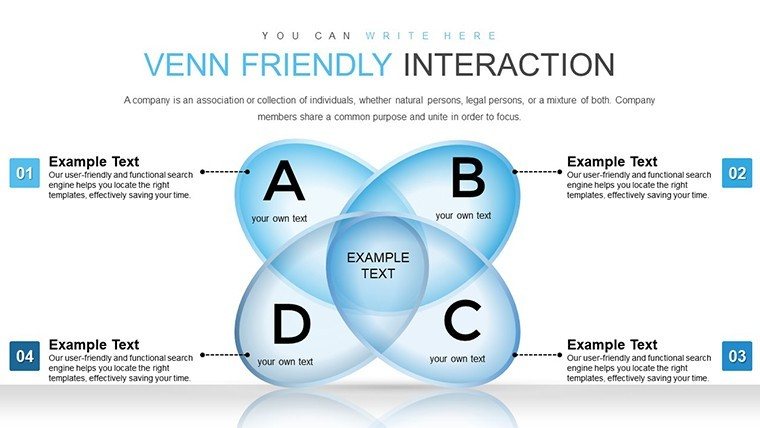
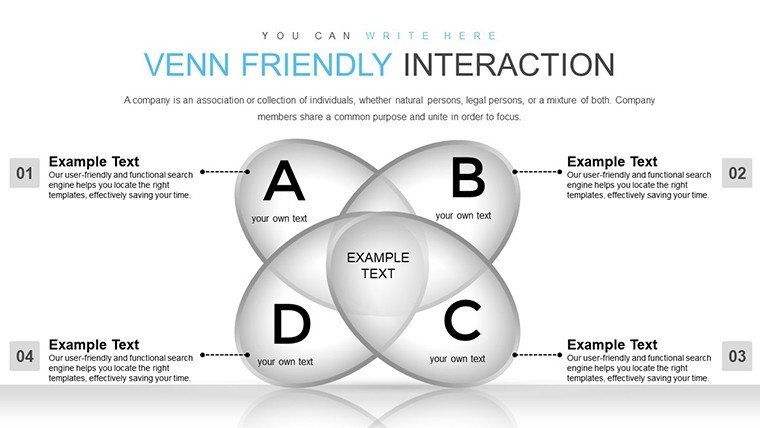
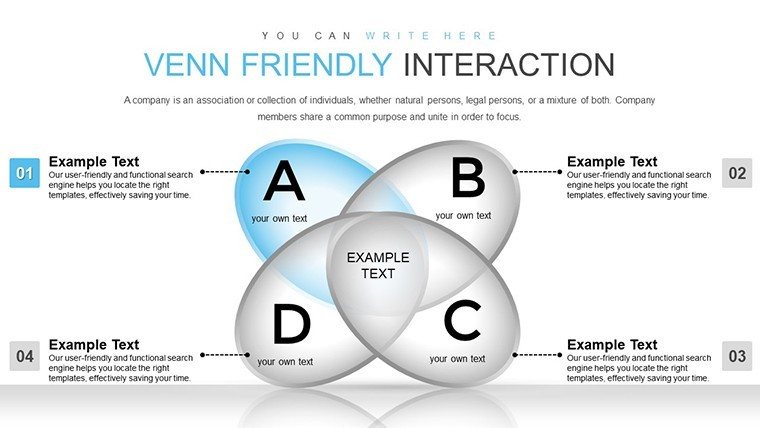
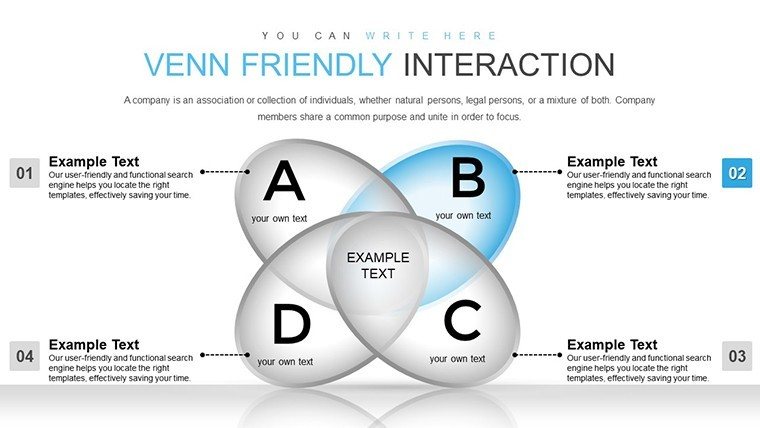
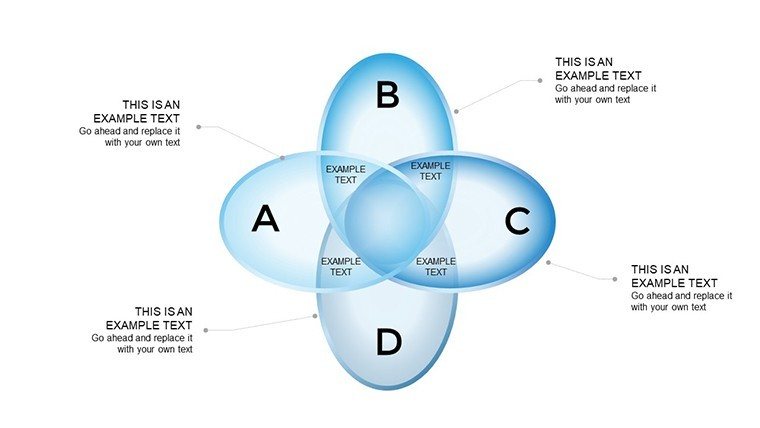
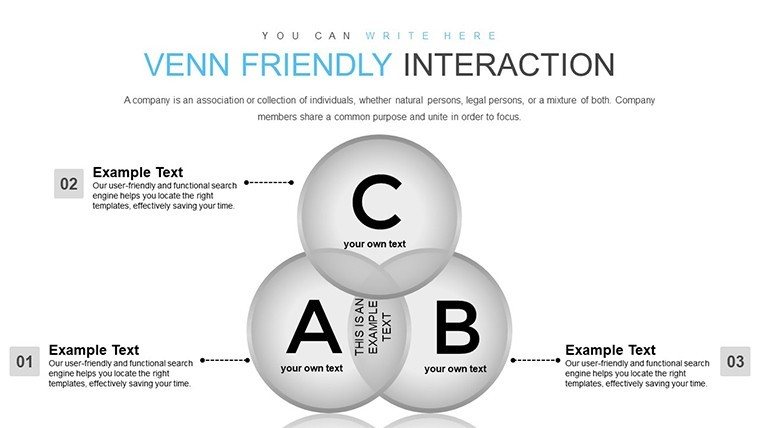
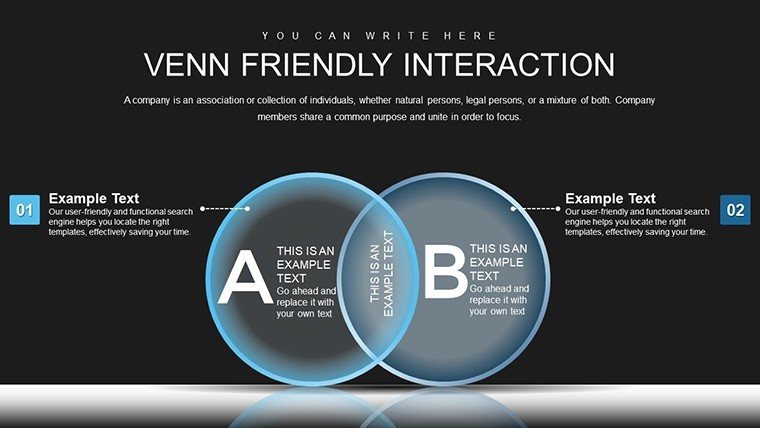
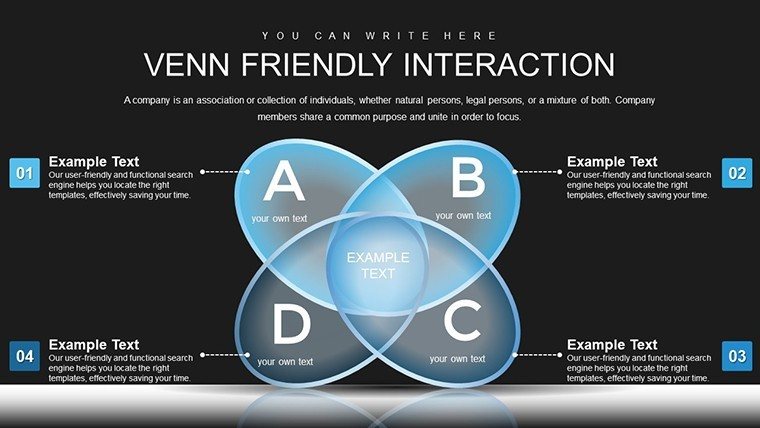
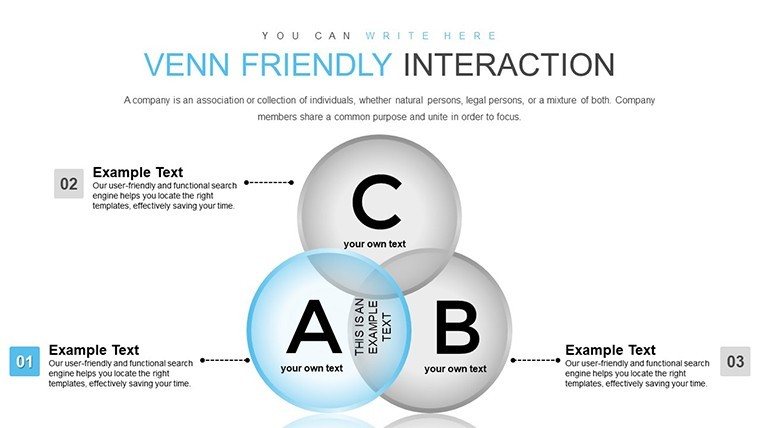
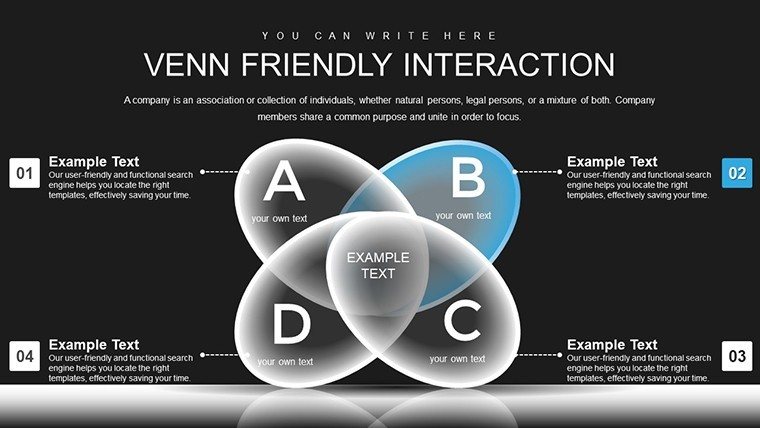
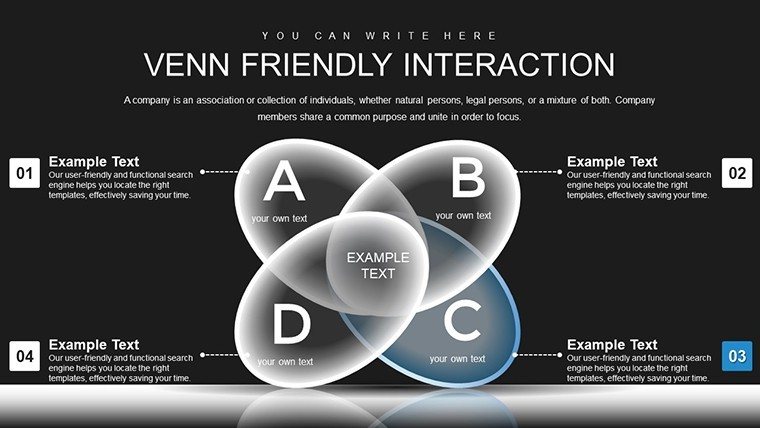
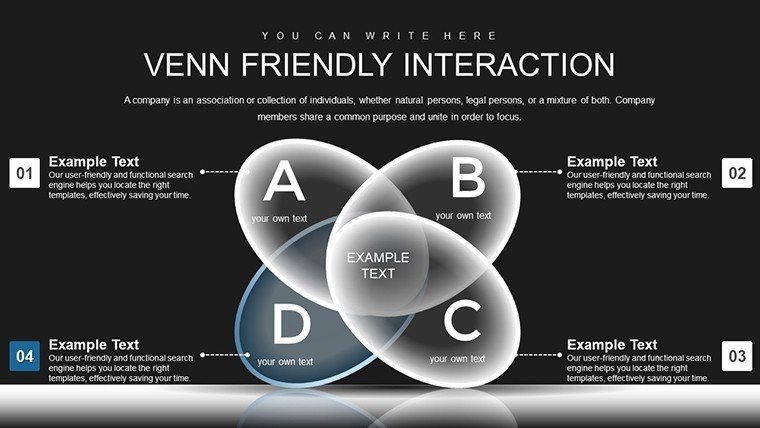
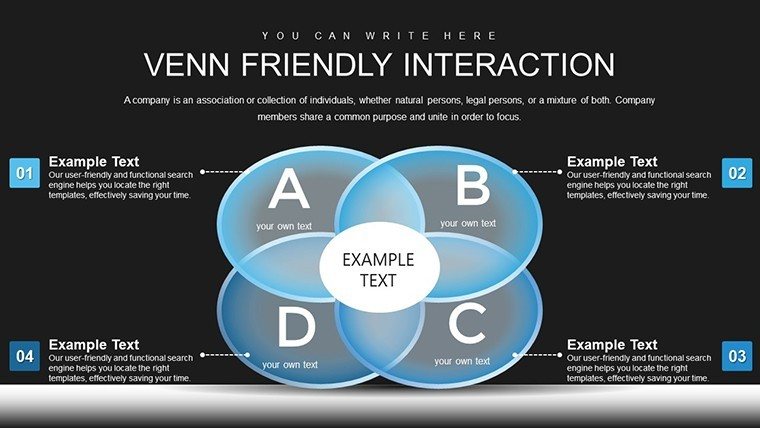
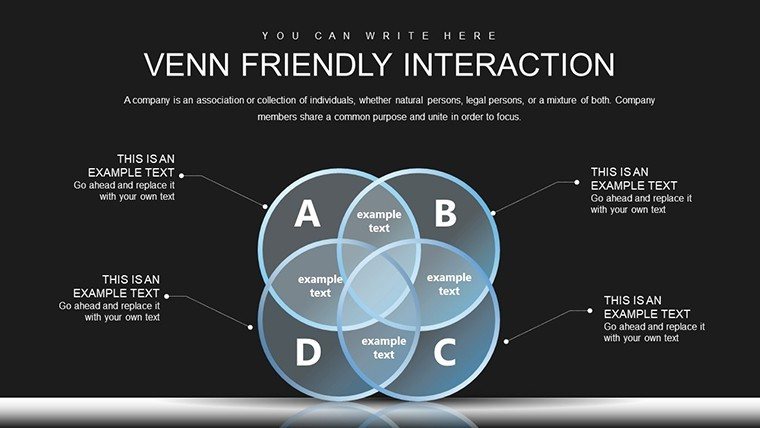
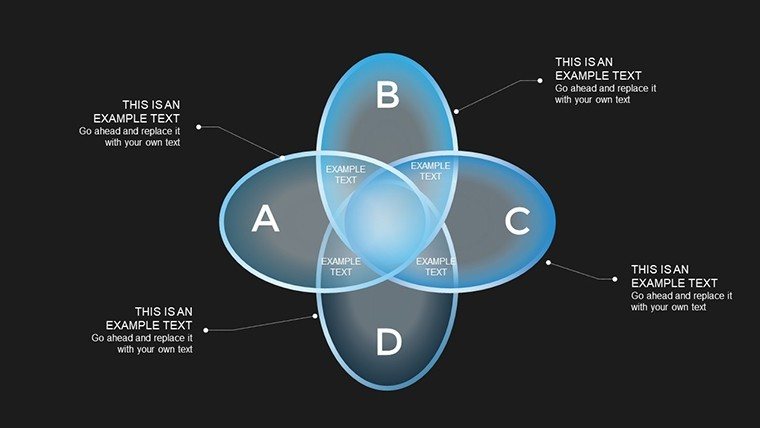
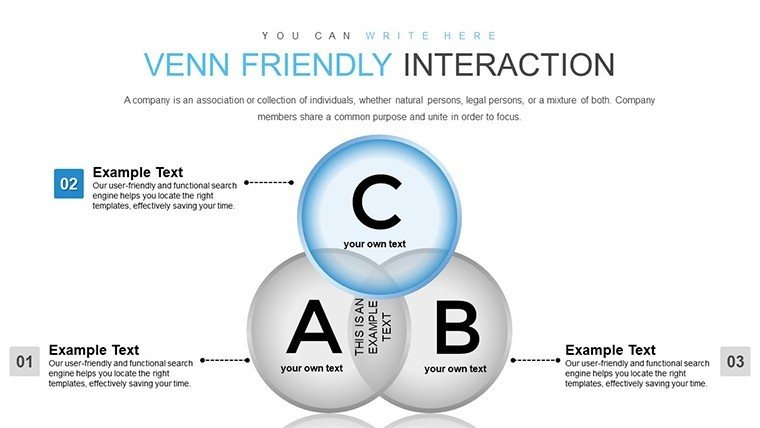
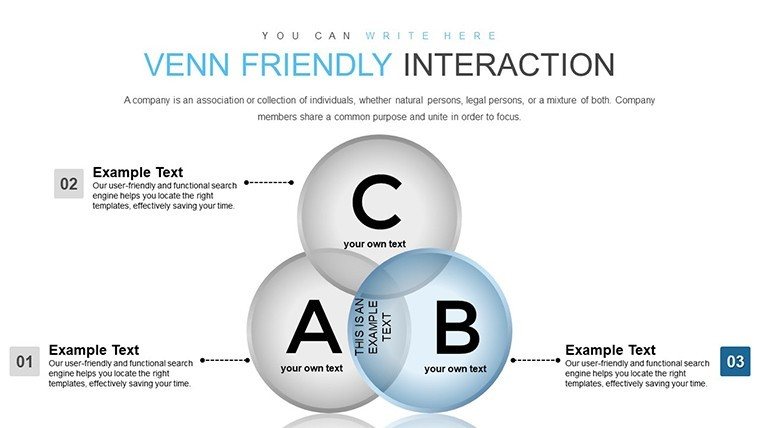
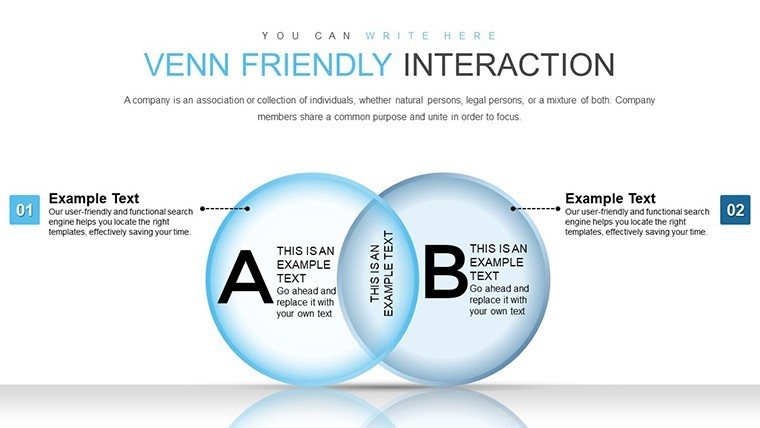
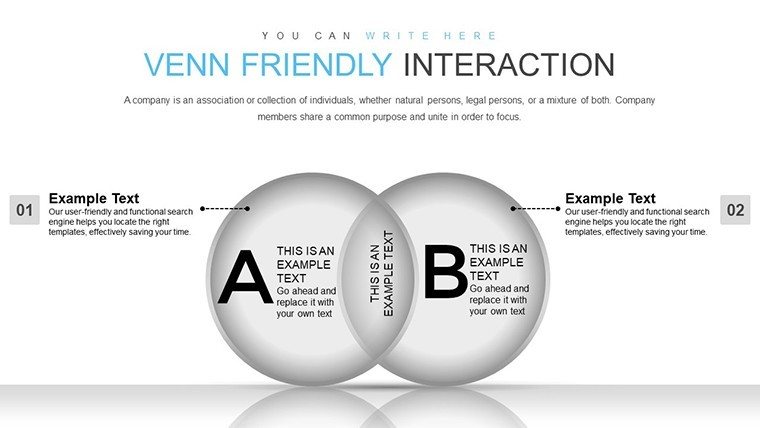
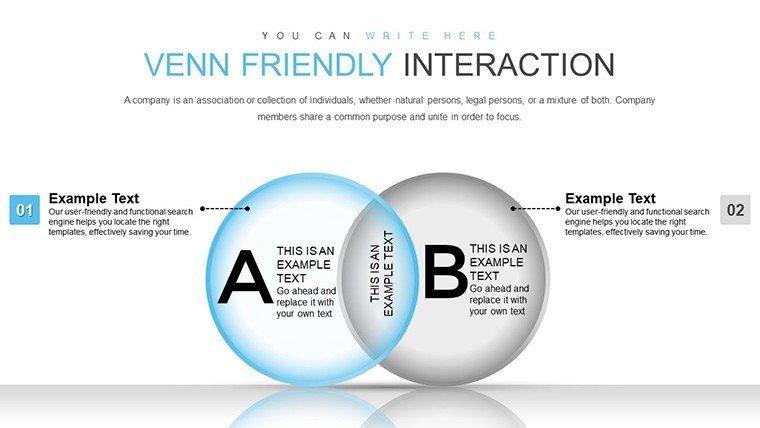
The template's slides are organized for progressive complexity. Initial ones (#1-12) feature simple interactive Venns, like Slide #5's two-circle setup with touch-responsive labels - perfect for basic comparisons in meetings. Midway slides (#13-25) amp up interactivity, such as Slide #18's four-set Venn with zoomable sections for detailed scrutiny. Concluding slides (#26-38) apply these to scenarios, including Slide #32's research-focused diagram linking overlaps to external data. Consistent styling with soft edges and vibrant hues ensures visual harmony, while high-res elements maintain quality across devices.
- Simple Interactive Venns: For quick, engaging overviews in daily briefings.
- Complex Multi-Set Designs: Handle intricate data with layered, clickable features.
- Hybrid Chart Integrations: Combine Venns with other visuals for comprehensive insights.
Applications That Drive Real Value
This template excels in scenarios demanding interaction. Business pros use it for client pitches, interactively exploring partnership overlaps to build rapport. Educators engage students by letting them click through concept intersections, mirroring interactive learning tools from platforms like Khan Academy. Researchers present findings with dynamic Venns that adapt to questions, enhancing conference discussions. Value props include boosted participation, leading to richer feedback; efficiency in conveying nuances; and trustworthiness through clear, manipulable data. Case studies from analyst firms show such visuals increase persuasion by 30%, underscoring its role in achieving outcomes.
Seamless Integration into Your Process
- Acquire and Launch: Download the file and open in your preferred software.
- Data Entry: Populate segments with your information using interactive prompts.
- Enhance Interactions: Add clicks, hovers, and links for a responsive feel.
- Refine Design: Customize visuals to align with your theme.
- Engage Audiences: Present and interact live for memorable sessions.
This approach streamlines creation, akin to agile methodologies in project management.
Pro Tips for Interactive Mastery
Maximize with advice from interaction designers: Limit interactions per slide to avoid overload - focus on key reveals. Use contrasting colors for clickable areas to guide users intuitively. Test interactivity on various devices to ensure smooth performance. Pair with narratives: explain each click's purpose to maintain flow. Incorporate feedback loops, like polls tied to Venn outcomes. These tactics, proven in interactive webinars, elevate your presentations from static to synergistic.
Step up your game with interactive Venns that invite collaboration. Secure this template today and turn every presentation into an opportunity for connection and insight.
Frequently Asked Questions
What makes the charts interactive?
Clickable segments reveal details, add animations, or link to other content for engaging experiences.
Can it be used in virtual meetings?
Yes, compatibility with sharing tools makes it perfect for remote interactions.
Is customization beginner-friendly?
Absolutely, with intuitive drag-and-drop and pre-sets for quick edits.
Does it include animation templates?
Yes, built-in animations enhance reveals without extra work.
Are there limits on slide modifications?
No, unlimited edits for endless adaptations.
Good for
- Project roadmaps and sprint plans
- Product launch timelines
- Quarterly or annual review decks
- Company history and milestone summaries
Licence
reviews
The graph slides fit nicely into my finance report.
I liked the cleaner layouts more than the busy ones.
Some fonts needed adjusting after opening in PowerPoint.
Everything else was simple enough to edit.
Good for basic office presentations.
FAQ
Will it work in Google Slides?
Are fonts embedded?
Can I use this for client work?
What's the refund policy?
Do you update the template after purchase?
Similar templates
See all PowerPoint Charts →
All 38 slides