 Click to zoom
Production and Delivery Process PowerPoint Charts Template
| Format | .pptx |
| Slides | 39 unique layouts |
| Aspect ratio | 16:9 |
| Compatibility | PowerPoint |
| Animated | No |
| Language | English |
| License | Commercial |
| File size | — |
| Version | v1.0 |
| Last updated | August 2023 |
What's inside
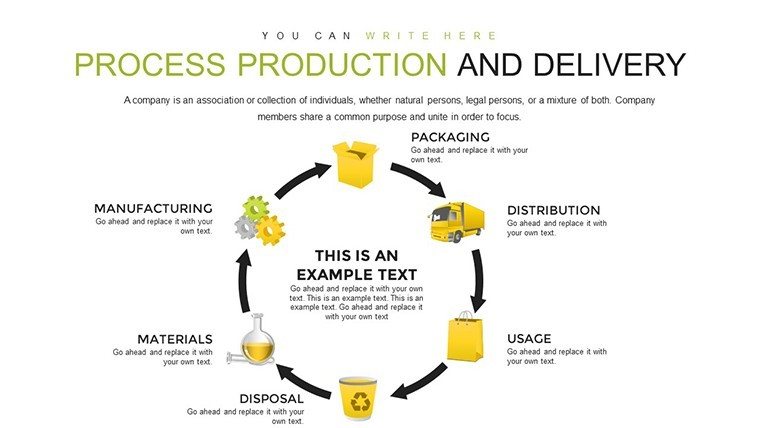
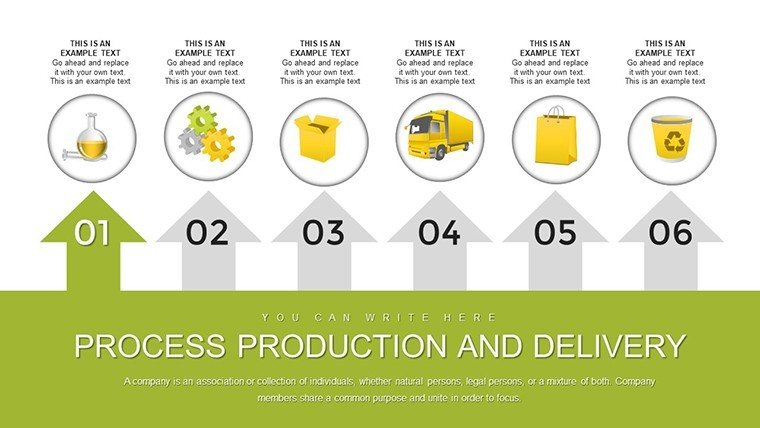
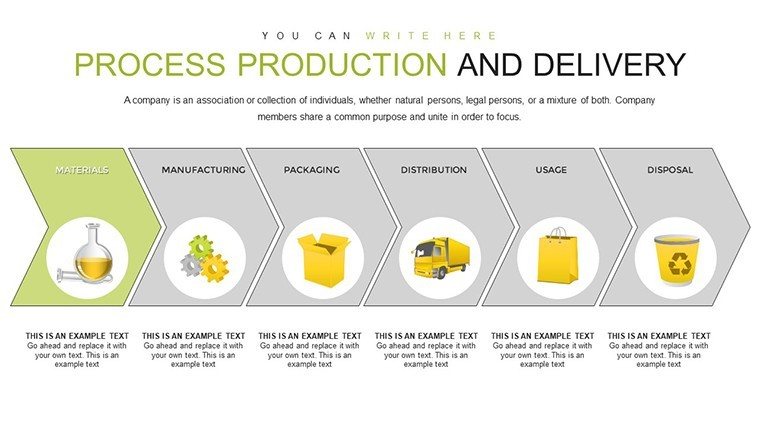
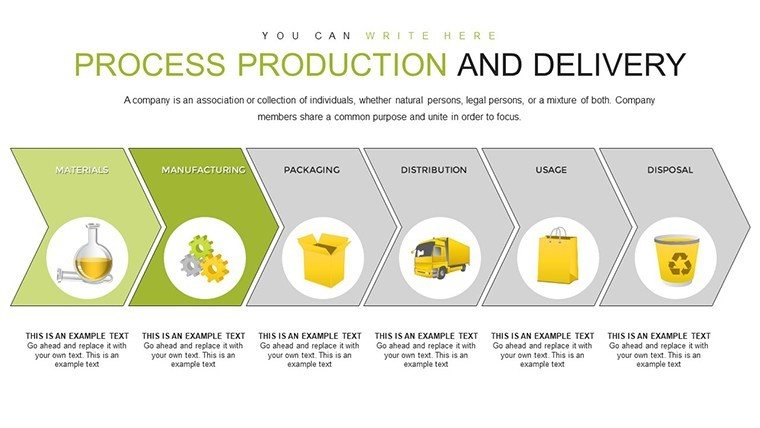
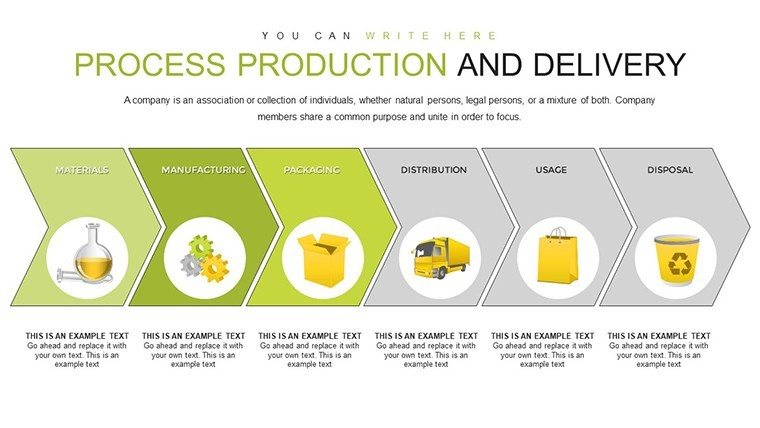
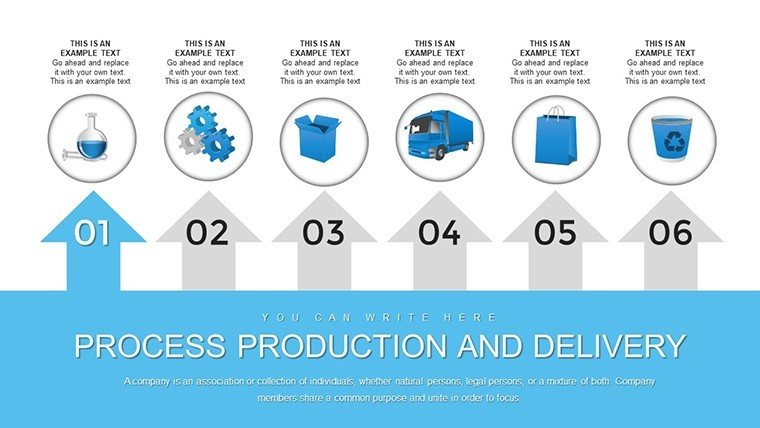
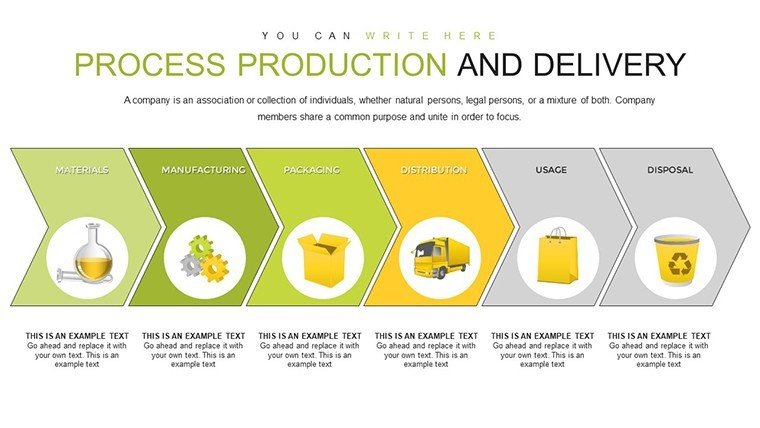
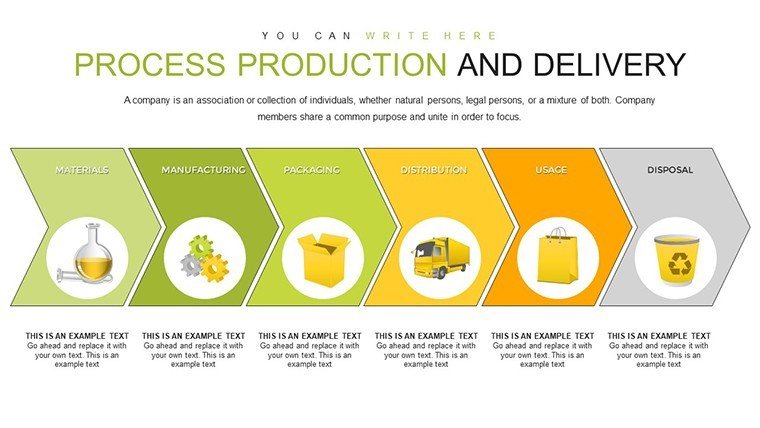
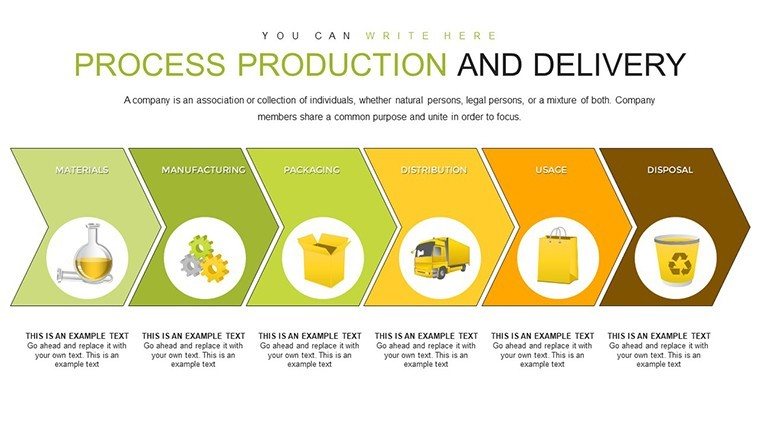
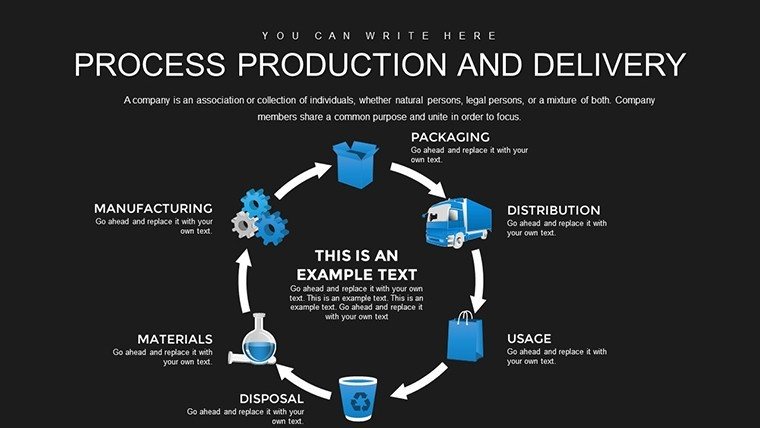
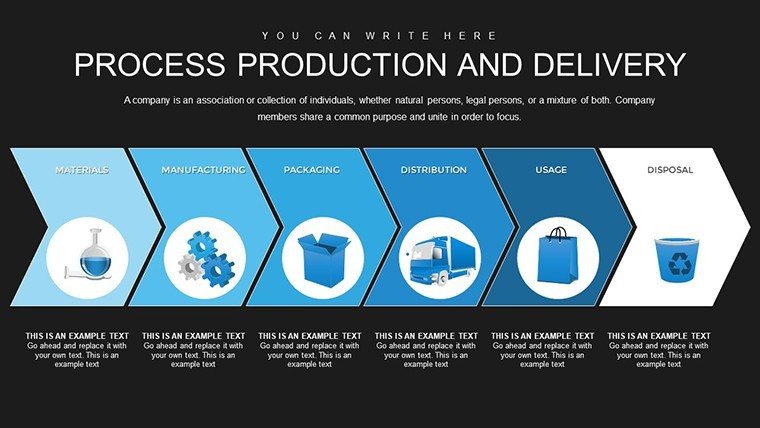
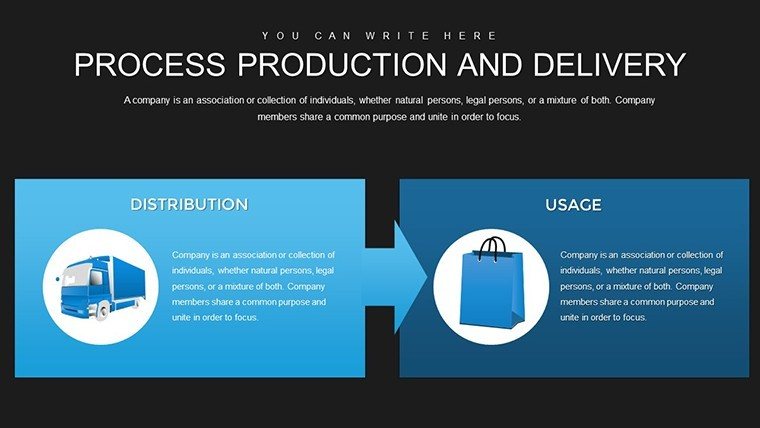
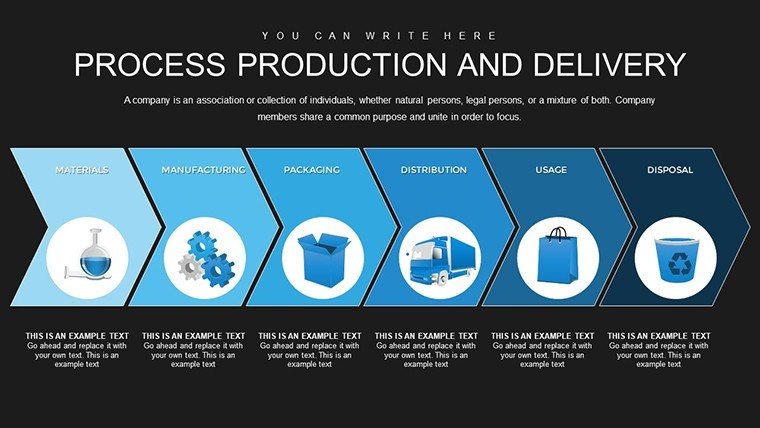
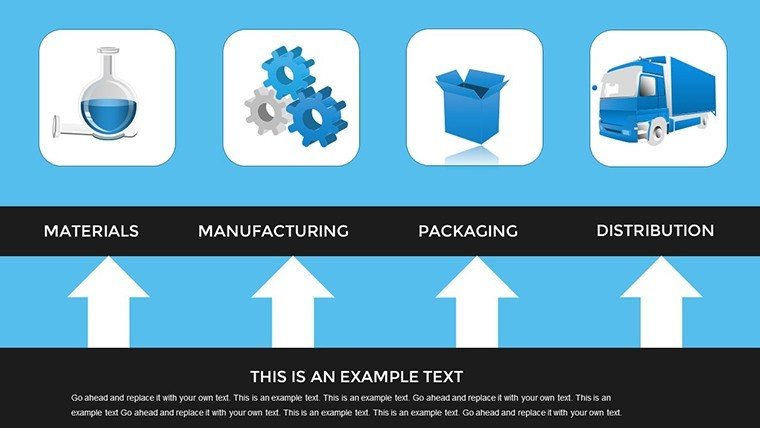
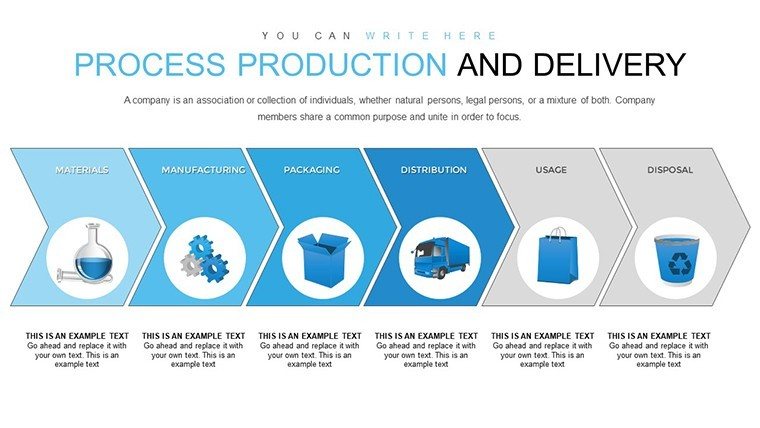
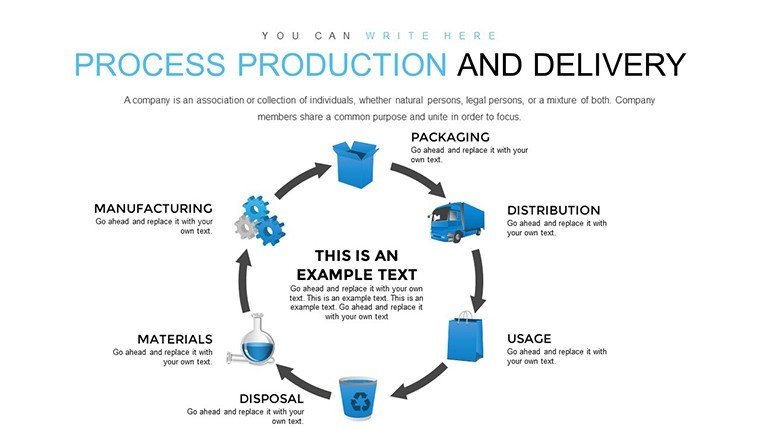
Navigating the intricacies of production and delivery can be challenging, but with the Production and Delivery Process PowerPoint Charts Template, you gain a powerful ally to visualize and simplify these workflows. Boasting 39 editable slides, this template is crafted for professionals in manufacturing, logistics, and education who seek to convey complex processes with clarity and impact. Picture transforming a tangled supply chain into a streamlined arrow diagram that guides your team through each stage, from raw materials to customer delivery. Rooted in industry standards like those from the Supply Chain Council’s SCOR model, it offers customizable visuals that highlight efficiencies, bottlenecks, and improvements, making it easier to drive operational excellence. Whether presenting to executives or teaching students, this tool turns data into stories that resonate, fostering better understanding and strategic decisions.
Core Features That Drive Efficiency
This template's strength lies in its visual excellence, featuring vibrant colors and clean layouts that make information pop without overwhelming viewers. Every slide is fully customizable - tweak arrows for directionality, adjust palettes to align with your brand, and modify texts for specificity. A diverse array of chart options, including flowcharts, process maps, and arrow sequences, caters to various industries, ensuring relevance for logistics pros or project coordinators alike. Its user-friendly interface means even novices can create polished presentations quickly, saving valuable time.
Comprehensive Slide-by-Slide Insights
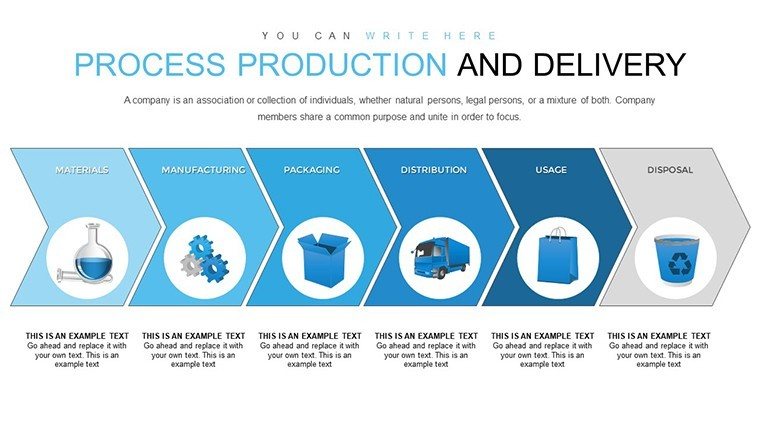
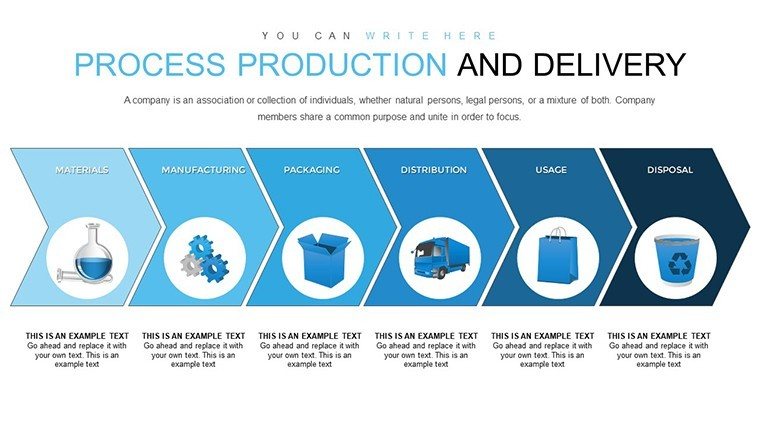
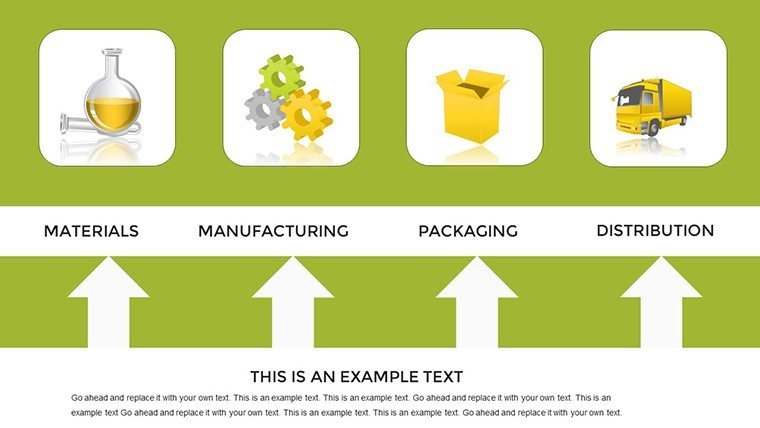
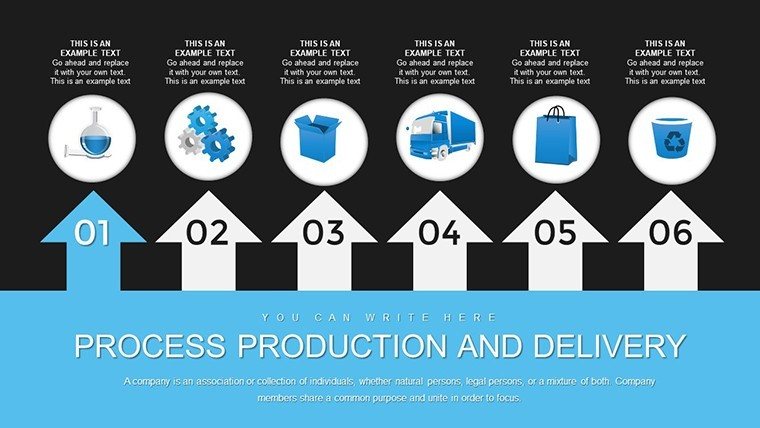
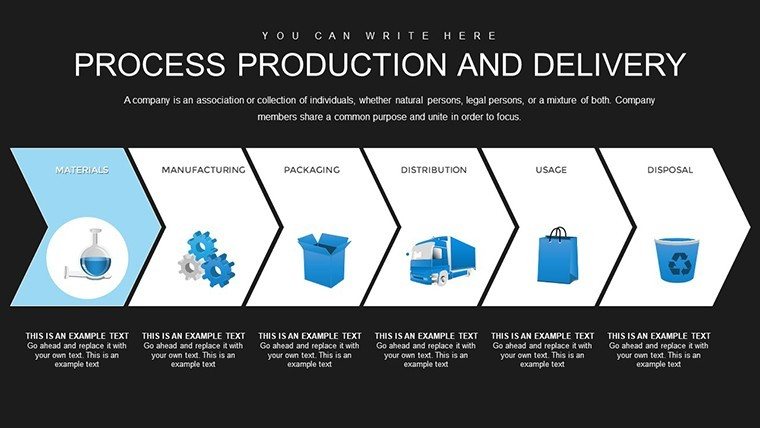
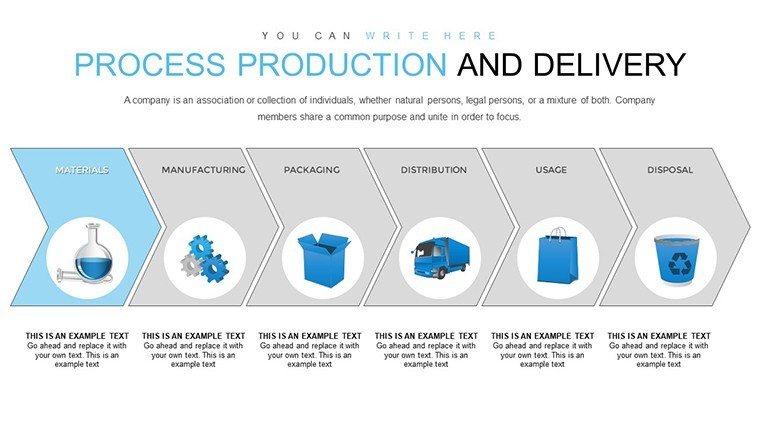
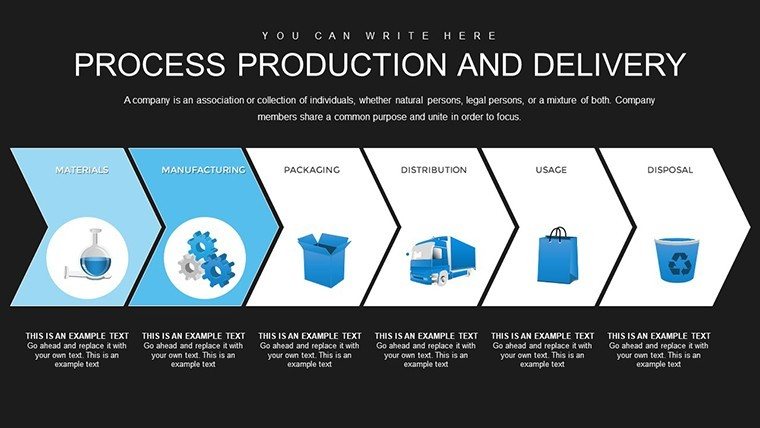
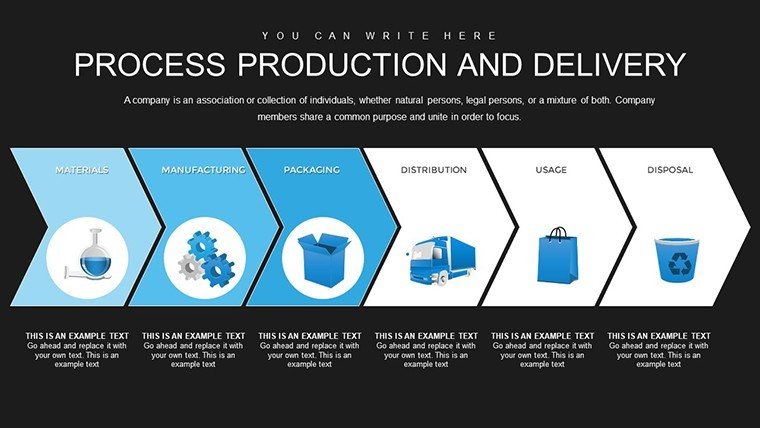
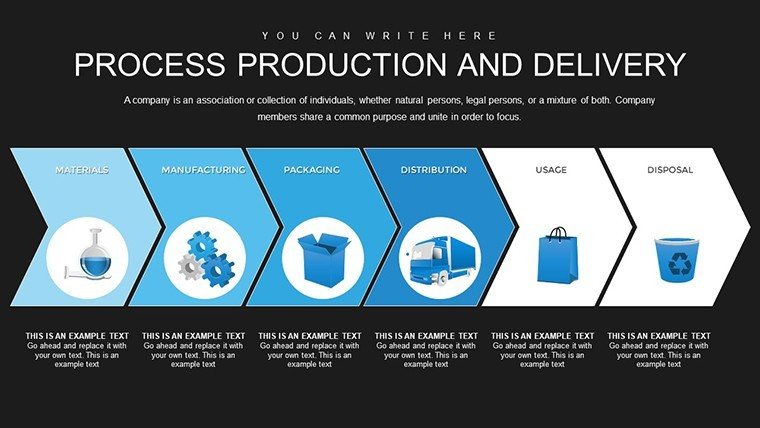
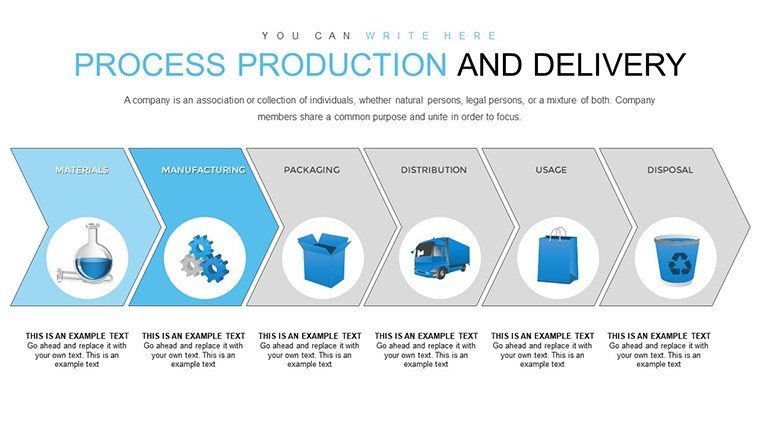
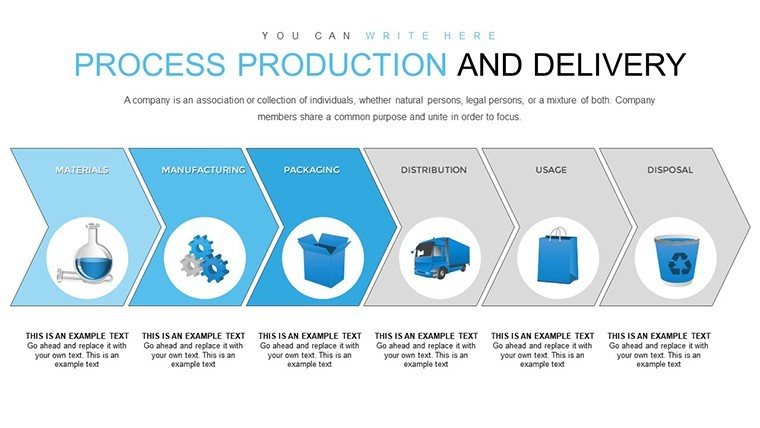
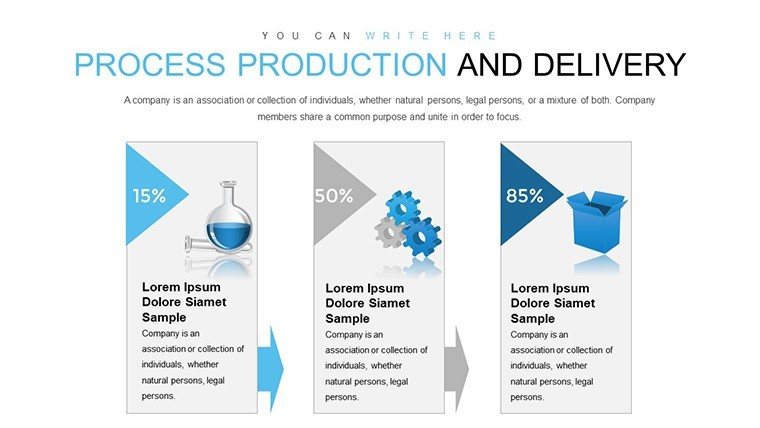
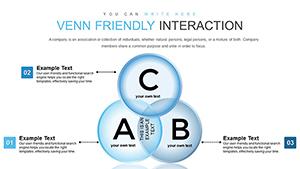
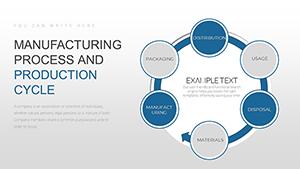
The 39 slides are thoughtfully organized for logical progression. Early slides (1-8) focus on production overviews, with block diagrams depicting input-output flows and cycle time charts for efficiency metrics. Slides 9-16 emphasize manufacturing stages, using arrow chains to illustrate assembly lines, quality checks, and inventory management - essential for spotting waste as per Lean principles.
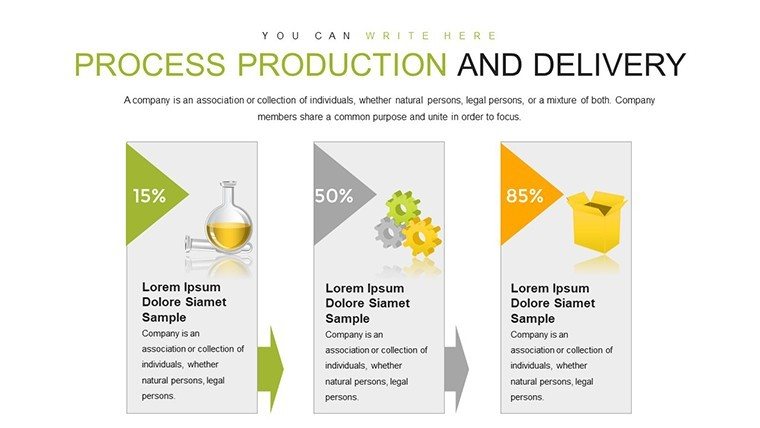
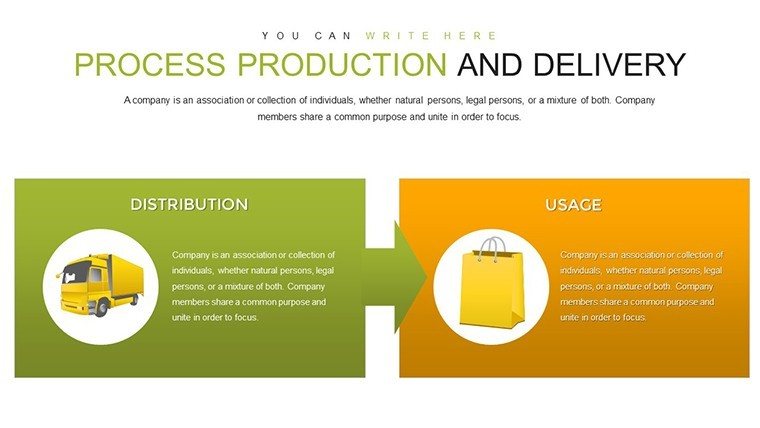
Delivery aspects shine in slides 17-25, featuring logistics maps with route optimizations, timeline arrows for shipping schedules, and pie charts for distribution breakdowns. For integrated views, slides 26-32 combine production and delivery in end-to-end process flows, including risk assessment matrices. The final slides (33-39) provide summary dashboards, KPI trackers, and improvement roadmaps, complete with icons for quick scans during reviews.
Tailored Applications for Diverse Users
Professionals in supply chain management can use it to map out vendor integrations, reducing lead times as seen in case studies from companies like Toyota with their Just-In-Time systems. Educators simplify concepts for students, breaking down processes into digestible visuals that enhance retention, ideal for business courses on operations. Businesses leverage it for internal reports, client pitches, or training sessions, where arrow diagrams clarify workflows and foster collaboration.
In meetings, it aids in pinpointing delays, while for pitches, it demonstrates capability with professional polish. The template's benefits include heightened engagement through visuals, time savings via pre-designs, and trustworthiness from structured data presentation, all while adhering to best practices in process visualization.
Strategic Tips for Optimal Use
- Highlight Key Stages: Use bold arrows to emphasize critical paths, drawing attention to areas needing improvement.
- Incorporate Real Data: Populate charts with actual metrics for authenticity, like throughput rates from your ERP system.
- Adapt for Scale: For large operations, layer slides with zoomable details; for small teams, keep it concise.
- Facilitate Discussions: Add notes sections for annotations during collaborative edits.
- Evaluate Outcomes: After use, review audience feedback to iterate on chart designs for future presentations.
Drawing from logistics experts, these approaches ensure your slides not only inform but influence, surpassing basic PowerPoint arrows with thematic coherence and depth.
Empowering Your Processes for Success
With global supply chains growing more complex - as noted in Deloitte's reports on resilience - this template equips you to stay ahead. It tackles pain points like miscommunication or overlooked efficiencies by providing a clear, visual framework. Versatile for any scale, from startups optimizing deliveries to enterprises managing global production, its .pptx format ensures broad accessibility. Envision ending a board meeting with consensus on process enhancements, all sparked by your compelling charts. This isn't just a template; it's a catalyst for better operations. Take the next step - customize and deploy this essential tool today.
Frequently Asked Questions
Are all elements in the slides customizable?
Yes, from arrows to colors and texts, everything is editable to suit your specific process needs.
Can this be used outside manufacturing?
Sure - it's adaptable for service industries, like event planning or software deployment processes.
Is compatibility limited to PowerPoint?
Primarily for PowerPoint, but convertible to Google Slides with minor adjustments.
How do I handle complex processes?
Use multi-slide sequences to break them down, linking with consistent arrow themes for continuity.
Does it include icons or graphics?
Yes, a library of process-related icons is embedded for enhancing visual appeal.
Good for
- Project roadmaps and sprint plans
- Product launch timelines
- Quarterly or annual review decks
- Company history and milestone summaries
Licence
reviews
Production and Delivery Process template has 39 slides with arrow chains and flowcharts in vibrant colors. Logistics manager loved the end-to-end maps for supply chain presentation - highlighted bottlenecks effectively.
Manufacturing pro: block diagrams for cycle times and quality checks are detailed. Clean layouts, editable arrows. A bit critical of icon variety but saved massive formatting time.
Student project on operations: pie charts for distribution and KPI trackers worked well. .pptx compatible everywhere. Practical for visualizing Lean principles.
Under deadline for client pitch: route optimization maps looked professional. High-contrast good for rooms. Some process slides repetitive but comprehensive overall.
The arrow sequences for assembly lines made complex workflows clear. Professional tone suits exec meetings. Easy data integration from ERP.
Mixed review: great for training sessions with risk matrices, vibrant design pops. Wish more variations for service industries but solid for manufacturing focus.
FAQ
Will it work in Google Slides?
Are fonts embedded?
Can I use this for client work?
What's the refund policy?
Do you update the template after purchase?
Similar templates
See all PowerPoint Charts →
All 39 slides