 Click to zoom
Venn Diagrams PowerPoint Charts: Unlock Problem-Solving Potential
| Format | .pptx |
| Slides | 30 unique layouts |
| Aspect ratio | 16:9 |
| Compatibility | PowerPoint |
| Animated | No |
| Language | English |
| License | Commercial |
| File size | — |
| Version | v1.0 |
| Last updated | May 2024 |
What's inside
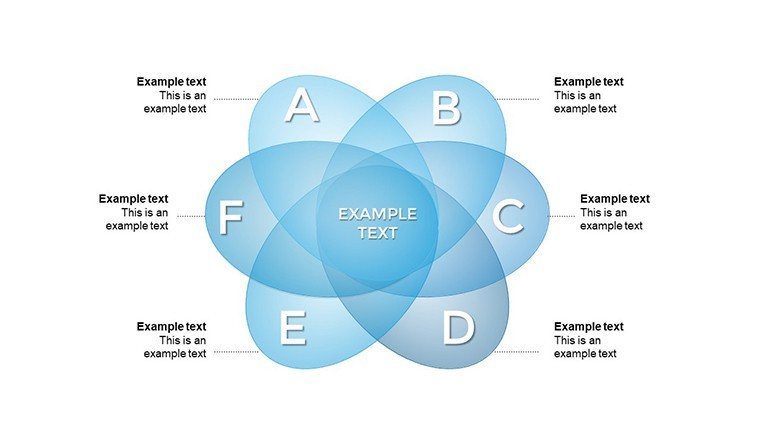
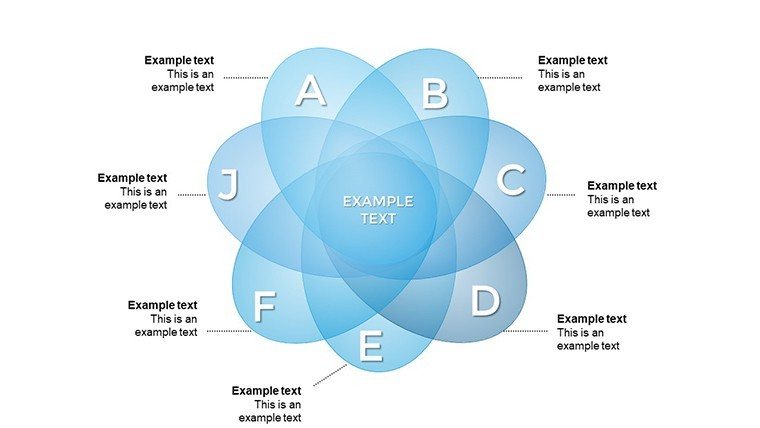
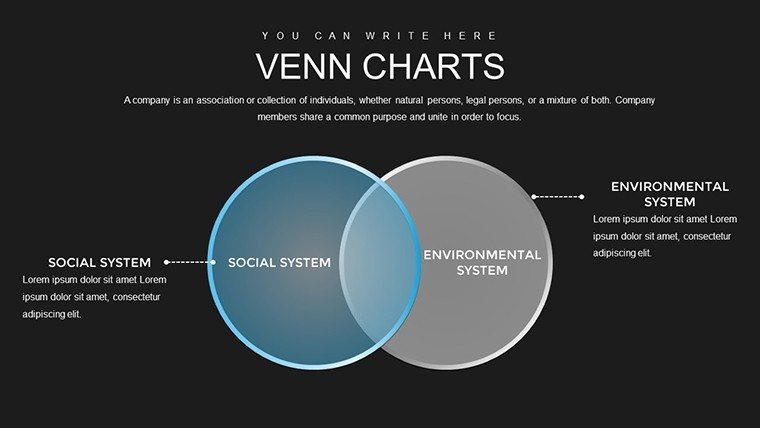
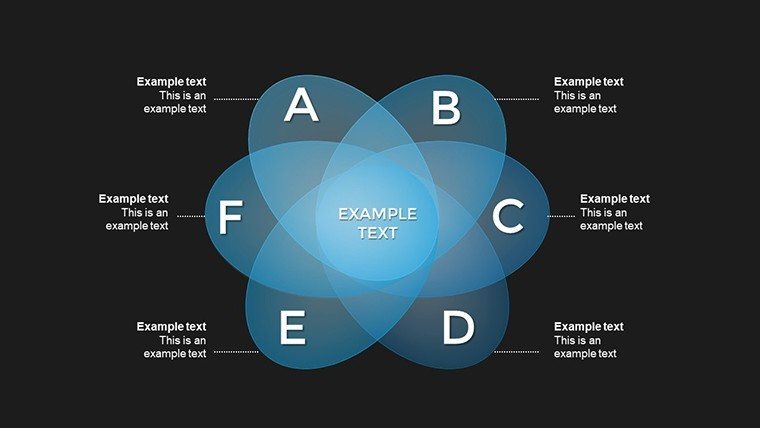
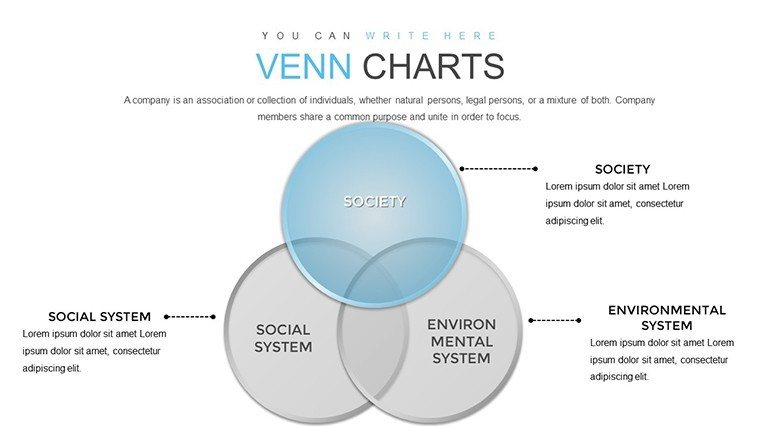
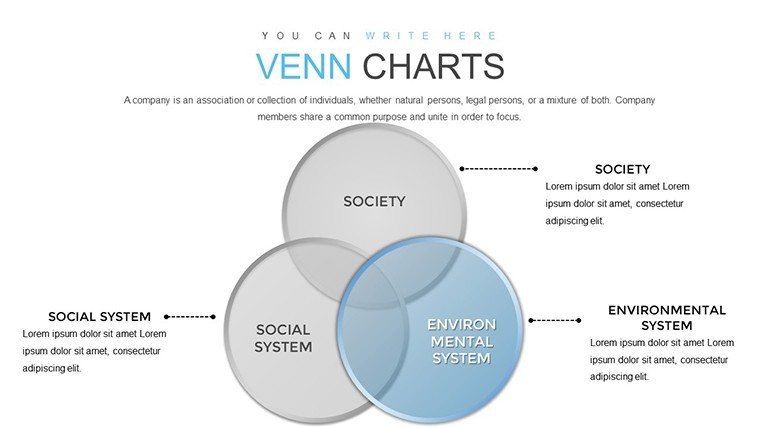
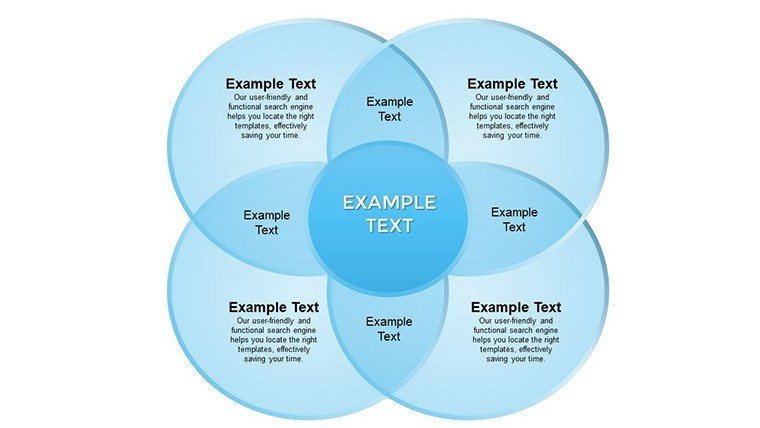
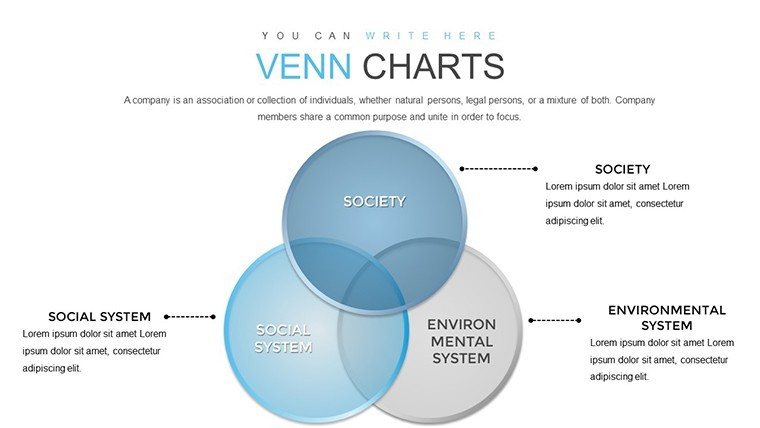
When tackling multifaceted problems, clarity is your greatest ally. Our Venn Diagrams PowerPoint Charts Template provides just that, with 30 editable slides dedicated to visualizing overlaps, distinctions, and connections in data. This multipurpose tool is a boon for professionals navigating complex scenarios, from strategic planning in finance to curriculum design in education. By layering circles to represent sets and intersections, it demystifies relationships that might otherwise remain obscured in text-heavy reports.
Envision a healthcare administrator mapping patient care pathways, where Venn overlaps highlight shared resources between departments, streamlining operations. Or a finance analyst using it to compare investment portfolios, pinpointing common risks for better mitigation. Fully compatible with PowerPoint in PPTX format, this template offers seamless navigation and customization, ensuring your presentations are not only informative but transformative. Drawing on set theory principles, it helps users across industries communicate ideas with precision, fostering collaboration and innovation without the steep learning curve of custom design.
Core Features for Effective Visualization
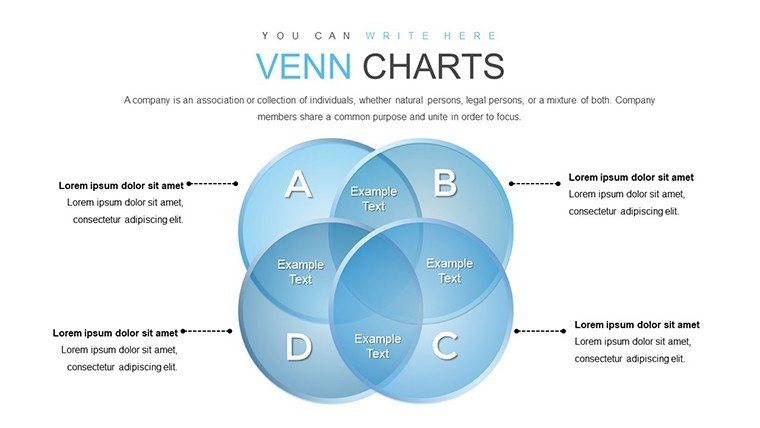
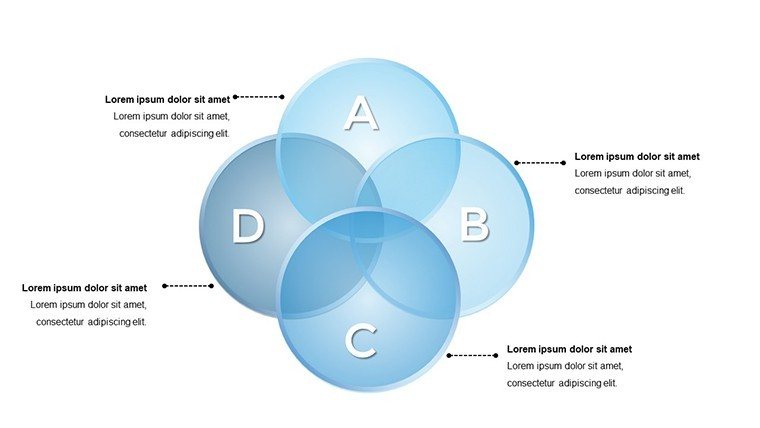
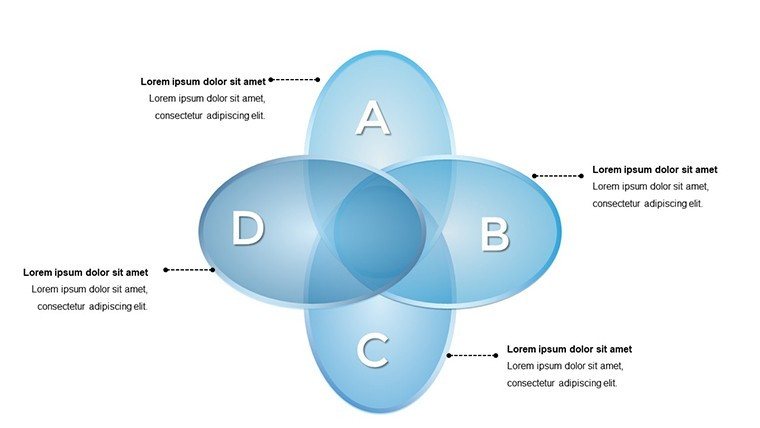
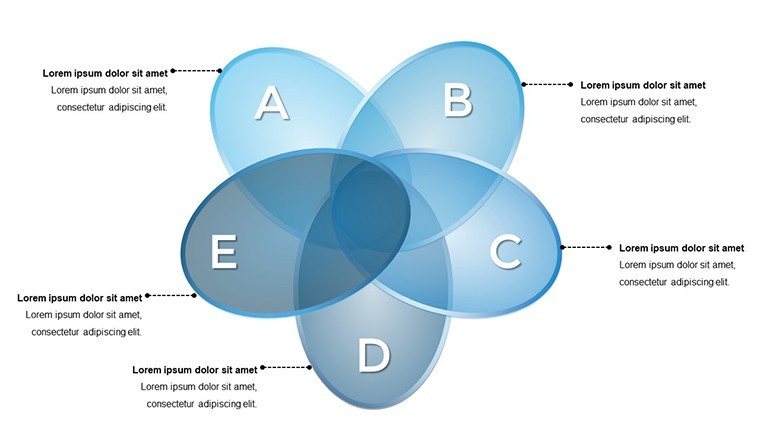
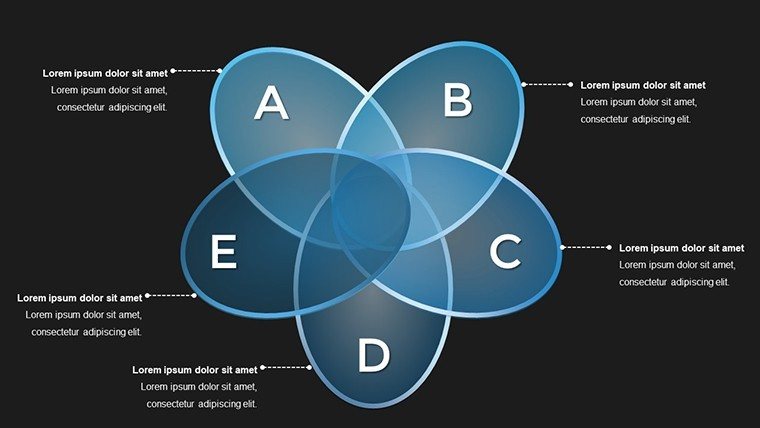
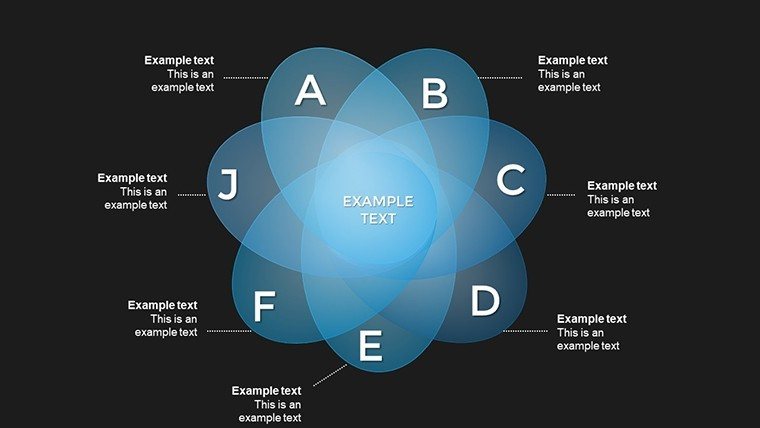
At its heart, this template leverages Venn's timeless structure with modern twists. Each slide allows for 2-5 circle configurations, adaptable for simple binary comparisons or intricate multi-set analyses. Customization extends to every detail, aligning with your brand's visual language while maintaining focus on content delivery.
- Multi-Set Venns: From basic two-circle overlaps for pros/cons to five-circle complexities for ecosystem mappings.
- Color and Font Flexibility: Swap schemes to denote categories, like blues for stability in financial models.
- Icon and Label Integration: Add thematic icons, such as medical symbols for healthcare applications.
- User-Friendly Layouts: Pre-aligned grids prevent misalignment, saving time on tweaks.
- Scalable Designs: Resize without distortion, ideal for large-screen projections or handouts.
These elements adhere to design standards from the American Statistical Association, promoting accurate representation to avoid misinterpretation of data intersections.
Slide-by-Slide Insights
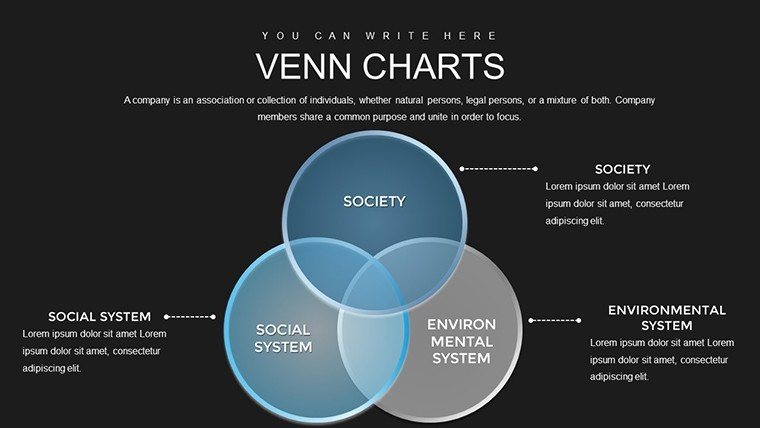
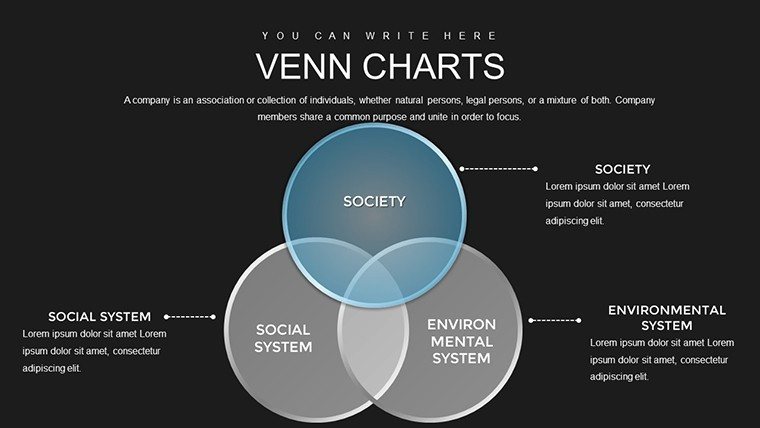
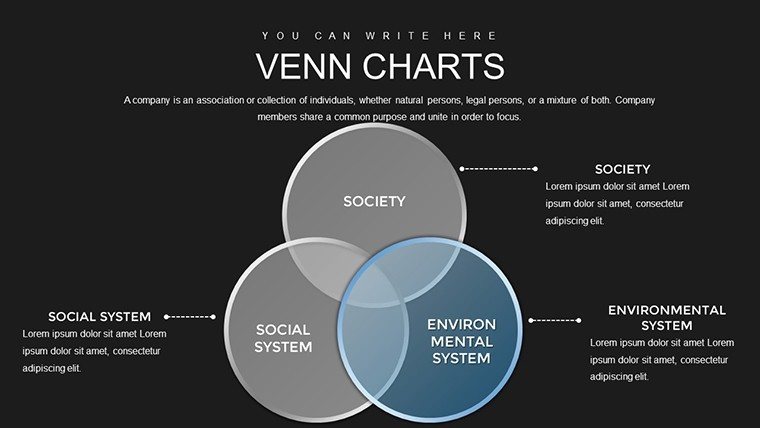
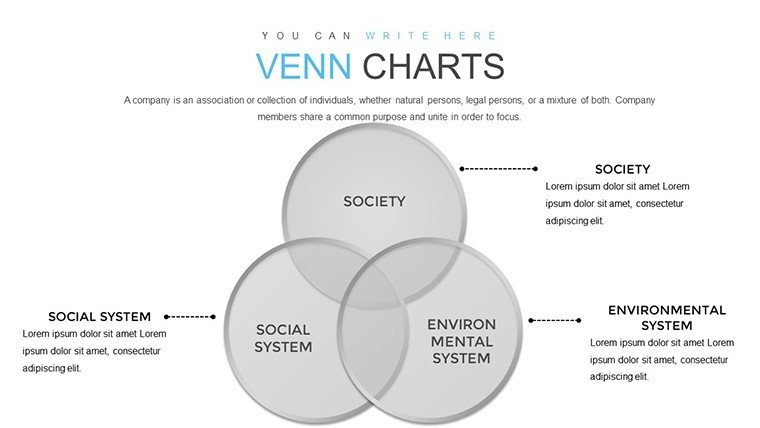
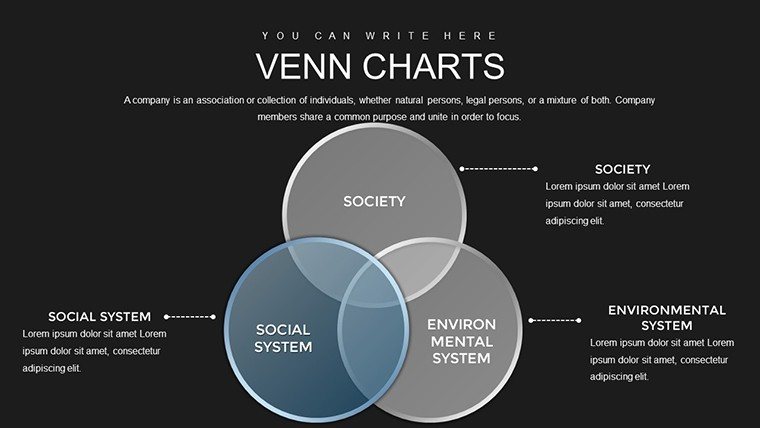
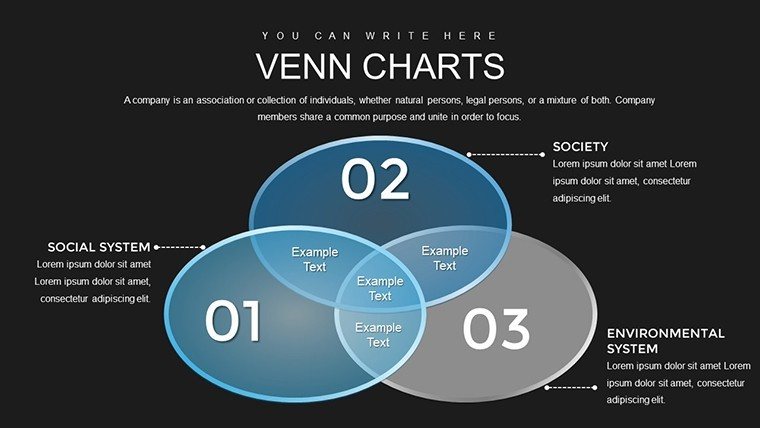
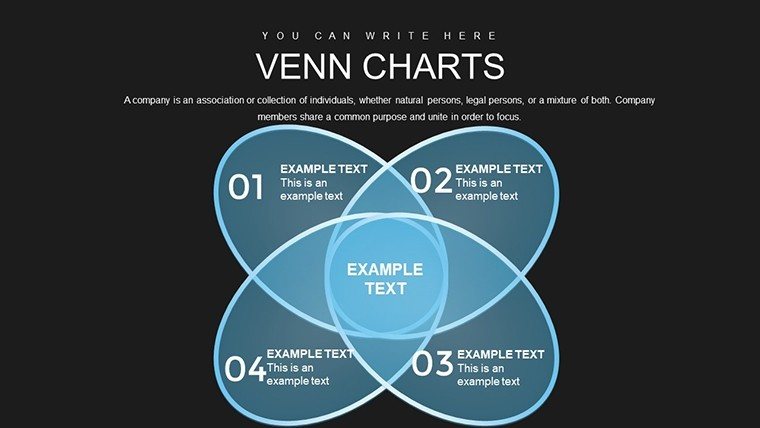
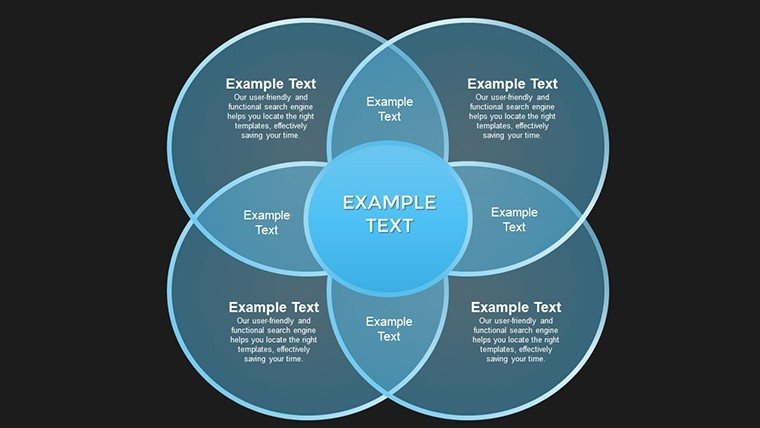
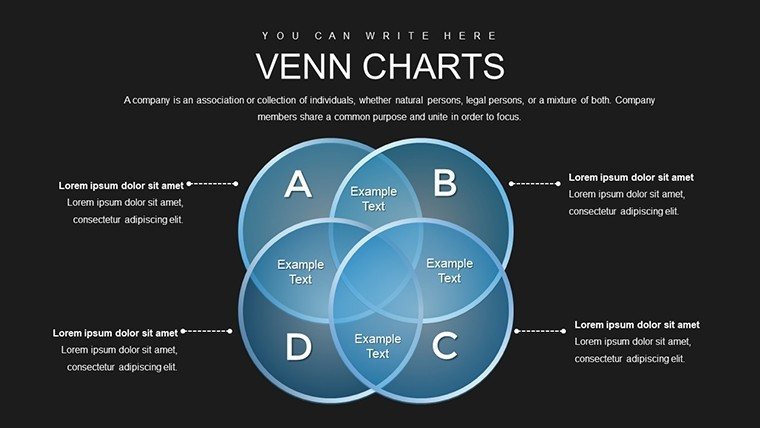
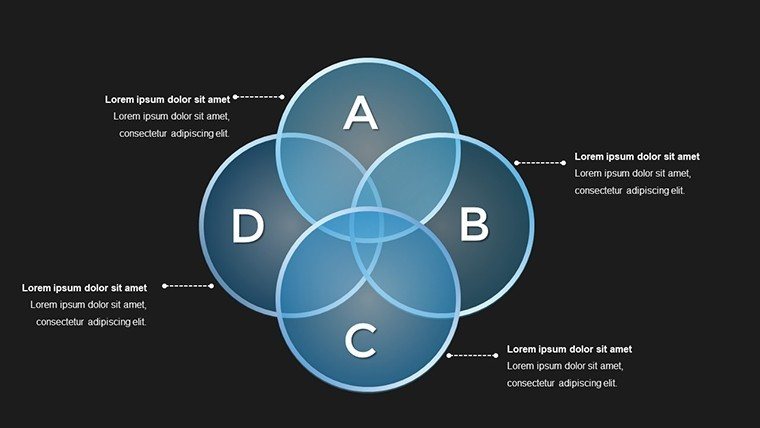
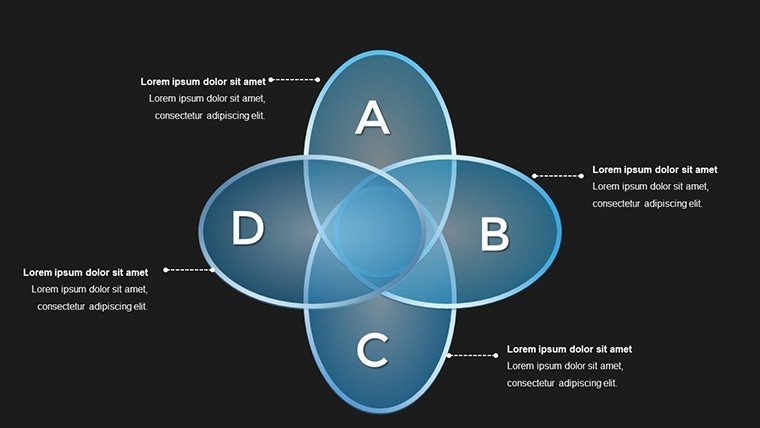
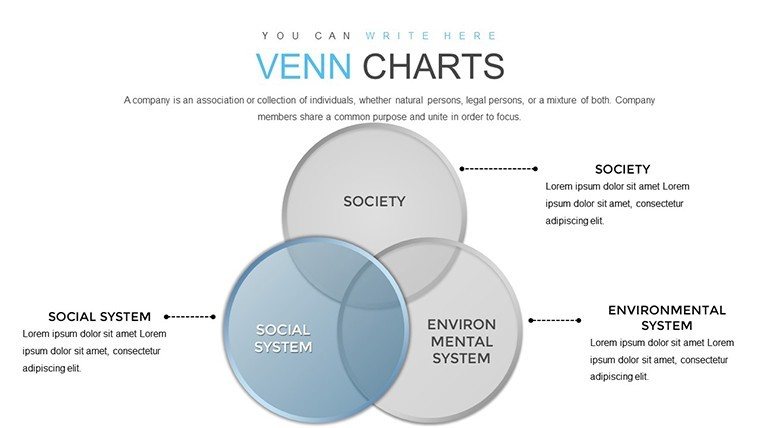
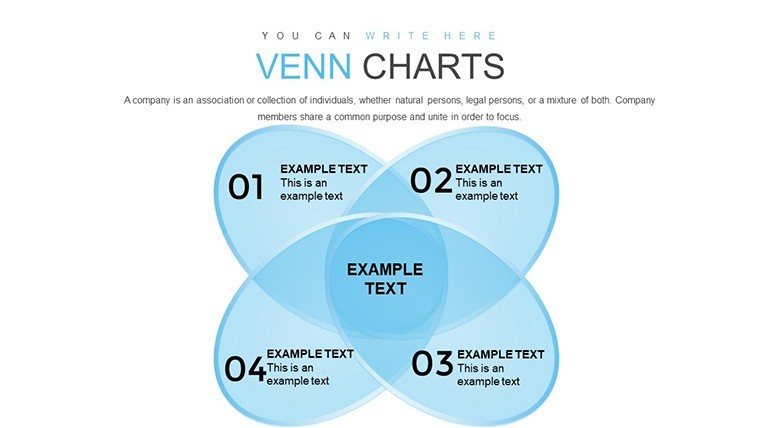
Begin with foundational slides: Slide 1 presents a classic three-circle Venn for introductory concepts, like merging team ideas in brainstorming. Slides 4-8 expand to four-circle variants, suited for market segmentation where overlaps reveal niche opportunities.
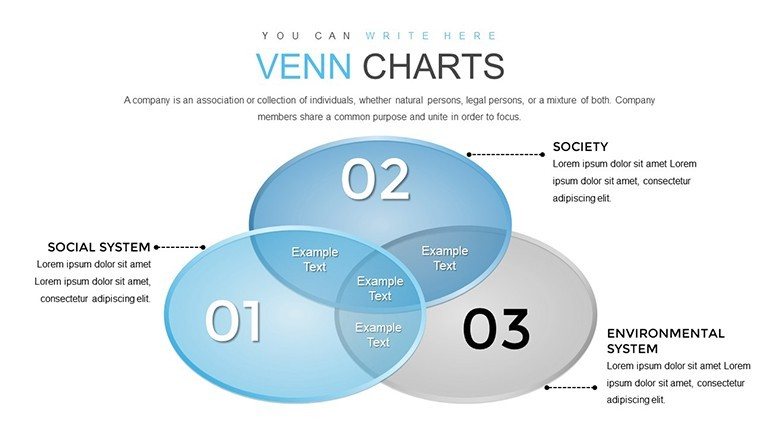
Deeper in, Slides 12-18 incorporate labeled zones with text boxes for detailed annotations, enhancing discussions on policy intersections in public sector work. The latter slides, 22-30, feature advanced layouts with gradients and shadows for 3D effects, making abstract ideas like ethical dilemmas in education more relatable. Each includes placeholder text to guide your content, ensuring logical flow.
Industry-Specific Applications and Advantages
This template excels in real-world contexts. In healthcare, use it to diagram symptom overlaps in diagnostics, as seen in case studies from the Journal of the American Medical Association, where visual aids improved team consensus. For finance pros, Venns clarify asset class intersections, aiding portfolio diversification strategies.
Educators can map curriculum overlaps, identifying interdisciplinary links that enrich learning, per pedagogical research. Benefits include enhanced audience retention - visuals like these boost recall by up to 65%, according to cognitive science. Versus standard PowerPoint Venns, ours offers more layers and smoother edits, minimizing design bottlenecks.
- Define Sets: Identify categories and their intersections based on your problem.
- Build the Diagram: Select a slide, populate circles with data - tip: use contrasting fills for clarity.
- Annotate and Refine: Add explanations in overlaps; iterate for balance.
- Engage in Delivery: Use builds to reveal sections progressively during talks.
Integrate with collaboration platforms like SharePoint for team input, or pair with analytics software for data feeds. Feedback from users highlights quicker problem resolution in workshops.
Advanced Tips to Enhance Your Delivery
Apply Euler's extensions for non-overlapping sets when needed, adding nuance to analyses. For trustworthiness, cite sources within slides, aligning with frameworks. A finance firm example: Employing customized Venns in risk assessments led to more informed board decisions, per industry reports.
This isn't mere slides - it's a catalyst for clearer thinking. Empower your problem-solving today.
Step up your game - download this Venn Diagrams PowerPoint Charts Template and turn complexities into conquests.
Frequently Asked Questions
How many sets can I represent in one diagram?
Up to five, with customizable layouts for clear visualization.
Is the template suitable for beginners?
Yes, intuitive designs make it accessible for all skill levels.
Can I adapt it for specific industries?
Absolutely, with flexible colors and icons tailored to fields like healthcare or finance.
What about updates or support?
Free updates included, plus round-the-clock support for customization help.
Is commercial use permitted?
Yes, fully licensed for professional and business applications.
Good for
- Project roadmaps and sprint plans
- Product launch timelines
- Quarterly or annual review decks
- Company history and milestone summaries
Licence
reviews
The Venn diagrams here have clean overlaps and professional shading. Used for business strategy session - helped map market overlaps clearly.
Editable in PPTX with good compatibility. Multiple set varieties useful.
Deadline friendly: quick to populate with team data. Looked sharp.
Mixed tones on icon integration but core diagrams solid.
Student project: made abstract relations concrete. Engaging.
The color coding enhanced understanding. Reliable template.
FAQ
Will it work in Google Slides?
Are fonts embedded?
Can I use this for client work?
What's the refund policy?
Do you update the template after purchase?
Similar templates
See all PowerPoint Charts →
All 30 slides